


Orthorexia nervosa (ON) is an extreme eating behaviour characterised by a pathological fixation with healthy eating and proper nutrition. The term was first coined in 1997 from the Greek words ‘ortho’, meaning correct, and ‘orexia’, meaning appetite(Reference Bratman and Knight1). In ON, the pursuit of a ‘correct’ or ‘pure’ diet becomes obsessive, leading to a self-imposed, highly rigid dietary pattern that eliminates foods or entire food groups perceived to be unhealthy. While not a clinically recognised eating disorder(2), in the recently proposed diagnostic criteria, researchers(Reference Dunn and Bratman3,Reference Cena, Barthels and Cuzzolaro4) offer the following fundamental characteristics for the diagnosis of this condition: (i) an obsessive and excessive focus on particular healthy eating beliefs or theories; (ii) exaggerated emotional responses, such as guilt, anxiety or fear of disease, in response to dietary transgressions; and (iii) eventual escalation of dietary restrictions. As the preoccupation with healthy eating is taken to the extreme, individuals with ON may experience malnutrition and significant weight loss from the severely restricted diet(Reference Moroze, Dunn and Holland5) and social isolation from foregoing events that involve food(Reference Mathieu6).
Despite the lack of formal recognition for ON as an eating disorder, there has been growing interest among researchers, dieticians and community members alike in identifying individuals with orthorexic tendencies. The current literature surrounding ON is dominated by studies investigating its prevalence within the population, with the majority using a tool called the ORTO-15. Existing ON prevalence estimates have varied widely. In the general Italian population, ON prevalence has been shown to range from 6·9 to 57·6 %(Reference Donini, Marsili and Graziani7,Reference Ramacciotti, Perrone and Coli8) . In specific populations, such as a sample of Brazilian dietitians and Spanish yoga practitioners, rates were as high as 81·9 and 86·0 %, respectively(Reference Herranz Valera, Acuña Ruiz and Romero Valdespino9,Reference Alvarenga, Martins and Sato10) . These high rates are concerning for a relatively new phenomenon, particularly when compared to the prevalence rates of established eating disorders such as anorexia nervosa, which range from 2 to 4 % in the general population(Reference Smink, Van Hoeken and Hoek11). As a result, questions have been raised over the reliability and validity of the ORTO-15 as a measure of ON.
The ORTO-15, originally developed and validated in Italian, was translated into English for publication with no further validation of the English version of the scale(Reference Donini, Marsili and Graziani7). Since then, internal consistency of the scale has come under scrutiny due to discrepancies between studies, with some reporting unacceptable Cronbach’s α coefficients (0·31(Reference Alvarenga, Martins and Sato10); 0·23(Reference Roncero, Barrada and Perpiñá12)), while others have found respectable values (0·79(Reference Segura-García, Papaianni and Caglioti13); 0·83(Reference Koven and Senbonmatsu14)). Studies that have made efforts to strengthen the reliability and validity of the ORTO-15 have also revealed varying results. Different factor structures, ranging from one-factor to three-factor solutions, have been suggested, and various items have been removed based on negative item–total correlations, confirmatory factor analysis or exploratory factor analysis, leading to multiple scale variations(Reference Alvarenga, Martins and Sato10,Reference Brytek-Matera, Krupa and Poggiogalle15–Reference Barnes and Caltabiano19) .
Given the methodological issues with the ORTO-15, a twenty-one-item ON measure called the Eating Habits Questionnaire (EHQ) was developed and validated in English by Gleaves et al. (Reference Gleaves, Graham and Ambwani20). Preliminary evidence indicates that the EHQ has more promising psychometric properties than the ORTO-15 (in all its various forms). Construct validity was demonstrated by Gleaves et al. (Reference Gleaves, Graham and Ambwani20) through strong correlations with other measures of disordered eating behaviour (Eating Attitudes Test-26; Bulimia Test–Revised), and weaker correlations with measures of personality and general psychopathology. However, apart from the original validation study, the EHQ has only been used by a few other published studies(Reference Oberle, Samaghabadi and Hughes21–Reference Oberle and Lipschuetz23), and slight differences have been found. While a similar three-factor structure for the EHQ was demonstrated by Oberle et al. (Reference Oberle, Samaghabadi and Hughes21), three items that initially loaded onto the Problems subscale loaded onto the Knowledge subscale, which the authors subsequently renamed the Behaviours subscale. These subscales were then used by Oberle and Lipschuetz(Reference Oberle and Lipschuetz23) and Oberle et al. (Reference Oberle, Watkins and Burkot22). In light of this ambiguity, there is a need for further evaluation of the EHQ’s psychometric properties and its suitability as a measure of ON.
To date, few studies have examined the EHQ as a measure of ON, and no published study has compared the two existing measures of ON. The primary aim of the present study was to analyse the underlying factor structure of the EHQ and further investigate the scale’s psychometric properties by assessing its internal consistency (reliability) and its relationship with the ORTO-15 (criterion-related validity). It was expected that the factor structure of the EHQ in the present study would replicate that of previous research, and each subscale would demonstrate high internal consistency. As the EHQ and ORTO-15 purport to measure the same construct, it was also predicted that these two scales would be highly correlated with each other, demonstrating criterion-related validity. The study also sought to investigate the relationship between the EHQ and dietary adequacy and how this compares with the ORTO-15. Given that ON involves the exclusion of certain food groups and a preference for other food groups, it was expected that for women with higher levels of ON, the consumption of cereals and grains, dairy and meat/meat alternatives would be inadequate while the consumption of fruit and vegetables would likely be adequate.
Methods
Study population
The sample consisted of 286 female adults ranging in age from 17 to 73 years (M = 31·08, sd = 11·60) with an average BMI of 24·62 kg/m2 (sd = 5·31). Most participants had completed an undergraduate (42·0 %) or postgraduate (25·7 %) university degree and were identified as Caucasian (79·4 %) or Asian (14·3 %) based on self-reported ethnicity.
Study procedure
The present study was an analysis of cross-sectional data from a questionnaire study on ‘Food-Related Claims and Eating Behaviours’. Potential participants were invited to complete an anonymous survey, which included questions on demographic information, both the EHQ and ORTO-15, and a measure of food consumption. Participants were recruited via an anonymous web link posted on social media pages of dietitians, nutritionists and food bloggers and a university’s research page. Face-to-face recruitment with a paper-based version of the survey was also conducted at the campus of a medium-sized South Australian university with anonymous return via reply-paid envelopes. Return of the questionnaire was considered as informed consent.
Participants who were aged ≥17 years could participate in the study. Given the differences in eating behaviour and dietary recommendations for men and women(24) as well as the prevalence of disordered eating symptomatology, only data from women were included in the present study. Originally, 500 people commenced the survey. Of these, seventy-one men were excluded and a further 139 potential female participants did not complete the EHQ and were excluded from subsequent analyses. Data from a further four participants were excluded as age was either not reported (n 3) or the participant was under 17 years (n 1). Excluded participants were significantly younger (t(495) = 3·20, P = 0·001, M = 27·86, sd = 10·71) than included participants, but did not differ on BMI (t(469) = 0·99, P = 0·323, M = 24·16, sd= 4·61).
Study measures
Demographic information
Participants provided demographic information including their age, sex, height, weight, ethnicity and education level. Self-reported height and weight were used to calculate BMI (kg/m2).
Eating Habits Questionnaire
The EHQ is a twenty-one-item self-report measure developed for the assessment of ON symptomatology(Reference Gleaves, Graham and Ambwani20). The EHQ is composed of three subscales that measure the problems associated with healthy eating (twelve items, e.g. ‘I turn down social offers that involve eating unhealthy food’), knowledge of healthy eating (five items, e.g. ‘I am more informed than others about healthy eating’) and positive feelings about healthy eating (four items, e.g. ‘I feel in control when I eat healthily’). Items are scored on a four-point scale ranging from 1 (false, not at all true) to 4 (very true). The scores for individual subscales and the total scale were summed, with higher scores indicating increased ON tendencies. Gleaves et al. (Reference Gleaves, Graham and Ambwani20) reported high internal consistencies for the three subscales (Cronbach’s α = 0·82−0·90). Oberle et al. (Reference Oberle, Samaghabadi and Hughes21) found comparable Cronbach’s α coefficients for the total scale (0·90) and the three subscales (α = 0·73−0·87). In the present study, Cronbach’s α for the total scale was also comparable (0·89).
ORTO-15
The ORTO-15 is a fifteen-item self-report measure designed to assess ON symptoms(Reference Donini, Marsili and Graziani7). The questionnaire represents the cognitive (six items, e.g. ‘Do you think that consuming healthy food may improve your appearance?’), clinical (five items, e.g. ‘Does the thought of food worry you for more than 3 h a day?’) and emotional (four items, e.g. ‘Do you feel guilty when transgressing?’) aspects of ON. Items were scored on a four-point scale (never, sometimes, often and always). The scores for each item were summed with composite scores ranging from 15 to 60. Lower overall scores indicated increased ON tendencies. Among studies that have utilised the ORTO-15, internal consistency of the scale (in its multiple variations) has previously been reported to range between α = 0·23 and 0·83(Reference Roncero, Barrada and Perpiñá12,Reference Koven and Senbonmatsu14) . In the current sample, internal consistency of the original fifteen-item scale was α = 0·50. Following Barnes and Caltabiano(Reference Barnes and Caltabiano19), items with negative item–total correlations or no correlation were deleted to increase the scale’s internal consistency (items 1, 2, 8, 9, 13). The internal consistency of the scale consisting of ten items was α = 0·76. This revised ten-item version (ORTO-10) was used in subsequent analyses.
Dietary adequacy
Dietary adequacy was assessed using ten self-reported short food survey questions developed to estimate compliance with the Australian Dietary Guidelines(Reference Hendrie, Rebuli and Golley25). The questions assessed participants’ usual food intake over the past week. Participants were asked to indicate the number of servings per day they consumed from each of the following food groups: fruit, vegetables, meat and alternatives (e.g. legumes, eggs, tofu), dairy, cereals and grains, and discretionary foods (e.g. chocolates, cakes, biscuits, soft drinks). Responses were coded as either meeting or not meeting the Australian Guide to Healthy Eating’s (AGHE) recommended servings per day for adult women (2 servings of fruit, 5 servings of vegetables, 2·5 servings of meat and alternatives, 2·5 servings of dairy, 6 servings of cereals and grains and up to 2·5 servings of discretionary foods(24)).
Statistical analyses
IBM SPSS (version 22) was used for all statistical analyses, with a P-value <0·05 considered statistically significant. Sample size was based upon the number of participants required to conduct factor analysis, whereby authors suggest a minimum n > 200(Reference Kyriazos26). The final sample (n 286) was sufficient to detect a medium effect size (power = 0·80, P = 0·05)(Reference Cohen27). To assess the underlying factor structure of the EHQ, exploratory factor analysis with direct oblimin rotation was conducted. The number of factors retained was based on eigenvalues >1·0 and inspection of the scree plot. Items were required to exhibit factor loadings ≥0·30 to be considered part of that factor. If an item exhibited loadings at this level for more than one factor, it was placed in the factor with the higher loading. The internal consistency of the EHQ and each of the EHQ subscales was assessed by Cronbach’s α. Criterion-related validity was examined by computing Pearson’s correlation coefficients between the EHQ and the measure of orthorexia, the ORTO-10. Correlation coefficients ≥0·50 were considered strong; coefficients between 0·30 and 0·50 were considered moderate; and coefficients between 0·10 and 0·29 were considered weak(Reference Cohen28).
To compare the ability of the EHQ and ORTO-10 in predicting dietary adequacy, logistic regression analyses were used to explore the relationship between EHQ subscale scores and the ORTO-10 score (independent continuous variables), and meeting recommendations for each food group (dependent categorical variable). Pairwise deletion was used in the case of missing data for all analyses.
Results
Principal components analysis of the EHQ
The factorability of the data was supported as the Kaiser–Meyer–Olkin value of 0·87 exceeded the recommended value of 0·60, and Bartlett’s test of sphericity was significant (P < 0·001). Four factors were extracted by principal components analysis, which accounted for 54·4 % of the total variance. Following direct oblimin rotation, the rotated solution revealed that items 5, 6 and 16 showed high loadings on multiple factors. The final number of items placed in each factor, with respective factor loadings, is outlined in Table 1.
Table 1 Eigenvalues, variance explained and factor loadings of the pattern matrix for the twenty-one-item Eating Habits Questionnaire (EHQ) following principal components analysis with direct oblimin rotation (n 286)

* Values indicate the factor on which the item was ultimately placed. h2 = communality.
† Values indicate a high (>0·3) double loading on two factors.
The four factors were interpreted and named based on the ON concepts they most strongly reflected. The first factor consisted of six items that describe the perceptions and thoughts about healthy eating and was named ‘Healthy Eating Cognitions’. The second factor consisted of three items representing the dietary restrictions associated with healthy eating beliefs and was named ‘Dietary Restriction’. The third factor consisted of seven items that reflected the superior knowledge and habits related to healthy eating behaviours and was named ‘Diet Superiority’. Lastly, the fourth factor consisted of five items that mainly reflected the social impact of over-prioritising healthy eating. This factor was named ‘Social Impairment’ (Table 1).
Internal consistency
Cronbach’s α coefficient for the total EHQ scale was 0·89, while that for the four factors were: EHQ–Healthy Eating Cognitions, 0·77; EHQ–Dietary Restriction, 0·72; EHQ–Diet Superiority, 0·80, and EHQ–Social Impairment, 0·77.
Criterion-related validity
As shown in Table 2, there was a significant correlation between the total EHQ scale and ORTO-10 (r = −0·54, P < 0·001). The EHQ–Healthy Eating Cognitions scale was most strongly correlated with the ORTO-10 (r = −0·65, P < 0·001), demonstrating a stronger correlation than the overall EHQ scale (Table 2). Negative correlations were expected due to the different scoring of the EHQ (higher scores indicate ON) and ORTO-10 (lower scores indicate ON). Table 2 also includes the ORTO-15 for comparison with other studies.
Table 2 Pearson's correlation coefficients between the total Eating Habits Questionnaire (EHQ) scale, the EHQ subscales and the ORTO–10 (n 286)

* P < 0·001.
† Missing data due to non-response to ORTO-15 questions.
Relationship with dietary adequacy
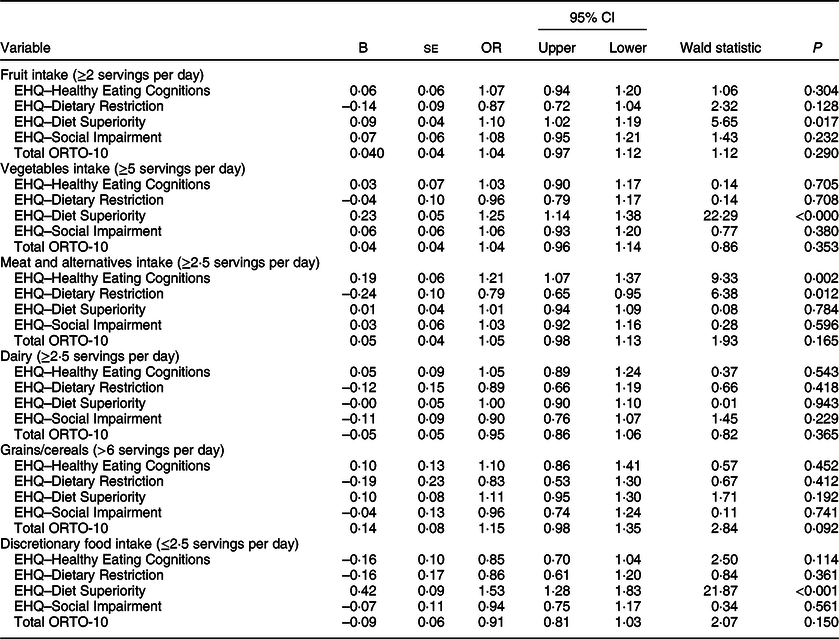
A logistic regression was run for each food group. Meeting recommendations for the food group was coded as ‘1’, and not meeting recommendations was coded as ‘0’. Overall, recommendations were met by 56·9 % of participants for fruit, 27·0 % for vegetables, 49·8 % for meat and alternatives, 14·2 % for dairy, 5·6 % for cereals/grains and 88·0 % for discretionary foods. Each logistic regression model contained five independent variables (EHQ–Healthy Eating Cognitions, EHQ–Dietary Restriction, EHQ–Diet Superiority, EHQ–Social Impairment and the ORTO-10). Results of logistic regression analyses showed that the full model containing all predictors was not statistically significant for two food groups (cereals and grains, and dairy), indicating that the EHQ and ORTO-10 were not able to distinguish between participants who met or did not meet recommendations for cereals, χ 2 (5, n 267) = 6·59, P = 0·253, or dairy intake, χ 2 (5, n 267) = 4·33, P = 0·502.
For the remaining food groups, a test of the full model against a constant-only model was statistically significant (fruit: χ 2(5, n 267) = 18·00, P = 0·003; vegetables: χ 2(5, n 267) = 45·89, P < 0·001; meat and alternatives: χ 2(5, n 267) = 17·13, P = 0·004; discretionary food: χ 2(5, n 267) = 37·31, P < 0·001). For fruit, vegetables and discretionary food intake, only the EHQ–Diet Superiority scale made a unique statistically significant contribution to the model, with higher scores on the EHQ–Diet Superiority scale associated with meeting the recommended intake for these food groups (Table 3). For meat and alternatives intake, the EHQ–Healthy Eating Cognitions and EHQ–Dietary Restriction scales, instead, made unique statistically significant contributions to the model. Higher scores on the EHQ–Healthy Eating Cognitions scale predicted adequate consumption of meat and alternatives (Table 3). Conversely, participants who had higher scores on the EHQ–Dietary Restriction scale were less likely to meet the AGHE guidelines for adequate consumption of meat and alternatives (Table 3).
Table 3 Summary of logistic regression analyses predicting fruit, vegetables, meat and alternatives and discretionary food intake (n 267)*
EHQ, Eating Habits Questionnaire.
* Missing data due to non-response to food frequency questions.
Discussion
The present study examined the EHQ as a measure of ON symptomatology by comparing it to an existing measure of ON, the ORTO-10 (a ten-item version of the ORTO-15). Results indicate that the EHQ may be better conceptualised by four factors: thoughts about healthy eating, dietary restriction, diet superiority and social impairment. While the scale as a whole demonstrated high internal consistency, weaker reliability estimates were found for the EHQ subscales. Overall, the EHQ was related to the ORTO-10; however, the EHQ appeared limited in predicting dietary intake consistent with recommendations. Only the EHQ–Diet Superiority scale predicted adequate consumption of fruit, vegetables and limiting of discretionary food. The EHQ–Healthy Eating Cognitions scale predicted adequate consumption of meat and alternatives, while the EHQ–Dietary Restriction scale was associated with a reduced likelihood of meeting recommendations for meat and alternatives intake. No associations were found between the ORTO-10 and dietary adequacy of any food group.
In the present study, exploratory factor analysis revealed four factors (Healthy Eating Cognitions, Dietary Restriction, Diet Superiority and Social Impairment) on the EHQ. Overall, the item content of these factors mostly failed to echo the ON dimensions suggested by previous research(Reference Gleaves, Graham and Ambwani20,Reference Oberle, Samaghabadi and Hughes21) . For example, the Diet Superiority subscale proposed in the present study (seven items) reflects the belief that one’s diet and knowledge about healthy food is superior to others (similar to the Knowledge subscale), but also includes feelings of satisfaction in relation to one’s diet (previously in the Feelings subscale). In addition, while the previous Problems subscale incorporated both obsessiveness and rigidity around healthy eating and associated social consequences, the factor structure in the present study separates these constructs. The proposed Dietary Restriction subscale (three items) reflects adherence to dietary rules and the belief that few foods are healthy for the individual, and the proposed Social Impairment subscale (five items) reflects the impact that current eating practices may have on social engagements. Lastly, the proposed Healthy Eating Cognitions subscale (six items) does not map directly back to the previously proposed subscales and, instead, reflects the amount of time spent thinking about healthy food/eating healthily and its importance.
As the current sample was demographically similar to the populations in which the EHQ was originally tested – English-speaking, predominantly Caucasian and female participants(Reference Gleaves, Graham and Ambwani20) – it is unlikely that a different factor structure emerged due to cultural differences between samples(Reference Burkhardt, Loxton and Kagee29,Reference Ho, Cooper and Hall30) . However, while a four-factor solution provided the best conceptual fit, factors were still not clearly separable due to the presence of multiple cross-loading items. This suggests problems with item construction (e.g. an item reflects multiple dimensions of ON, or its meaning is ambiguous(Reference Costello and Osborne31)). DeVellis(Reference DeVellis32) notes that the ability of a set of items in a scale to perform as it was originally hypothesised ultimately determines its validity. It is unknown whether the factor structure of the EHQ will remain stable over repeated administrations in different samples. This highlights the need for refinement of the EHQ. This may include deleting or revising items that have strong cross-loadings on multiple factors such that they significantly reflect only one dimension of ON, and the addition of items to improve internal consistency.
The present study also examined the criterion-related validity of the EHQ, established through a significant correlation between the total EHQ scale and ORTO-10. Additionally, the Healthy Eating Cognitions subscale demonstrated a stronger correlation with the ORTO-10 than the composite scale, indicating that the items in ORTO-10 may more strongly represent cognitive aspects of healthy eating. Thus, the EHQ could be another potentially useful measure for studying ON symptomatology, particularly in assessing individuals’ thoughts and perceptions around healthy eating. However, this result should be interpreted in the context of certain limitations, particularly in the use of ORTO-10 as a criterion measure. Due to the low Cronbach’s α of the fifteen-item version of the scale and following previous research(Reference Brytek-Matera, Krupa and Poggiogalle15,Reference Missbach, Hinterbuchinger and Dreiseitl16,Reference Barnes and Caltabiano19) , we utilised a ten-item version of the scale. However, the need to remove items reflects the inconsistent and unpredictable performance of ORTO-15. Thus, it is unclear whether the significant agreement found between the ORTO-10 and EHQ in the present study would remain when tested in different samples.
Overall, as predicted, the EHQ was a better independent predictor of dietary adequacy than the ORTO-10. In particular, increased ON tendencies, particularly dietary superiority associated with ON, were predictive of better dietary adequacy. Only one other study has investigated the relationship between ON and food intake, using the shortened Hungarian version of ORTO-15 – the ORTO-11-Hu(Reference Varga, Thege and Dukay-Szabó17). Interestingly, increased ON tendencies were also found to be associated with healthier eating habits, particularly increased consumption of whole wheat cereals(Reference Varga, Thege and Dukay-Szabó17). With the nature of items in the EHQ–Diet Superiority subscale reflecting an individual’s superior knowledge of healthy eating and moral judgement of others with differing habits, the relationship between this scale and adequate consumption of fruit, vegetables and discretionary foods may be explained by perceptions of these food groups. For example, individuals commonly associate fruit and vegetables as part of a healthy diet(Reference Lake, Hyland and Rugg-Gunn33). Limiting intake of meat, fish and alternatives, as well as foods high in fat and/or sugar (i.e. discretionary foods), is also consistently perceived as healthy eating behaviours(Reference Lake, Hyland and Rugg-Gunn33,Reference Paquette34) .
Individuals with higher scores on the EHQ–Dietary Restriction subscale were less likely to meet recommendations for the intake of meat and alternatives. The self-imposed dietary restriction associated with ON commonly begins with the adoption of healthy eating theories, particularly pseudoscientific theories that tend to be centred on restrictive eating patterns (e.g. macrobiotic diet, paleo diet, raw-foodism)(Reference Bratman and Knight1). Thus, the observed finding could be attributed to a number of participants in this study adhering to prominent dietary theories that espouse cutting out meat, with insufficient replacement from alternative sources of protein. Indeed, powered by social media, dietary patterns that recommend a reduction in meat intake have grown in popularity in recent times under the so-called ‘clean eating’ movement(Reference Wilson35). However, recent research suggests that orthorexic eating behaviour is not related to a vegan lifestyle, but rather shares similar health-related motivations(Reference Barthels, Poerschke and Müller36). As the adherence to specific dietary preferences was not accounted for here, this could not be further explored. Future research should aim to investigate participants’ adherence to specific dietary preferences and their potential impact on orthorexic behaviours and disordered eating symptomatology.
Overall, results of the present study indicate that improvements need to be made to the EHQ for it to be a valid and reliable measure of ON. The EHQ appears to be a better measure of normal healthy eating habits, rather than orthorexic tendencies. Other authors have also criticised the lack of comprehensiveness of the EHQ as a measure of ON, specifically that it does not adequately cover compulsive behaviours or emotional distress associated with ON(Reference Roncero, Barrada and Perpiñá12,Reference Koven and Abry37) . This is apparent when comparing the content of EHQ to the recently proposed diagnostic criteria for ON(Reference Dunn and Bratman3). The EHQ fails to reflect the more defining characteristics of ON as outlined in Dunn and Bratman’s(Reference Dunn and Bratman3) proposed criteria, such as the escalating nature of dietary restrictions, excessive meaning placed on food, and the significant emotional distress when violating the self-imposed diet. While the items may allude to these characteristics, their overall meaning is often ambiguous and can easily be interpreted as behaviours of healthy eating (e.g. ‘I follow a diet with many rules’, ‘I feel great when I eat healthily’, ‘The way my food is prepared is important in my diet’). Furthermore, Dunn and Bratman(Reference Dunn and Bratman3) suggest that moral superiority displayed by individuals with ON is not an essential feature for diagnosis, yet it formed a substantial and standalone subscale of the EHQ in this study. Similar to the ORTO-15, a pitfall of the EHQ could be that items do not represent significant impairment of ON, thus only reflecting the adoption of healthy eating behaviours, but not its intensification into obsessive and pathological behaviour.
The present findings should be considered in light of several limitations. First, the study used a sample of convenience, with participants recruited mainly from social media platforms of health- and food-related professionals. Thus, it is possible that participants who were interested in health and nutrition, and who were more likely to have healthy eating habits, may have self-selected to commence the survey(Reference Bethlehem38). Second, as all data were self-reported, responses to the questionnaires may have been subject to recall bias and/or social desirability bias(Reference Hebert, Clemow and Pbert39). For example, the use of food frequency questions to assess dietary adequacy, and in particular intake of fruit and vegetables, has been shown to be overestimated(Reference Cade, Burley and Warm40), while the intake of high fat or sugary foods, such as sweets, soft drinks and crisps, tends to be underreported(Reference Wong, Parnell and Black41). In addition, the dichotomised nature of our evaluation of dietary adequacy cannot distinguish between individuals who were adequate v. those who were supra-adequate in meeting dietary guidelines for food groups. This could have resulted in someone with severe ON still meeting recommendations for certain food groups, although this would be highly unlikely given the low proportion of the Australian population that meets recommendations for any food groups(42). Another limitation is that we evaluated adequacy of dietary intake using estimates of food group servings in relation to servings recommended by dietary guidelines. Further research should aim to quantitatively assess individual dietary intakes among people with orthorexia using weighed food records to determine usual food and nutrient intakes and likely inadequacies or excess.
Future studies on the EHQ could focus on item review and refinement, as well as further validation of the EHQ. However, given that both the EHQ and ORTO-15 were developed before any formal diagnostic criteria were proposed, future research should focus on the construction of a new instrument that is grounded on standard and widely accepted diagnostic traits. The next step would be to create a consensus on the diagnostic criteria for ON(Reference Cena, Barthels and Cuzzolaro4), through consultations of experts in the field as well as corroboration of these criteria from validation studies(Reference Dell’Osso, Abelli and Carpita43). Following this, research within a clinically diagnosed population of individuals with ON would be beneficial, as this would allow for both the predictive value of an assessment tool to be determined, and further investigations into the construct of ON (e.g. discriminating between ON and other psychological disorders such as anorexia nervosa or obsessive-compulsive disorder). Despite ON not being a clinically recognised eating disorder, professionals in the field of eating disorders have been recognising this behavioural pattern in their own practice, and many believe ON deserves more attention(Reference Vandereycken44). The current study has taken the first step in the journey to conceptualise and assess ON. Further research is needed to understand the aetiology and symptomatology of ON and to uncover possible implications for practice. The development of a valid tool that can reliably detect individuals with ON would be invaluable in advancing our understanding of this phenomenon.
Acknowledgements
Acknowledgements: The authors would like to thank everyone who shared the study’s online questionnaire on their social media platforms. Financial support: This work was supported by the Flinders University Faculty of Medicine, Nursing and Health Sciences Small Grants Scheme. Conflict of interest: None. Authorship: All authors conceptualised the question and study design. Analysis was conducted by Z.M.H. and I.P. with input from K.M.D. and E.K. The initial draft of the manuscript was written by Z.M.H. with edits and critical feedback provided by I.P., K.M.D. and E.K. Ethics of human subject participation: This study was conducted according to the guidelines laid down in the Declaration of Helsinki, and all procedures involving study participants were approved by the Social and Behavioural Research Ethics Committee at Flinders University. Written informed consent was obtained from all subjects.


