

7.1 Introduction
Given the boom in demand, the decreasing returns of existing mining sites and the sustainability requirements, it is not surprising that mining-related commodities have seen a remarkable increase in price over the past two decades. Equally predictable was the well-documented boom in mining production and exports that followed. What has happened to the rate of mining-related innovation during this period remains an understudied topic.
In this chapter, we study the effect of variation in commodity prices on the innovation carried out within the mining industry. In particular, we look at whether the existence of cycles in commodity prices, distinguishing between short- and long-term cycles – the so-called super-cycles – affects innovation levels.
Given that mining companies are increasingly sourcing innovation from specialized suppliers, as noted in Chapter 1, we consider the mining industry in a broader technological sense. In addition to companies directly engaged in finding and developing mines, we include service providers that support the everyday activities of mining firms by providing specialized equipment and technology, a sector commonly referred to as the mining, equipment, technology and services (METS) sector. Innovation is proxied by patent filing. Mining-related patents filed by both mining firms and METS firms are part of the analysis.
This chapter relies on mining patent data consolidated by WIPO for the period 1970–2015. We merge the patent data with a series of indicators related to the mining sector based on data from the World Bank, namely a mineral commodity price index, an estimation of effective demand for mining production and the country’s exposure to mining. We identify price cycles of different lengths using the Christian and Fitzgerald band-pass filter (Reference Cuddington and JerrettCuddington and Jerret, 2008). We conduct the analysis first using time series and then using panel data.
We find empirical evidence of pro-cyclicality between innovation and prices in the mining sector. We model innovation as a response to changes in commodity prices and test for the effects of different cycle lengths. Our results suggest that innovation reacts more to long cycle changes rather than shorter ones. We also analyze the effect on mining innovation, distinguishing between innovation generated by mining companies and by METS firms. METS companies appear as the driving force of mining innovation response to price changes. When we move to the panel analysis, we find that mining specialized countries – as opposed to countries having little mineral production – only react to changes in the long cycle components of commodity price.
The rest of the chapter is structured as follows. Section 7.2 reviews the literature and provides motivation for the chapter’s main research questions. Section 7.3 presents the data while providing a descriptive overview of the mining industry innovation; it also discusses our estimation method. Section 7.4 comments on the results and the main robustness checks performed and Section 7.5 concludes.
7.2 Literature Review and Hypotheses
External macroeconomic and financial shocks certainly affect mining production, but little is known on how they translate to the sector’s technological change. Mining is considered a very cyclical sector. When prices are high, new mines are opened and existing mines are exploited more intensively. While when prices are low, production slows and mines are closed (Reference Batterham, Dowling and MarsdenBatterham, 2004). The way innovation and technology development react to these price cycles remains, to the best of our knowledge, an unexplored topic.
As part of the commodity super-cycle, mining-related commodities have seen an outstanding increase in price over the past 15 years, accompanied by a well-documented boom in mining production and exports. This period has not only been characterized by a high increase in prices but also higher volatility (IMF, 2015). Recent work has shown that mining innovation – proxied by patent applications –has followed this boom in general, but it has also trended down after the global financial crisis (Reference Daly, Humphreys, Valacchi and RaffoDaly et al., 2019b).
There have been many studies about trends and cycles in commodity prices (Reference RadetzkiRadetzki, 2006; Reference TiltonTilton, 2006). A few of these, such as Reference Labys, Achouch and TerrazaLabys, Achouch and Terraza (1999), have focused on mining commodities by analyzing the relationship between metal prices and business cycles. But in general, there has been less attention on the economic effects of the longer cycles of these prices. Traditionally, economic scholars have been very skeptical about the presence of these commodities “super-cycles” (Reference Cogley and NasonCogley and Nason, 1995; Reference HowreyHowrey, 1968). However, a number of relatively recent studies have begun to shed some light on the topic (Reference Comin and GertlerComin and Gertler, 2006; Reference Cuddington and JerrettCuddington and Jerret, 2008; Reference SolowSolow, 2000). They find empirical evidence of substantially more volatile and persistent fluctuations in the medium- and long-term of business cycles and commodity prices, respectively.
What happened to the innovation rate of mining-related technologies during the recent period? Given the rigidity that characterizes mining sector investment, it seems plausible that R&D decisions will be based more on expectations about long-term variation of price rather than short-term ones. The existing literature has focused on how R&D expenditures vary over business cycles, although never focusing on mining or other commodity sectors. The traditional view is that recessions should promote various activities that contribute to long-run productivity and thus to growth, such as technical change (Reference Canton and UhligCanton and Uhlig, 1999), job turnover (Reference Gomes, Greenwood and RebeloGomes et al. 2001) and human capital accumulation (Reference Barlevy and TsiddonBarlevy and Tsiddon, 2006). Many studies have found innovation to be pro-cyclical, measured by R&D activities (Reference BarlevyBarlevy, 2007; Reference FatasFatas, 2000; Reference Rafferty and FunkRafferty and Funk, 2004) or patents (Reference Geroski and WaltersGeroski and Walters, 1995). According to Reference Geroski and WaltersGeroski and Walters (1995), the direction of the causality seems statistically stronger for business cycles causing innovation than the opposite, although factors other than demand largely explain innovation. In what concerns the length of cycles, Reference BarlevyBarlevy (2007) argues that macroeconomic shocks are likely to have overly persistent effects due to such pro-cyclicality of R&D activities.
As highlighted in Chapter 2, the mining industry is typically considered a slow innovator (Reference Scherer and GrilichesScherer, 1984). Nevertheless, Reference BartosBartos (2007) shows that its rate of innovation is comparable with general manufacturing, even if it is still lower than so-called high-tech manufacturing (Reference DunbaraDunbara et al., 2016). The total amount of money spent on R&D by the sector is significant, particularly in mining-specialized countries such as Australia (Reference Balaguer, Palangkaraya, Talgaswatta and WebsterBalaguer et al., 2018).
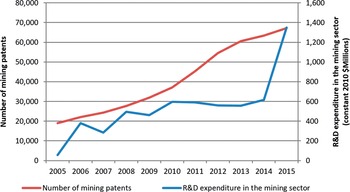
Figure 7.1 shows the private R&D expenditure in EU countries together with the Metals and Minerals Price Index from the World Bank. We can see a positive correlation between the two indicators with some delay of the R&D expenditure in reacting to price changes.

Figure 7.1 Private R&D expenditure in mining and quarrying in EU countries and World Bank Metals and Minerals Price Index.
Note: EU includes Austria, Belgium, Bulgaria, Croatia, Czech Republic, Denmark, Finland, France, Germany, Greece, Hungary, Iceland, Ireland, Italy, Lithuania, Netherlands, Norway, Portugal, Romania, Slovakia, Spain, and the UK.
In addition to R&D expenditure, the discovery of new commercially viable mining deposits through exploration is an important part of the economics of the industry, as highlighted in Chapters 1 and 2. The existing series of worldwide exploration expenditures show a high degree of correlation with the evolution of the price index for nonferrous metals (see Figure 7.2).
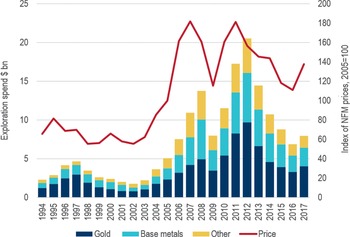
Figure 7.2 Mineral exploration expenditure by commodity and nonferrous metals price index.
METS companies contribute a substantial share of the innovation in the mining sector. These companies work very closely with mining companies to understand their requirements and to develop innovative solutions. METS firms invest, on average, more in R&D compared to mining firms (see Chapter 2). They also have lower capital expenditures than mining companies, which are required to have big initial investments both for the exploration phase and mining operations establishment. Mining firms often prefer to outsource services to specialized METS firms rather than taking it on themselves in a less efficient way. For instance, transport innovation in the mining sector is often produced by METS companies (see Chapter 5). Therefore, METS firms are an essential part of the mining innovation ecosystem.
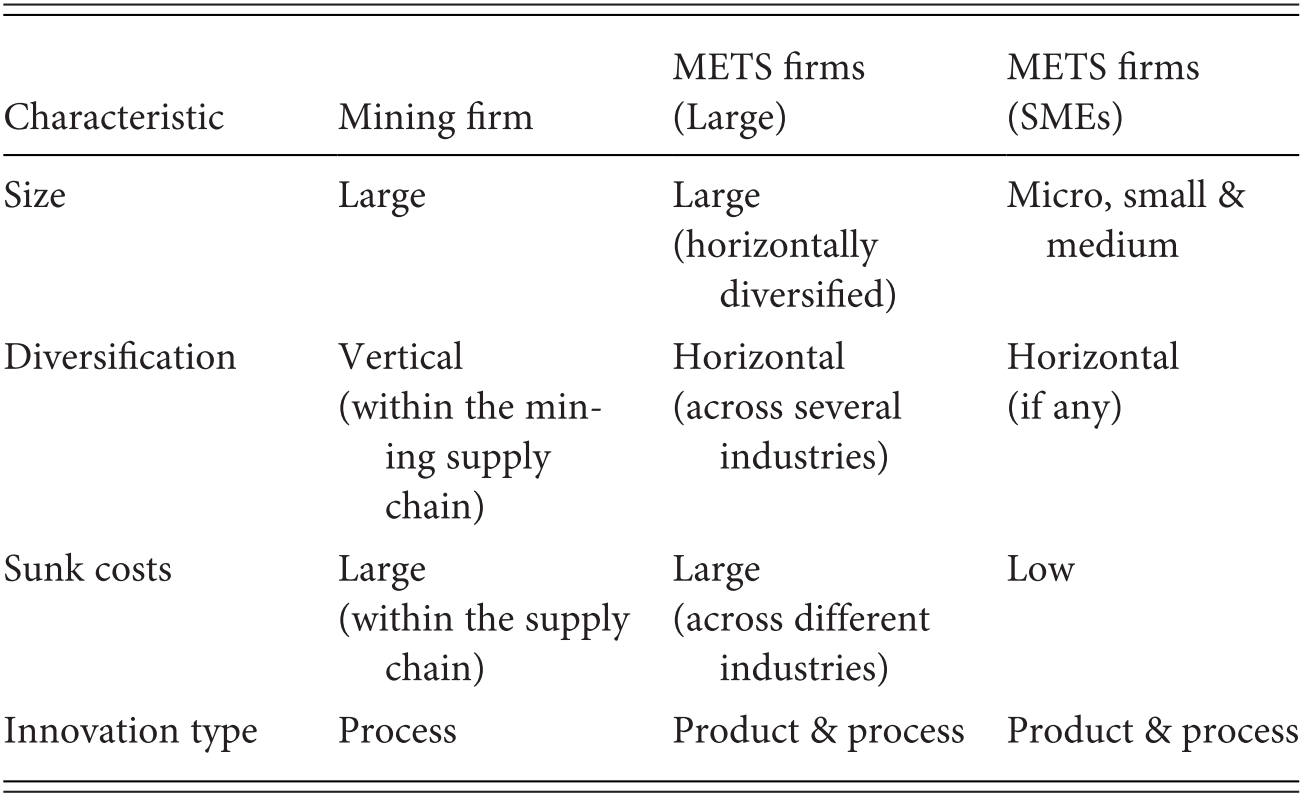
Table 7.1 summarizes the differences between mining and METS firms along crucial dimensions of their activity. In general, mining firms are large and they operate at different stages of the mining value chain. METS firms range from big multinationals (e.g. Caterpillar or Siemens), which not only provide specialized services for the mining sector, but also serve other industries; to SMEs, which are typically specialized in the production of one product or service specially developed for the mining activity.
Table 7.1 Characteristics of mining and METS firms
| Characteristic | Mining firm | METS firms (Large) | METS firms (SMEs) |
|---|---|---|---|
| Size | Large |
| Micro, small & medium |
| Diversification |
|
|
|
| Sunk costs |
|
| Low |
| Innovation type | Process | Product & process | Product & process |
On average, mining firms have higher sunk costs compared to METS firms. When opening a mine, the initial investment is very big and it can only be recovered after many years of operation. Therefore, their activity is not very flexible. METS firms are more flexible. They could also have high fixed costs but this applies more to large multinationals, which spread them across the different industries they serve, reducing the risk associated with their activity. Finally, mining firms produce mostly process innovation, while METS firms produce both new processes and new products that are then sold to the mining companies that use them to improve their performance.
Existing studies have shown several channels through which a price change could affect the decision to invest in innovation for other industries. Reference Barlevy and TsiddonBarlevy and Tsiddon (2006), Reference Canton and UhligCanton and Uhlig (1999) and Reference Gomes, Greenwood and RebeloGomes et al. (2001) find evidence of pro-cyclicality channels between prices and innovation in other industries. These studies suggest that the pro-cyclicality can be direct or indirect, where the latter is typically through the access to finance for the firm. Conversely, Reference BarlevyBarlevy (2007), Reference FatasFatas (2000), Reference Rafferty and FunkRafferty and Funk (2004) and Reference Geroski and WaltersGeroski and Walters (1995) suggest that a countercyclical effect can arise from the cost-reducing innovative effort.
How would the pro-cyclical effect apply to the mining sector? An increase in mineral prices could directly stimulate innovation for the mining firms, which have more disposable income to invest in innovation. A price increase also indirectly affects METS firms, as they experience a higher demand for their products/services from mining firms. Moreover, diversified METS firms may have stronger incentives to adapt technologies developed for other business.
At the same time, an increase in price also increases access to external finance of both types of firms; since financial markets’ assessment of discounted future income will also be related to the new price. Similarly, increased access to finance could boost investment in innovation. Therefore, both direct and indirect effects point toward the pro-cyclicality of innovation with respect to price.
How would the countercyclical effect apply to the mining sector? A price decrease imposes cost-reduction pressure on mining firms, which already operate with tight operating margins in many mining sites. Cost-reducing technologies could be an effective way to avoid the closure of mines. Similarly, mining companies may invest in exploration, aiming to discover new deposits with higher grades, hence more cost-effective. Either the cost-reducing or exploration-related technologies can be produced in-house or sourced from METS firms. This implies a countercyclical effect, where innovation is boosted, for both mining and METS firms, in periods of low prices.
The effect of a price decrease on the access to finance for firms is instead ambiguous. On the one hand, it definitely implies reduced access to external private finance as the risk profile of these firms is now higher. On the other hand, the bigger and more diversified firms could still rely on internal resources (for the case of big vertically integrated mining firms) or on revenues from other industries that they supply (for the case of big horizontally integrated METS). Moreover, in mining-specialized countries (e.g., Chile, Australia or South Africa), the large mining companies and the sector as a whole might be, arguably, too big to fail. Policy-makers may have strong incentives to aid the sector troubled by decreasing prices and innovation financing is one valid option.
We do not know which of these effects will prevail. Still, we can argue that the countercyclical effect is more likely to occur for shorter-term price variations. Typically, a mining company can cross-subsidize activities in the short term to iron out a price fluctuation expected to be temporary. If the price variation is expected to be structural (i.e. of a longer term), companies may be limited to the countercyclical innovative actions they can undertake. A similar logic applies to public financial support, although likely with a longer horizon. In any case, we can expect the ambiguous effect is less likely in the longer cycles.
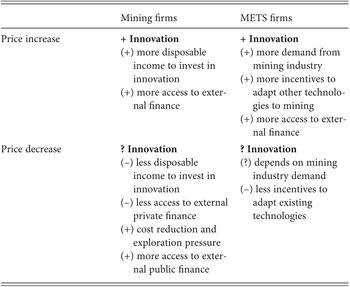
Table 7.2 summarizes the channels through which a commodity price change could affect the decision of both types of mining sector stakeholders to invest in innovation.
Table 7.2 Effect on innovation and access to finance of price change
| Mining firms | METS firms | |
|---|---|---|
| Price increase |
|
|
| Price decrease |
|
|
We can formulate the main conclusions from the existing literature as four distinct hypotheses, which we are going to test in this chapter:
H1a: Higher prices generate higher disposable income (direct or indirect) that is invested to generate more (pro-cyclical) innovation;
H1b: Lower prices generate higher cost reduction and exploration pressure generating (countercyclical) innovation;
H2: Price shocks do not affect innovation unless they are perceived as structural (i.e. long lasting);
H3: As METS firms can adapt other sectors’ technologies to mining, they are more likely to innovate more and faster due to price variation than mining firms; and,
H4: Mining specialized countries have stronger incentives to have countercyclical innovation policies.
7.3 Data and Methodology
In this section, we present and discuss the data used in our analysis. We then give an overview of the estimation methods used to study the relationship between commodity prices and innovation in the mining sector.
We use the World Bank Metals and Minerals Price Index as a proxy for an average global commodity price. This index weights the price of six commodities traded in the London Metals Exchange – aluminum, copper, lead, nickel, tin and zinc – plus iron ore, based on their world production shares. All the prices are reported in 2010 USD. The index is available from 1960 to 2017.
One limitation of such an index is that countries differ in their mining activities. Countries producing other mineral commodities than the seven minerals covered by the index or having a different weight of them, may react to other price variations than those captured by the index. In order to partially address this issue, we rely on an alternative measure of metal commodities price as a robustness check. In particular, we build a country-specific index using disaggregated commodity prices from the World Bank database,Footnote 1 weighting them based on export shares for each country. We extract data on commodity trade by country of origin from Reference Feenstra, Lipsey, Deng, Ma and MoFeenstra et al. (2005). These data are classified by SITC codes. We were able to match SITC codes of export flows with products’ prices from the World Bank.Footnote 2
Following Reference Cuddington and JerrettCuddington and Jerret (2008), we decompose the natural logarithm of the de-trended commodity price in cycles of different lengths: long cycleFootnote 3 (from 20 to 70 years), medium cycle (from 10 to 20 years), short cycle (from 5 to 10 years) and a residual component (less than 5 years). Figure 7.3 plots the de-trended price index across and the different component cycles of the price index. The long and medium cycles show a relatively smooth variation over time. The short cycles exhibit more sharp fluctuation around the mean value. The residual component exhibits the sharpest fluctuations and captures the short-term variation of the price. All these components sum to the value of the de-trended price index (the dashed line).

Figure 7.3 De-trended Metals and Minerals Price Index and different cycles components.
Being mineral commodities, we can expect an excess of demand to be transferred to prices only if there is no idle supply capacity. In the short run, mineral supply will follow those demand fluctuations with the installed capacity limiting the effect on prices. In the long run, mining companies can also vary capacity by opening and closing mining sites without necessarily changing technology. So, it is important to understand how the volume of supply behaves to fully capture how prices may affect the innovation decision. For this purpose, we also collect information on mineral rents for each country from the World Bank Development Indicators. Given that we want to include a general measure of mineral products volume in each specification, we deflate the mineral rents with the metals and mineral price index and create a mining quantity index based on the 2010’s artificial volume.
In this chapter, we use patents as a proxy for innovation. A patent is a legal right granted for any device, substance, method or process that is new, inventive, and useful. Patents give the owner exclusive rights to commercially exploit the invention for a limited period. In return for exclusive rights, patent applications must be published and must fully disclose the claimed invention. As a result of this requirement, the body of patent literature reflects developments in science and technology. Furthermore, patent data is rich in information adjacent to technology information, such as temporal, geographic and bibliographic data. Through the extraction and analysis of data associated with patent applications, it is possible to measure aspects of invention and economic researchers have long used patent applications as a measure of inventive activity.
Chapters 2, 8 and 9 highlight the rising importance for mining enterprises to use IP instruments – particularly patents – when they pursue an internationalization strategy (see also Reference FrancisFrancis, 2015). They are often multinational companies operating in different countries and patents may help them secure their intellectual property across states and appropriate the knowledge embedded in new discoveries. Outside the mining sector, using patents as a proxy for innovation is an established practice in the literature (Reference Acs, Anselin and VargaAcs et al., 2002; Reference Griliches and GrilichesGriliches, 1998; Reference Jaffe and TrajtenbergJaffe and Trajtenberg, 1999). In doing so, we need to acknowledge all the limitations of this approach that several studies in the existing literature have extensively raised and addressed (Reference Lerner and SeruLerner and Seru, 2017). In particular, we acknowledge that the innovation captured through patents is a fraction of the wider range of innovative activity in the field.
Even if not all inventions are patented, it is largely agreed that a patent embodies an original result of an R&D activity undertaken by an entity. As a result, patent data are highly correlated with R&D expenditures in the mining sector (Figure 7.4). In addition, patents offer full coverage of both application countries and years. Therefore, they are more suitable for a global study of mining innovation as this is intended to be. The rest of the chapter uses patent data as a direct measure of innovation activity in the mining sector.

Another challenge when using patent data is the lag between this variable and R&D activities. The real lag between R&D expenditures and patents has been the subject of multiple studies (Reference Gurmu and Pérez-SebastiánGurmu and Pérez-Sebastián, 2008; Reference Hall, Griliches and HausmanHall et al., 1984). These studies find relatively contemporaneous effects between the two variables, which justifies the use of patents as a proxy for the R&D expenditures at the firm level. We follow this approach by using a minimum lag between these two.
In the rest of the chapter, the basic unit of analysis will be the patent family, the year will refer to the first filing year of the patent family and we will use the country of origin for the country. A patent family refers to all those patents applied in different jurisdictions for the same invention.Footnote 4
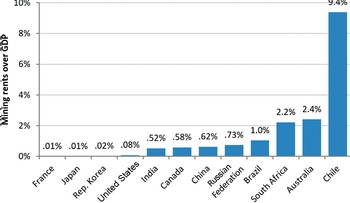
We use mineral rents as a percentage of GDP as a measure of the mining specialization in a given economy. Figure 7.5 shows the mining specialization of selected countries displaying their percentage of mining rents over GDP. Countries like Chile, Australia and South Africa have mining rents representing a large share of the GDP, which is more than nine percent for the case of Chile. These countries are considered to be more specialized in the mining sector as their income relies considerably on mining activity. On the other hand, countries like France, Japan or the Republic of Korea derive only a very minimal portion, close to zero, of their GDP from pure mining activities. By definition, countries more specialized in the mining sector have a large portion of their economy relying on these mining rents, making them more exposed to the price fluctuations of minerals and metals. Therefore, we interpret this indicator as a proxy of the country exposure to the mining industry.

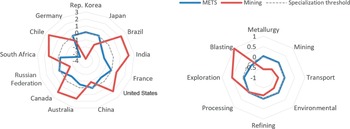
This does not mean that those countries do not play any role for the mining sector. As Figure 7.6 shows, the countries with less exposure to the mining industry are oriented more towards METS firms’ activities than mining firms’ activities.Footnote 5 On the other hand, countries that are more exposed to mining are also more specialized in mining firms’ innovation. From the same figure we can discern that innovation in the “traditional” mining fields such as exploration and blasting is more concentrated in mining firms, while METS firms develop most of the services for the sector (environment, transport and to some extent also metallurgy).

Figure 7.7 shows the evolution over time of the de-trended mining commodity price, quantity index and patents. Overall, there seems to be a strong positive correlation among these three indices. To better understand how expectations might be formed in the short and long run and what drives the observed correlation, we decompose each of these variables in the three cycles mentioned (Figure 7.8). A strong positive correlation is present for the long cycle for all three variables, although innovation seems to lag slightly. In the medium cycle, innovation seems to be correlated with price but much less than before. For the short cycle components, changes in prices seem to affect innovation in the early years of our panel but not so much in more recent ones where innovation remains relatively flat. Moreover, both innovation and quantity short cycles are in sync.

Figure 7.7 Mining price, quantity and innovation co-evolution (1960–2015).
Notes: All indicators are in logs and de-trended.

Figure 7.8 Mining price, quantity and innovation cycle decomposition (1960–2015).
Notes: All indicators are in logs and de-trended.
We test the hypotheses discussed in the previous section in two main frameworks. First, we use a time-series estimation for the global mining activity and then move to a panel estimation. To see the exact model specifications, please refer to Reference Daly, Valacchi and RaffoDaly et al. (2019a)
7.4 Results
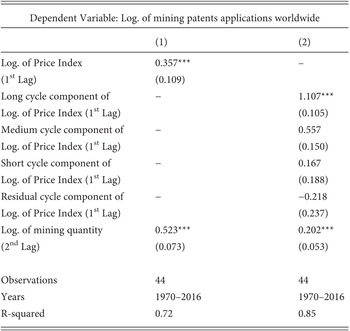
Table 7.3 reports the test for H1 (first column) and H2 and H3 (second column). It finds a positive and significant effect of both commodity prices and quantity on mining innovation, validating H1a. This implies that high commodity prices, as well as high demand for mining products, boost innovation in the sector.
Table 7.3 Time series estimation
| Dependent Variable: Log. of mining patents applications worldwide | ||
|---|---|---|
| (1) | (2) | |
| Log. of Price Index | 0.357*** | – |
| (1st Lag) | (0.109) | |
| Long cycle component of | − | 1.107*** |
| Log. of Price Index (1st Lag) | (0.105) | |
| Medium cycle component of | − | 0.557 |
| Log. of Price Index (1st Lag) | (0.150) | |
| Short cycle component of | − | 0.167 |
| Log. of Price Index (1st Lag) | (0.188) | |
| Residual cycle component of | − | −0.218 |
| Log. of Price Index (1st Lag) | (0.237) | |
| Log. of mining quantity | 0.523*** | 0.202*** |
| (2nd Lag) | (0.073) | (0.053) |
| Observations | 44 | 44 |
| Years | 1970–2016 | 1970–2016 |
| R-squared | 0.72 | 0.85 |
Notes: The model is estimated with the OLS estimator. The dependent variable is included in logarithmic terms. All variables included in the model are de-trended. A constant is included in each specification. Robust standard errors in parentheses. *, ** and *** respectively denote significance at 10%, 5% and 1% levels.
If we look more specifically at different price cycles (second column), we realize that the price effect is mainly driven by variations in the long cycle components, which confirms H2. Shorter-term components are found not to have any effect on mining innovation.Footnote 6
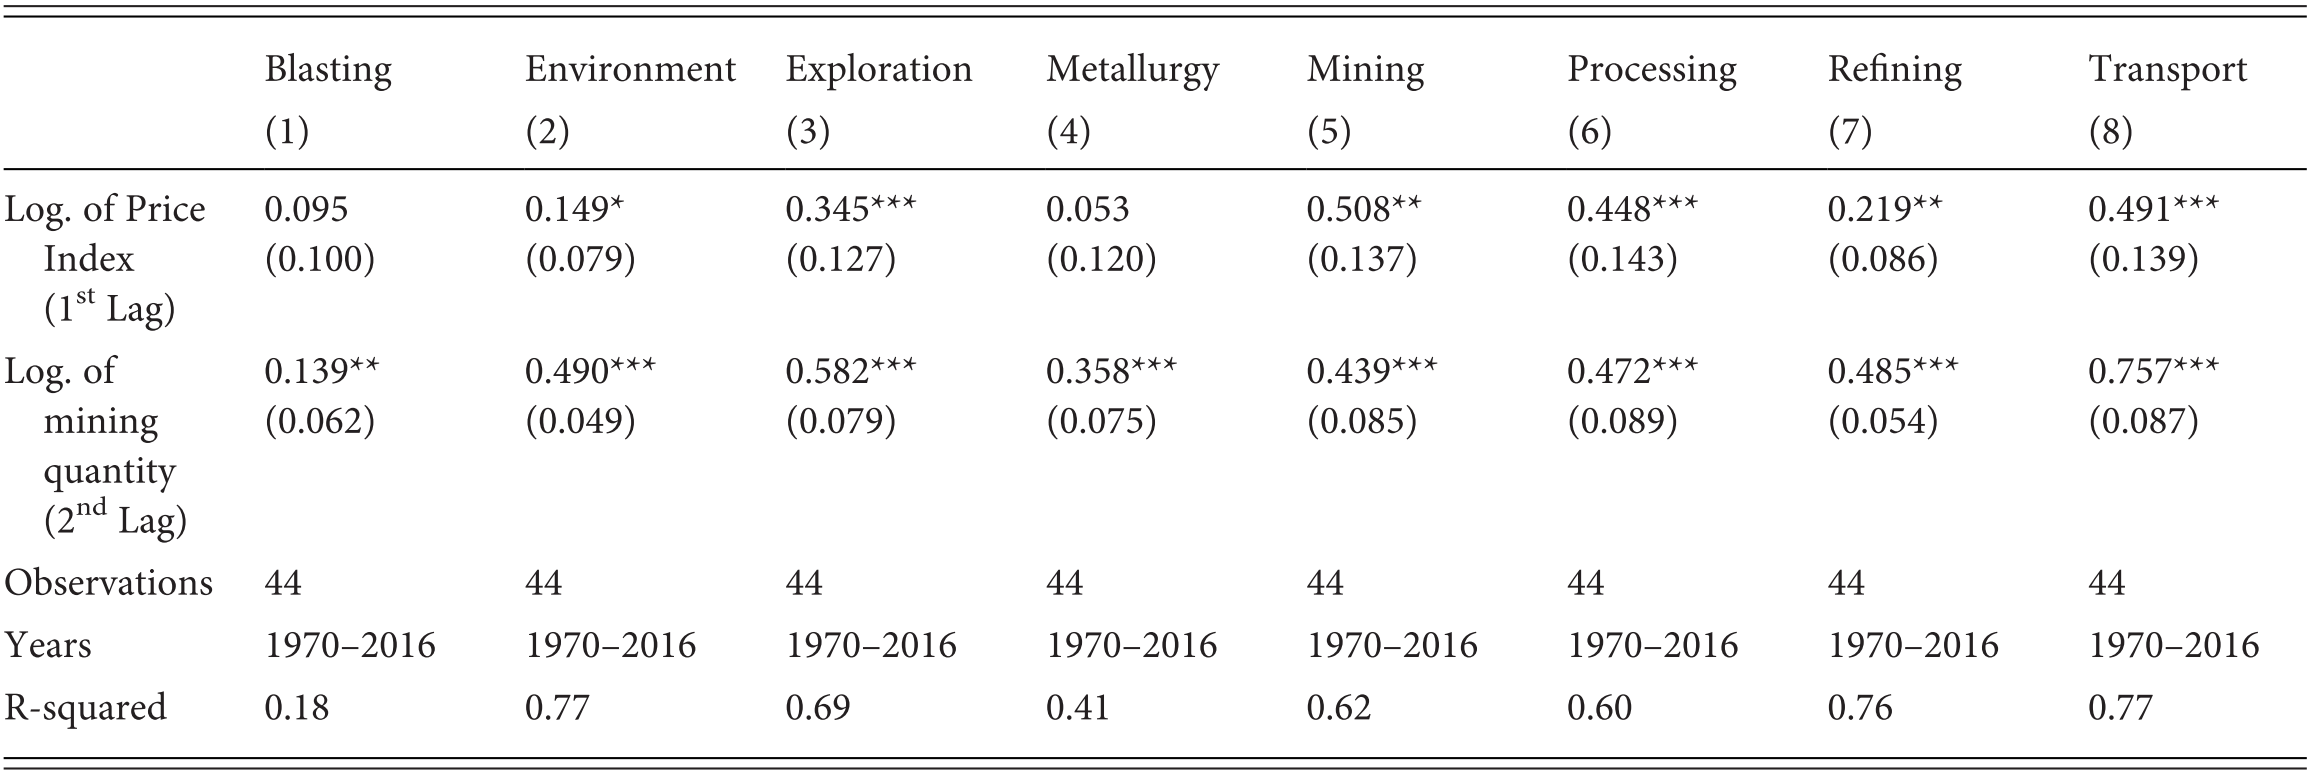
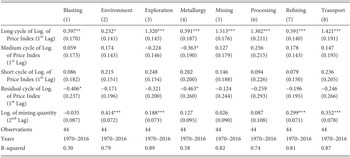
Tables 7.4 and 7.5 replicate the analysis in Table 7.3, using a mining subcategory as a dependent variable instead of the full sample of mining patents. We still find an overall pro-cyclical effect of price changes on mining innovation (see Table 7.4) as predicted by H1a. H2 is also confirmed in this subcategory scenario in Table 7.5. The effect of long cycle price shocks on mining innovation is positive and significant for almost all subcategories. Only environmental mining patents seem less responsive, suggesting that other factors may play a bigger role in explaining them, for example, environmental regulation, as is discussed in Chapter 6. We find mixed evidence for H3 as the core mining technologies, namely blasting and exploration (see Table 7.4), are among the slower and faster subcategories to react to price shocks, respectively.
| Blasting | Environment | Exploration | Metallurgy | Mining | Processing | Refining | Transport | |
|---|---|---|---|---|---|---|---|---|
| (1) | (2) | (3) | (4) | (5) | (6) | (7) | (8) | |
| Log. of Price Index (1st Lag) |
|
|
|
|
|
|
|
|
| Log. of mining quantity (2nd Lag) |
|
|
|
|
|
|
|
|
| Observations | 44 | 44 | 44 | 44 | 44 | 44 | 44 | 44 |
| Years | 1970–2016 | 1970–2016 | 1970–2016 | 1970–2016 | 1970–2016 | 1970–2016 | 1970–2016 | 1970–2016 |
| R-squared | 0.18 | 0.77 | 0.69 | 0.41 | 0.62 | 0.60 | 0.76 | 0.77 |
Notes: The model is estimated with the seemingly unrelated estimator (SUR). The dependent variable is included in logarithmic terms. All variables included in the model are de-trended. A constant is included in each specification. Robust standard errors in parentheses. *, ** and *** respectively denote significance at 10%, 5% and 1% levels.
Table 7.5 Time series estimation, different mining categories, decomposed price cycles
| Blasting | Environment | Exploration | Metallurgy | Mining | Processing | Refining | Transport | |
|---|---|---|---|---|---|---|---|---|
| (1) | (2) | (3) | (4) | (5) | (6) | (7) | (8) | |
| Long cycle of Log. of Price Index (1st Lag) |
|
|
|
|
|
|
|
|
| Medium cycle of Log. of Price Index (1st Lag) |
|
|
|
|
|
|
|
|
| Short cycle of Log. of Price Index (1st Lag) |
|
|
|
|
|
|
|
|
| Residual cycle of Log. of Price Index (1st Lag) |
|
|
|
|
|
|
|
|
| Log. of mining quantity (2nd Lag) |
|
|
|
|
|
|
|
|
| Observations | 44 | 44 | 44 | 44 | 44 | 44 | 44 | 44 |
| Years | 1970–2016 | 1970–2016 | 1970–2016 | 1970–2016 | 1970–2016 | 1970–2016 | 1970–2016 | 1970–2016 |
| R-squared | 0.30 | 0.79 | 0.89 | 0.58 | 0.82 | 0.74 | 0.81 | 0.87 |
Notes: The model is estimated with the seemingly unrelated estimator (SUR). The dependent variable is included in logarithmic terms. All variables included in the model are de-trended. A constant is included in each specification. Robust standard errors in parentheses. *, ** and *** respectively denote significance at 10%, 5% and 1% levels.
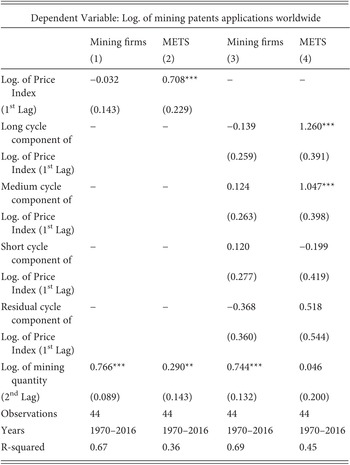
We also explore how mining and METS firms react to commodity price changes. In this exercise, our sample shrinks because we are only able to categorize firms appearing in Bureau Van Dijk’s Orbis database under specific NACE Rev.2 codes.Footnote 7 We consider their mining patents as dependent variables and we run a similar analysis to the one carried out before. In Table 7.6, we report the same set of estimations run on two different samples: only mining firms’ innovation (first and third columns) and only METS firms’ innovation (second and fourth columns). Only the innovations from METS firms seem to react to price changes, while we do not find any significant effect of prices on innovation from mining firms. This points toward the validation of H3.
Table 7.6 Time series estimation, mining vs METS firms
| Dependent Variable: Log. of mining patents applications worldwide | ||||
|---|---|---|---|---|
| Mining firms | METS | Mining firms | METS | |
| (1) | (2) | (3) | (4) | |
| Log. of Price Index | −0.032 | 0.708*** | − | − |
| (1st Lag) | (0.143) | (0.229) | ||
| Long cycle component of | − | − | −0.139 | 1.260*** |
| Log. of Price Index (1st Lag) | (0.259) | (0.391) | ||
| Medium cycle component of | − | − | 0.124 | 1.047*** |
| Log. of Price Index (1st Lag) | (0.263) | (0.398) | ||
| Short cycle component of | − | − | 0.120 | −0.199 |
| Log. of Price Index (1st Lag) | (0.277) | (0.419) | ||
| Residual cycle component of | − | − | −0.368 | 0.518 |
| Log. of Price Index (1st Lag) | (0.360) | (0.544) | ||
| Log. of mining quantity | 0.766*** | 0.290** | 0.744*** | 0.046 |
| (2nd Lag) | (0.089) | (0.143) | (0.132) | (0.200) |
| Observations | 44 | 44 | 44 | 44 |
| Years | 1970–2016 | 1970–2016 | 1970–2016 | 1970–2016 |
| R-squared | 0.67 | 0.36 | 0.69 | 0.45 |
Notes: The model is estimated with the seemingly unrelated estimator (SUR). The dependent variable is included in logarithmic terms. All variables included in the model are de-trended. A constant is included in each specification. Robust standard errors in parentheses. *, ** and *** respectively denote significance at 10%, 5% and 1% levels.
Nevertheless, this could also be explained by the high rate of technology outsourcing we observe in the mining industry. Given that most of the time mining firms prefer to acquire technology from specialized suppliers rather than producing it in-house, METS firms will be the ones absorbing the price variations and adapting their innovation accordingly. This may also explain why we do not observe any effect of price on patents in the shorter periods. Mining firms are the ones directly exposed to price variations. Therefore, it will take some time for this effect to be transferred to METS firms, which will then adapt their innovation decisions accordingly.
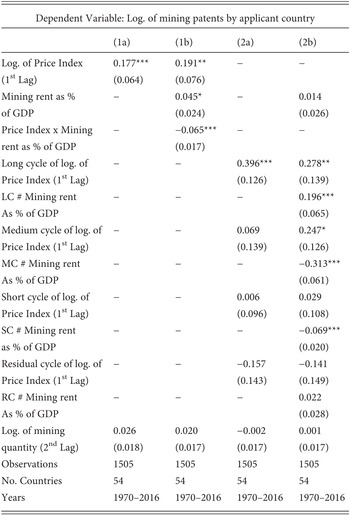
Tables 7.7 and 7.8 show the results for the panel specifications reported in the third (columns 1a and 1b) and fourth (columns 2a and 2b) equations, respectively, with the aggregate price index and with country-specific prices. The two specifications evolve quite similarly, showing that the use of a World Price Index does not distort findings compared to a country-specific one. We tried the simple regression (columns a) and we then added the country exposure to the mining sector and the interaction term between the price and the country exposure (columns 1b and 2b).
| Dependent Variable: Log. of mining patents by applicant country | ||||
|---|---|---|---|---|
| (1a) | (1b) | (2a) | (2b) | |
| Log. of Price Index | 0.177*** | 0.191** | − | − |
| (1st Lag) | (0.064) | (0.076) | ||
| Mining rent as % | − | 0.045* | − | 0.014 |
| of GDP | (0.024) | (0.026) | ||
| Price Index x Mining | − | −0.065*** | − | − |
| rent as % of GDP | (0.017) | |||
| Long cycle of log. of | − | − | 0.396*** | 0.278** |
| Price Index (1st Lag) | (0.126) | (0.139) | ||
| LC # Mining rent | − | − | − | 0.196*** |
| As % of GDP | (0.065) | |||
| Medium cycle of log. of | − | − | 0.069 | 0.247* |
| Price Index (1st Lag) | (0.139) | (0.126) | ||
| MC # Mining rent | − | − | − | −0.313*** |
| As % of GDP | (0.061) | |||
| Short cycle of log. of | − | − | 0.006 | 0.029 |
| Price Index (1st Lag) | (0.096) | (0.108) | ||
| SC # Mining rent | − | − | − | −0.069*** |
| as % of GDP | (0.020) | |||
| Residual cycle of log. of | − | − | −0.157 | −0.141 |
| Price Index (1st Lag) | (0.143) | (0.149) | ||
| RC # Mining rent | − | − | − | 0.022 |
| As % of GDP | (0.028) | |||
| Log. of mining | 0.026 | 0.020 | −0.002 | 0.001 |
| quantity (2nd Lag) | (0.018) | (0.017) | (0.017) | (0.017) |
| Observations | 1505 | 1505 | 1505 | 1505 |
| No. Countries | 54 | 54 | 54 | 54 |
| Years | 1970–2016 | 1970–2016 | 1970–2016 | 1970–2016 |
Notes: The model is estimated with the Fixed-effects estimator. The dependent variable is included in logarithmic terms. All variables included in the model are de-trended. Country fixed-effects and a constant are included in each specification. Robust standard errors in parentheses. *, ** and *** respectively denote significance at 10%, 5% and 1% levels.
Table 7.8 Panel estimation, using country-specific price index
| Dependent Variable: Log. of mining patents by applicant country | ||||
|---|---|---|---|---|
| (1a) | (1b) | (2a) | (2b) | |
| Log. of Price Index | 0.083** | 0.086** | − | − |
| (1st Lag) | (0.034) | (0.034) | ||
| Mining rent as % | − | 0.044 | − | 0.049 |
| of GDP | (0.039) | (0.047) | ||
| Price Index # Mining rent | − | −0.025 | − | − |
| as % of GDP | (0.022) | |||
| Long cycle component of | − | − | 0.318*** | 0.302** |
| log. of Price Index (1st Lag) | (0.113) | (0.121) | ||
| LC # Mining rent | − | − | − | 0.013 |
| As % of GDP | (0.033) | |||
| Medium cycle component of | − | − | 0.016 | 0.102 |
| log. of Price Index (1st Lag) | (0.055) | (0.063) | ||
| MC # Mining rent | − | − | − | −0.142** |
| As % of GDP | (0.068) | |||
| Short cycle component of | − | − | 0.018 | 0.038 |
| log. of Price Index (1st Lag) | (0.040) | (0.043) | ||
| SC # Mining rent | − | − | − | −0.041 |
| As % of GDP | (0.029) | |||
| Residual cycle component of | − | − | 0.022 | −0.016 |
| log. of Price Index (1st Lag) | (0.080) | (0.085) | ||
| RC # Mining rent | − | − | − | 0.045 |
| As % of GDP | (0.041) | |||
| Log. of mining | 0.020 | 0.012 | 0.009 | −0.001 |
| quantity (2nd Lag) | (0.019) | (0.019) | (0.020) | (0.020) |
| Observations | 1063 | 1063 | 1063 | 1063 |
| No. Countries | 39 | 39 | 39 | 39 |
| Years | 1970–2016 | 1970–2016 | 1970–2016 | 1970–2016 |
Notes: The model is estimated with the fixed-effects estimator. The dependent variable is included in logarithmic terms. All variables included in the model are de-trended. Country fixed-effects and a constant are included in each specification. Robust standard errors in parentheses. *, ** and *** respectively denote significance at 10%, 5% and 1% levels.
Mining prices maintain a positive effect on mining innovation (as predicted by H1a), mostly capturing the long cycle component. The only main difference with the time-series specification is that the mining demand loses its significance, which is probably due to the country-fixed effects. The country exposure to the mining sector (measured by mining rents as a percentage of GDP) is found to have a positive effect on innovation only for the case of the country-invariant price index (Table 7.7), although only statistically significant at 10 percent. It is found nonsignificant for the country-specific price index (Table 7.8). Therefore, more exposed countries will, on average, innovate more in mining technologies than non-mining ones. The interaction between the price effect and exposure to the mining sector is found to be negative and significant in Table 7.7, while it loses its significance in Table 7.8. This means that less-exposed countries will be the ones that react more to price changes. An explanation for this could be found in the fact that METS companies, which are among the top innovators, are not necessarily located in mining countries. They can develop their technology in their home country and then sell it to mining firms operating in other countries.
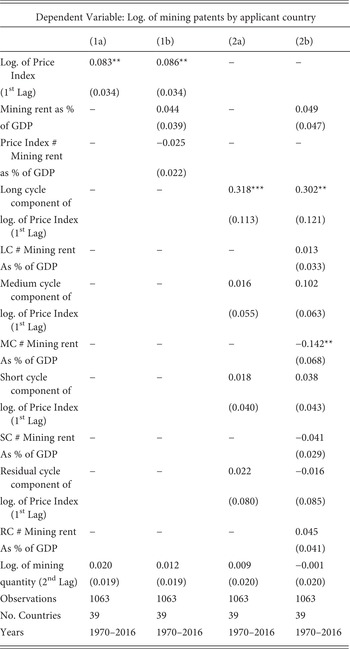
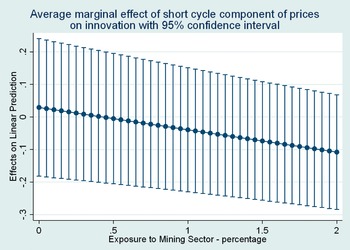
If we have a closer look at this phenomenon introducing the distinction across price cycles (second columns), we confirm what has been found before: the long cycle component of the price is found to positively influence the innovation rate, again confirming H2. In addition, through the introduction of the interaction term, we find that mining countries react more to price changes in the long cycles (see Figure 7.9: the higher the exposure of a country to the mining sector, the bigger will be the reaction of innovation to price changes), while non-mining ones react more in the medium and short term (see Figures 7.10 and 7.11: the lower the exposure of a country to the mining sector the bigger will be the reaction of its innovation to price changes; for countries which are very exposed to the mining activity, an increase in commodity price in the medium and short term will have countercyclical effects on innovation). Mining countries are slower to absorb the price effect, compared to METS countries, which mostly affects them in the long run. This confirms our idea that mining firms are, on average, less flexible than METS firms in adapting to price changes. Therefore, there is a need for highly dependent mining countries to implement countercyclical policies able to defeat the negative effects of commodities down cycles, as anticipated in hypothesis H4. The fact that these countries rely extensively on mining rents makes them particularly vulnerable to commodity price depression, jeopardizing their ability to remain competitive in the market. This condition affects METS countries that rely only marginally on mining activity less. Their diversification becomes a strong attribute in periods of low prices.

Figure 7.9 Average marginal effect of long cycle component of price index on innovation with 95% confidence intervals.

Figure 7.10 Average marginal effect of medium cycle component of price index on innovation with 95% confidence intervals.

7.5 Concluding remarks
In this chapter, we studied the relationship between economic cycles and innovation in the mining sector. In particular, we explored how the business cycle of this sector is tied in with mining commodity price fluctuation. In doing so, we focused on the impact of mineral and metal price changes on the sector’s innovation.
We discussed the transmission mechanisms based on the adaptation of the existing literature on the cyclicality of innovation to the singularities of the mining sector. We hypothesized a pro-cyclical impact if the transmission is based on higher prices generating higher direct or indirect disposable income that is, in turn, invested in innovation; and, a countercyclical impact if lower prices increase the pressure to reduce cost and increase efficiency through new technologies. We also conjectured that price variation is more likely to affect innovation if perceived as long-lasting shocks, if innovators are more technologically diversified and if countries are more specialized in mining.
To test these hypotheses, we relied on novel mining innovation data for the period 1970–2015, based on patent information and a series of economic indicators related to the mining sector based on data from the World Bank. We conducted the econometric analyses using both time series and panel data. Our main contribution was to disentangle the effects of price cycles of different lengths, namely long-term, medium-term, short-term and residual. To identify them, we used the Christian and Fitzgerald’s band-pass filter and isolated four components of the price.
Our setting attempted to circumvent several identification issues. We accounted for the time lag between changes in demand, commodity prices and innovation. To establish the optimal lag between these variables, we ran a series of correlation tests. We identified the price cycles using the Christian and Fitzgerald band-pass filter, as in Reference Cuddington and JerrettCuddington and Jerret (2008).
Overall, we found that mining innovation is pro-cyclical, increasing in periods of commodity price boom and slowing down during recessions. We found little evidence of countercyclical innovation. It is worth noting that these two mechanisms may coexist. Hence, a stronger pro-cyclical effect may be hiding a weaker countercyclical one. Our model cannot resolve this question, but it does indicate that if a countercyclical effect exists, it is weaker than the pro-cyclical one in most of our estimations.
We found consistent empirical evidence on long price cycles affecting mining innovation more than shorter ones. Indeed, most of the pro-cyclical effect is related to the long cycle component of the price variation. This is coherent with the long decision-making timeline associated with the mining sector, where the bulk of the technological changes happen when mines are opened or closed.
We also found evidence that the transmission of the pro-cyclical effect happens indirectly through METS firms. When comparing mining and METS firms, we found that only METS firms were responsive to adapting their innovation to price changes. Moreover, the estimations indicate that METS are more responsive and faster to adapt their innovation to price changes than the industry average.
According to our estimations, economies specializing in mining produce more mining innovation, but they are also less reactive to price changes. Nevertheless, this behavior varies substantially across the length of price cycles. More specialized economies react even more pro-cyclically to changes of the long cycle component of price than more diversified ones. Conversely, highly specialized economies may observe countercyclical responses to medium and short cycle components, while diversified economies may observe pro-cyclical responses also for the medium cycle component.
These results indicate that mining-dependent economies put countercyclical measures in place based on innovation to cope with shorter-term downturns of the business cycle. It also means that, in the upturn, they are less reactive than more diversified economies. The latter are likely to have more technologically diversified innovation systems composed by innovative METS firms able to adapt new technologies to the mining sector.


 Open access