

Income and class biases in political representation have attracted the attention of many political scientists in recent years. More than any other scholarly work, Martin Gilens’ (Reference Gilens2012) study of unequal policy responsiveness in the United States has stimulated research and debate on this topic. Sorting survey respondents by relative income and estimating the probability of policy change based on some 1,800 survey items asking about support for specific reform proposals, Gilens finds that the preferences of high-income citizens predict policy change, but the preferences of low-income and even middle-income citizens have no influence on policy outcomes when they diverge significantly from the preferences of high-income citizens. These findings have sparked lively debates among scholars working on American politics. One debate focuses on the frequency and extent of divergence in preferences between income groups.Footnote 1 Simply put, do low- and middle-income citizens lose out to affluent citizens all the time or only occasionally? And, perhaps more importantly, do they lose out on issues that truly matter to them or (mostly) on issues that are not so salient? A second debate concerns the causal mechanisms behind the income biases in policy responsiveness identified by Gilens and other scholars (e.g., Bartels Reference Bartels2016, Ellis Reference Ellis2017, Hayes Reference Hayes2013, and Rigby and Wright Reference Rigby, Wright, Enns and Wlezien2011, Reference Rigby and Wright2013).
This chapter seeks to contribute to the debate about the reasons for unequal responsiveness by bringing data from European countries to bear and, in particular, by exploring whether policymaking under Left-leaning governments is less biased than policymaking under Right-leaning governments. Less directly, our empirical analysis also speaks to the debate about the meaning of unequal representation by exploring policy responsiveness and partisan conditioning of policy responsiveness across different policy domains.
It is tempting to suppose that the income biases identified by Gilens and others represent a uniquely American phenomenon. Indeed, many explanations for unequal responsiveness advanced by students of American politics imply that we should observe much more equal policy responsiveness in countries with lower income inequality, stronger unions, lower income inequality in voter turnout, and less costly, publicly subsidized election campaigns. However, recent studies replicating Gilens’ research design find that policy responsiveness is also biased in favor of affluent citizens in Germany (Elsässer, Hense, and Schäfer Reference Elsässer, Hense and Schäfer2021), the Netherlands (Schakel Reference Schakel2021), Norway (Mathisen Reference Mathisen2023), and Sweden (Persson Reference Persson2023). In what follows, we summarize the main findings of these studies and reanalyze the data on which they are based.Footnote 2 While the original studies largely focused on overall differences in political influence between low-income and high-income citizens, our reanalysis focuses on differences between middle-income and high-income citizens and the conditioning effects of government partisanship. By focusing on responsiveness to the preferences of high-income citizens relative to middle-income citizens, we respond to a common critique of the literature on unequal responsiveness, viz., that it shows that the affluent are better represented than the poor – a finding that is arguably unsurprising and entirely consistent with the median voter theorem (cf. Elkjær and Klitgaard Reference Elkjær and Klitgaard2021).
Gilens (Reference Gilens2012: Ch. 7) finds that responsiveness is equally skewed in favor of affluent citizens regardless of whether Democrats or Republicans control Congress and the White House, but most studies of unequal responsiveness in the United States support the intuitive hypothesis that the Democrats represent low- and middle-income citizens better than Republicans (Becher, Stegmueller, and Käppner Reference Becher, Stegmueller and Kaeppner2018; Ellis Reference Ellis2017; Lax, Phillips, and Zelizer Reference Lax, Phillips and Zelizer2019; Rhodes and Schaffner Reference Rhodes and Schaffner2017). In comparative politics, there is a large literature examining the effects of government party affiliation on social spending, welfare-state generosity, redistribution, and other policy outcomes on which citizens’ preferences are polarized by income.Footnote 3 Much of this literature follows Garrett (Reference Garrett1998) in positing that governing Left and Right parties alike seek to maximize their reelection chances by boosting macroeconomic performance and also cater to the policy preferences of their core constituencies, with core constituencies of Left parties identified as risk-exposed wage-earners with relatively low earnings and the core constituencies of Right parties identified as occupational strata characterized by lower exposure to labor market risks and higher earnings.
This stylized differentiation of Left and Right parties and their core constituencies would lead us to expect that Left-leaning governments are more responsive to the policy preferences of low- and middle-income citizens, and less responsive to the preferences of high-income citizens than Right-leaning governments. However, more recent literature (e.g., Manwaring and Holloway Reference Manwaring and Holloway2022; Mudge Reference Mudge2018) suggests that the mainstream Left – Social Democratic (and Labour) parties – have undergone a profound transformation since the 1980s, moving toward the center and adopting policy priorities associated with the notion of a “Third Way.” Key features of this trend have been a move away from redistributive tax and spending policies and a focus on social investment, a policy shift apparently designed to appeal to new middle strata and, in particular, “socio-cultural professionals” (Gingrich and Häusermann Reference Gingrich and Häusermann2015). Against this background, we first analyze whether Left-leaning governments mitigate income biases in policy responsiveness across all issues included in our datasets. We then focus on economic and social policies with direct distributive implications and, finally, explore temporal change in the effects of government partisanship on unequal responsiveness in this policy domain.
To anticipate, our results confirm that government policies in the four countries that we analyze are more responsive to the preferences of high-income citizens than to the preferences of middle- and low-income citizens. We find that unequal responsiveness is less pronounced under Left-leaning governments in Germany, the Netherlands, and Sweden, but there is still bias in favor of the high-income citizens even under Left-leaning governments, at least in Germany and the Netherlands. The Norwegian case is a puzzling exception in that Left-leaning governments seem to favor the affluent more than Right-leaning governments. However, this inversion of partisan conditioning disappears when we restrict our analysis to economic and welfare issues. More tentatively, we also find some support for the proposition that partisan conditioning of unequal responsiveness on distributive issues has indeed diminished over time.
In what follows, we proceed directly to empirics, leaving theoretical issues for later discussion. The first section presents the data we analyze and addresses methodological issues. The second section looks at patterns of unequal responsiveness across our four countries and presents the results of estimating different regression models with support for policy change at the 10th, 50th, and 90th income percentiles as predictors of policy adoption. In the third section, we introduce government partisanship as a variable that conditions policy responsiveness to the preferences of different income groups. In the fourth section, we restrict the analysis to economic and welfare issues and, in the fifth section, we explore changes in partisan conditioning over time. The final section summarizes our empirical findings and discusses their implications for the debate on mechanisms behind income bias in political representation.
Data and Methodology
For each of the four countries included in our analyses, authors of this paper created original datasets that matched public opinion with policy outcomes. In so doing, we followed the approach set out by Gilens (Reference Gilens2012). To begin with, we identified questions in preexisting public opinion surveys that asked respondents to indicate whether they supported specific proposals for policy change. The selection of survey items was restricted to items that asked about policy changes that could be implemented at the national level and were worded in such a way that it was possible to determine whether the proposed change was implemented subsequent to the survey. For Sweden and Norway, the original datasets included questions about constitutional changes, but we have removed these questions from the analyses presented here. Note also that some questions in the original datasets and the merged dataset are phrased in terms of support for status-quo policy and that responses to such questions have been inverted to capture support for changing policy in a particular direction.Footnote 4
The merged dataset contains nearly 2,000 observations (survey items), covering a wide range of issues, from raising the retirement age and cutting taxes to immigration reform, construction of nuclear power plants, and the introduction of same-sex marriage. As shown in Table 2.1, the items are unevenly distributed across countries and over time. In the pooled analyses presented later, we ensure that each country carries the same weight by weighting individual survey items by the inverse of the total number of items for each country. (The weights are adjusted when we analyze subsets of survey items.)
Table 2.1 Survey items by country
| Country | N | Years | Sources |
|---|---|---|---|
| Germany | 266 | 1998–2016 | Commercial |
| Netherlands | 291 | 1979–2012 | Mostly public |
| Norway | 557 | 1966–2014 | Mostly commercial |
| Sweden | 844 | 1960–2012 | Public |
The research projects on which we draw then harmonized the income of survey respondents in the manner proposed by Gilens (Reference Gilens2012: 61–62), using percentile midpoints to generate estimates of the share of respondents at the 10th, 50th, and 90th percentiles who support policy change (henceforth P10, P50, and P90). An obvious and important limitation, to which we shall return, is that we do not have any information about the salience of proposed policy changes for respondents.
The dependent variable in our regression models is a dummy variable that takes the value of one if the policy change in question was enacted within a given time period after the survey and otherwise the value of zero. Like Gilens, we estimate the probability of a policy change in the direction preferred by respondents at different positions in the income distribution and do not take into account how much policy changed. For example, we treat all increases or decreases in unemployment benefits as equivalent, irrespective of their magnitude (unless the magnitude was specified in the survey question).
Using information from legislative records, government budgets, and newspaper articles, we coded survey items as adopted or not adopted within two and four years of the survey in which they appeared. The main results presented here are based on two-year windows for adoption, with results based on four-year windows (Gilens’ default) presented in the online appendix (Tables 2.A2 and 2.A8–9). We prefer two-year windows because they provide a more precise measure of government partisanship, but the results for four-year windows turn out to be very similar.Footnote 5
Our preferred measure of government partisanship is the combined share of cabinet portfolios held by left-wing parties (Social Democratic and Green parties), as reported on an annual basis by Armingeon, Engler, Leemann, and Weisstanner (Reference Armingeon, Engler, Leemann and Weisstanner2023). For each survey item, we calculate the average share of cabinet portfolios held by left-wing parties in the year of the survey and in the two or four subsequent years. As reported in the online appendix (Table 2.A11), we obtain substantively equivalent results if we instead measure government partisanship with a dummy for the office of prime minister being held by a Social Democrat and restrict the analysis to survey items with two-year windows in which there was no change of prime minister.
Table 2.2 reports average values for our partisanship variable as well as support for policy change at P10, P50, and P90 and the frequency of policy change by country. For now, suffice it to note that, over the time period(s) covered by our analyses, Left parties have participated in government more frequently and more extensively in Norway and Sweden than in Germany and, especially, the Netherlands.
Table 2.2 Average values of independent and dependent variables by country
| Germany | Netherlands | Norway | Sweden | |
|---|---|---|---|---|
| Policy change (two years) | 0.57 (0.50) | 0.20 (0.40) | 0.21 (0.41) | 0.13 (0.34) |
| P10 support | 0.55 (0.22) | 0.48 (0.22) | 0.48 (0.23) | 0.55 (0.21) |
| P50 support | 0.56 (0.21) | 0.48 (0.22) | 0.47 (0.23) | 0.53 (0.22) |
| P90 support | 0.57 (0.19) | 0.48 (0.21) | 0.46 (0.23) | 0.48 (0.21) |
| P90–P10 support | 0.02 (0.15) | −0.01 (0.15) | −0.02 (0.12) | −0.07 (0.13) |
| P90–P50 support | 0.01 (0.10) | −0.00 (0.11) | −0.01 (0.09) | −0.05 (0.12) |
| P50–P10 support | 0.01 (0.08) | 0.00 (0.08) | −0.01 (0.07) | −0.02 (0.07) |
| Left cabinet share | 0.45 (0.36) | 0.26 (0.14) | 0.57 (0.32) | 0.59 (0.43) |
Note: Standard deviations in parentheses.
We explore how government partisanship affects responsiveness to lowincome, middle-income, and high-income citizens by interacting our measure of government party affiliation with measures of P10, P50, and P90 support for policy change. To avoid the complications associated with interpreting interaction effects estimated with logistic regression models (e.g., Gomila Reference Gomila2021), we present results based on estimating linear probability models, with heteroskedasticity-consistent standard errors, throughout the paper.Footnote 6
It is important to keep in mind that the public opinion data that form the basis for our analyses refer to policy changes that were discussed in a particular country at a particular point in time. The issues captured by our data and the overall balance across policy areas differ within countries over time as well as between countries. A further complication has to do with the sources of the survey data. As indicated in Table 2.1, the German dataset relies exclusively on commercial surveys, while the Swedish dataset relies exclusively on publicly funded surveys designed by academic researchers and the Dutch and Norwegian datasets combine both types of surveys. According to our data, policy change is much more common in Germany than in Sweden (see Table 2.2), but this may well be because the survey sources are different in the two countries, commercial surveys being more likely to ask about policy changes currently being discussed by policymakers. Based on these data, we cannot say with any certainty that status-quo bias is stronger in Sweden than in Germany. More generally, cross-national differences in policy responsiveness must be interpreted with caution. However, our primary interest pertains to patterns of unequal responsiveness within countries – how government partisanship conditions responsiveness to P10, P50, and P90 – and, for this purpose, cross-country differences in the questions asked in surveys would seem to be less relevant. Moreover, cross-national and temporal variation in survey items becomes less of a concern when we focus on economic and welfare policies. The issues pertaining to this policy domain are quite similar across our four cases and have not changed so much since the 1980s.
Unequal Policy Responsiveness
We begin our empirical analysis by looking at overall policy responsiveness to the preferences of P10, P50, and P90 in our four countries. In so doing, we replicate the results of the underlying country studies and establish the baseline for our subsequent analysis of how government partisanship conditions income biases in policy responsiveness. As indicated at the outset, we focus more explicitly on the political representation of middle-income citizens relative to high-income citizens than in our previous work.
Figure 2.1 shows the bivariate coefficients that we obtain when we regress policy adoption within a two-year window on our measures of support for policy changes at P10, P50, and P90 in separate models. For comparison, we include equivalent estimates based on Gilens’ data for the United States.Footnote 7 We also show the results that we obtain when we pool data for the four European countries. (Confidence intervals in this and all subsequent figures are displayed at the 95 percent level.)

Figure 2.1 Coefficients for support by income on the probability of policy change (bivariate linear probability models with two-year windows)
Note: See Table 2.A1 in the online appendix for full regression results.
While overall responsiveness to public opinion varies across countries, unequal responsiveness appears to be a common feature of liberal democracies. In Germany, the Netherlands, and Sweden, the likelihood of policy change increases significantly with P90 support for policy change, but this is not the case for P50 support, let alone P10 support. The coefficients for P50 and P10 support almost clear the 95 percent significance threshold for the Netherlands, but they are indistinguishable from zero for Germany and Sweden. Among the four European countries, Norway stands out as the only country where support for policy change at any point in the income distribution increases the likelihood of adopting policy changes, though the effect becomes stronger as we move up the income ladder. In this respect, Norway resembles the United States. As measured here, income biases in unequal responsiveness are more pronounced in Germany, the Netherlands, and Sweden than in the United States. Pooling our European data, the size of the coefficient for P50 preferences is about half the size of the coefficient for P90 preferences and the size of the coefficient for P10 preferences is about one quarter of the size of the coefficient for P90 preferences.
As commonly noted in the literature on this topic, the policy preferences of low-, middle-, and high-income citizens are correlated, and this renders the results presented in Figure 2.1 dubious. The effect of support for policy change among low- and middle-income citizens that we observe in the Norwegian and United States data may actually be the effect of support for policy change among high-income citizens (or vice versa). To get around this problem, Table 2.3 shows the average marginal effects we obtain when we replicate the pooled model shown in Figure 2.1 with two subsets of our data: first, a subset consisting of proposed policy changes on which P10 and P90 support diverges by at least 10 percentage points and, secondly, a subset consisting of proposed changes on which P50 and P90 support diverges by at least 10 points. Averaging across our four European countries, we find no responsiveness at all to the preferences of P10 or P50 when the analysis is restricted to survey items on which they clearly disagree with P90.
Table 2.3 Average marginal effects of support for policy change when preferences diverge by at least 10 percentage points (two-year windows)
| P10 vs. P90 | P50 vs. P90 | |||
|---|---|---|---|---|
| P10 | P90 | P50 | P90 | |
| Support for policy | −0.061 | 0.563** | −0.090 | 0.539** |
| Change | (0.083) | (0.083) | (0.110) | (0.114) |
| Country dummies | Yes | Yes | Yes | Yes |
| Constant | 0.604** | 0.261** | 0.605** | 0.259** |
| (0.058) | (0.062) | (0.078) | (0.084) | |
| N | 959 | 959 | 740 | 740 |
| Adjusted R2 | 0.168 | 0.217 | 0.144 | 0.182 |
Note: +p < 0.1, p < 0.05, **p < 0.01.
As noted by Bartels in this volume, analyses of subsets of data like those presented in Table 2.3 reduce the correlation between group preferences, but are still limited in that they include only one group at a time. The statistical relationships uncovered in these models might well be spurious. One way of considering multiple income groups’ preferences simultaneously is simply to include them in the same multivariate models. We report results from such models in Table 2.A3 in the online appendix. When P10 or P50 is paired with P90, the coefficient for the lower income group is negative and statistically significant. When P10 is paired with P50 and when all three groups are included, the coefficient for P10 is again negative and statistically significant.
Low-income citizens appear to be “perversely represented” in the sense that their support for policy change reduces the probability of policy change. As suggested by Gilens (Reference Gilens2012: 253–258), it seems very likely that this effect is a statistical artifact, due to the inclusion of predictors with correlated measurement error (see also Achen Reference Achen1985). Following Schakel, Burgoon, and Hakhverdian (Reference Schakel, Burgoon and Hakverdian2020), we address this problem by estimating models that regress policy adoption on the difference in support for policy change between two positions in the income distribution, while controlling for support for policy change at the median income. We go beyond Schakel, Burgoon, and Hakhverdian (Reference Schakel, Burgoon and Hakverdian2020) by estimating such models not only for the gap between P90 and P10 support for policy change, but also for the gap between P90 and P50 support for policy change and the gap between P50 and P10 support for policy change. The average marginal effects that we obtain by estimating such models provide a measure of the responsiveness to the preferences of one income group relative to another income group. While Table 2.4 reports on marginal effects, Figure 2.2 displays the predicted probabilities of observing a policy change for different values of the preference gap between P90 and P10 (left panel) and the preference gap between P90 and P50 (right panel) for each country individually and for the four countries combined. (To make the figure clearer, we show only the 95 percent confidence interval for the pooled results.)
Table 2.4 Average marginal effects of preference gaps on policy adoption, controlling for P50 support (two-year windows)
| Pooled | Germany | Netherlands | Norway | Sweden | |
|---|---|---|---|---|---|
| P90–P10 support | 0.666** | 0.954** | 0.653** | 0.492** | 0.432** |
| P90–P50 support | 0.910** | 1.529** | 1.133** | 0.691** | 0.432** |
| P50–P10 support | 0.676** | 1.422** | 0.357 | 0.477* | 0.356* |
Notes:+ < 0.1, * p < 0.05, **p < 0.01, see Tables 2.A4–6 in the online appendix for full regression results.

Figure 2.2 Predicted probabilities of policy change at different preference gaps between P90 and P10 or P50 (two-year windows)
To clarify, the preference-gap variables shown in Table 2.4 and Figure 2.2 take on higher values when P90 is more in favor of a policy change than P50 or P10. A positive effect of this variable indicates a bias in favor of the affluent, as policy change becomes more likely when high-income citizens are more supportive of policy change relative to low- or middle-income citizens. An obvious complication is that the middle of the scale includes any scenario in which preferences are the same at different positions in the income distribution, regardless of whether the two income groups favor or oppose policy change. This complication is at least partially resolved by controlling for the level of P50 support for policy change.Footnote 8
For all four countries, Table 2.4 and Figure 2.2 indicate that policymaking is more responsive to the preferences of high-income citizens than to the preferences of middle-income citizens and, less surprisingly, to the preferences of low-income citizens. The bias in favor of the high-income citizens relative to the middle is only slightly less pronounced than the bias in favor of the high-income citizens relative to low-income citizens in the Swedish case and it is more pronounced than the bias in favor of high-income citizens relative to low-income citizens in the Dutch case. In Germany and Norway, these two biases are essentially the same. While we observe a significant bias in favor of middle-income citizens relative to low-income citizens in Germany, this bias is quite small in Norway and Sweden and non-existent in the Netherlands. Overall, the basic patterns are strikingly similar across the four countries, despite cross-country differences in the samples of survey items on which these results are based.
Finally, Figure 2.3 summarizes the results that we obtain when we try to capture different “coalition scenarios” with the pooled dataset, again following Gilens (Reference Gilens2012: 83–85). The two panels in this figure are based on estimating separately the average marginal effects of P90, P50, and P10 support for policy changes (i.e., bivariate models) for two different subsets of survey items. The results in the left-hand panel are based on the subset of survey items where P90 and P50 support differs by less than 8 percentage points and P10 support differs by more than 10 percentage points from that of the other income groups. Conversely, the right-hand panel is based on a subset of survey items where P50 and P10 support differs by less than 8 points and P90 support differs by more than 10 points. The alternative theoretical accounts of redistributive politics proposed by Iversen and Soskice (Reference Iversen and Soskice2006) and Lupu and Pontusson (Reference Lupu and Pontusson2011) both suggest that P50 and P10 preferences will prevail over P90 preferences when they are closely aligned. While P50 preferences seem to be well represented when they are asymmetrically aligned with P90 preferences, P50 preferences do not seem to affect the likelihood of policy change when they are instead asymmetrically aligned with P10 preferences. We hasten to add that this analysis is based on rather small samples and that the results shown in Figure 2.3 are sensitive to the thresholds that we use to identify different coalition scenarios.Footnote 9
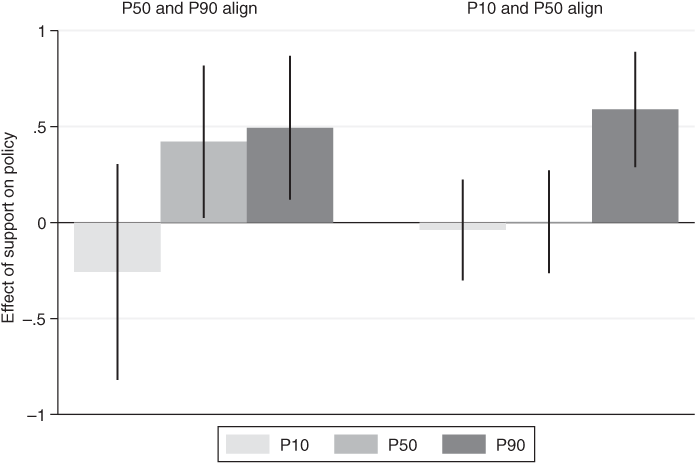
Figure 2.3 Policy responsiveness when the preferences of two groups align and the third group diverges (two-year windows)
Notes: See Table 2.A7 in the online appendix for full results. N = 115 for the left-hand panel, N = 426 for the right-hand panel.
Partisan Conditioning of Policy Responsiveness by Income
We now turn to the question of how government partisanship affects policy responsiveness. We address this question by adding measures of government partisanship to models that identify the effects of preference gaps between income groups while controlling for P50 support for policy change and interacting preference gaps with government partisanship. A negative interaction effect indicates that the pro-affluent bias in policy responsiveness becomes smaller as the presence of Left parties in government increases.Footnote 10 As we have seen (Table 2.4), preference gaps between P90 and P50 or P10 are consistently better predictors of policy adoption than preference gaps between P50 and P10 and the effects of the P90–P50 gap are quite similar to the effects of the P90–P10 gap. In light of these findings, and the pivotal role that most theories of democratic politics assign to middle-income citizens, we focus on partisan conditioning of the effects of preference gaps that involve the affluent and, especially, the gap between the preferences of high-income and middle-income citizens. In other words, the question we ask is the following: do Left (or Left-leaning) governments cater less to the high-income citizens relative to low- and middle-income citizens than non-Left (Right-leaning) governments?
Reported in Tables 2.5 and 2.6, our main results are based on measuring government partisanship as the average share of cabinet portfolios held by Social Democratic and Green parties in the year that a particular survey item was fielded and the two subsequent years.Footnote 11 As noted at the outset, Norway stands out as an exceptional case in Tables 2.5 and 2.6. In the other three countries, the effect of P90 being more supportive of policy change than P10 and P50 is positive and significant when the interaction term equals zero (indicating an absence of Left parties in government) and the coefficient of the interaction term itself is negative. It is important to note here that our Swedish sample of survey items is nearly three times as large as our German and Dutch samples, explaining why coefficients of similar magnitude for Sweden clear statistical significance thresholds while the German coefficients do not. When we pool the three countries, the coefficients for the interaction terms clear the 95 percent threshold. According to these results, pro-affluent bias in policy responsiveness is significantly less pronounced when Left parties are in power in Germany, the Netherlands, and Sweden. In Norway, by contrast, the interaction terms are positive (and significant with 95 percent confidence), suggesting that pro-affluent bias in policy responsiveness only occurs when Left parties are in power.
Table 2.5 Linear probability models interacting the P90−P10 preference gap with Left government (two-year windows)
| Pooled | Pooled (w/o NO) | Germany | Netherlands | Sweden | Norway | |
|---|---|---|---|---|---|---|
| P90−P10 gap | 0.791** | 0.898** | 1.235** | 1.058** | 0.742** | −0.125 |
| (0.122) | (0.134) | (0.297) | (0.317) | (0.138) | (0.303) | |
| Left government | −0.025 | −0.041 | −0.049 | −0.079 | −0.065+ | 0.024 |
| (0.031) | (0.038) | (0.094) | (0.165) | (0.034) | (0.052) | |
| P90−P10 × Left | −0.253 | −0.441* | −0.483 | −1.547 | −0.547** | 1.015* |
| government | (0.190) | (0.214) | (0.509) | (1.047) | (0.186) | (0.449) |
| P50 support | 0.220** | 0.170** | 0.223 | 0.284** | 0.026 | 0.353** |
| (0.049) | (0.062) | (0.156) | (0.108) | (0.049) | (0.071) | |
| Country dummies | Yes | Yes | No | No | No | No |
| Constant | 0.445** | 0.484** | 0.451** | 0.097 | 0.185** | 0.037 |
| (0.043) | (0.050) | (0.101) | (0.074) | (0.038) | (0.042) | |
| N | 1958 | 1401 | 266 | 291 | 844 | 557 |
| Adjusted R2 | 0.190 | 0.222 | 0.071 | 0.061 | 0.034 | 0.063 |
Notes: +p < 0.1, *p < 0.05, **p < 0.01.
Table 2.6 Linear probability models interacting the P90−P50 preference gap with Left government (two-year windows)
| Pooled | Pooled (w/o NO) | Germany | Netherlands | Sweden | Norway | |
|---|---|---|---|---|---|---|
| P90−P50 gap | 1.160** | 1.316** | 2.058** | 1.500** | 0.937** | −0.225 |
| (0.157) | (0.173) | (0.530) | (0.419) | (0.170) | (0.409) | |
| Left government | −0.024 | −0.040 | −0.024 | −0.141 | −0.069* | 0.025 |
| (0.032) | (0.038) | (0.090) | (0.165) | (0.032) | (0.052) | |
| P90−P50 × Left | −0.510* | −0.800** | −0.951 | −1.332 | −0.859** | 1.648* |
| government | (0.231) | (0.250) | (0.837) | (1.462) | (0.211) | (0.651) |
| P50 | 0.299** | 0.257** | 0.364* | 0.406** | 0.063 | 0.399** |
| (0.050) | (0.065) | (0.166) | (0.114) | (0.051) | (0.070) | |
| Country dummies | Yes | Yes | No | No | No | No |
| Constant | 0.406** | 0.440** | 0.366** | 0.054 | 0.163** | 0.013 |
| (0.044) | (0.051) | (0.105) | (0.074) | (0.036) | (0.041) | |
| N | 1958 | 1401 | 266 | 291 | 844 | 557 |
| Adjusted R2 | 0.190 | 0.224 | 0.067 | 0.087 | 0.038 | 0.066 |
Notes: *+p < 0.1, * p < 0.05, **p < 0.01.
Based on the results in Table 2.6, Figure 2.4 displays predicted probabilities of policy adoption at different values of the P90–P50 gap under two partisan scenarios: no Left parties in government (left-hand panel) and Left parties holding all cabinet seats (right-hand panel).Footnote 12 The Norwegian case again stands out as exceptional in this figure. Importantly, Figure 2.4 also illustrates that the Left government diminishes but does not eliminate pro-affluent bias in Germany and the Netherlands. Sweden appears to be the only case in which policy is equally responsive to high-income and middle-income citizens when Left parties control the government.

Figure 2.4 Predicted probabilities of policy change conditional on the P90−P50 preference gap and government partisanship (two-year windows)
Government Partisanship and Redistributive Policy Responsiveness by Income
The Norwegian puzzle invites further discussion of how party politics is related to income biases in political responsiveness. As noted in the introduction, our theoretical expectations regarding the impact of government partisanship apply most clearly to issues involving economic and social policies with direct distributive implications. It is much less evident that citizens’ preferences are polarized by income on the many and varied “noneconomic” (or “nonmaterial”) issues that divide Left and Right parties and, if there is polarization by income, it may well be the inverse of the polarization that we observe with issues pertaining to economic policy (in particular, fighting unemployment, taxation, and social spending). Indeed, an extensive literature on new cleavages in electoral politics argues that mainstream Left parties have sought to offset the decline of the traditional working class by aligning their programs with the preferences of “new middle strata” – relatively affluent and primarily urban voters – on environmental issues as well as immigration and a host of cultural issues encompassed by the notion of “cosmopolitanism” while seeking to retain the support of low-income voters by maintaining their commitment to redistribution of income (e.g., Gingrich and Häusermann Reference Gingrich and Häusermann2015; Kitschelt Reference Kitschelt1994; Kriesi et al. Reference Kriesi, Grande, Lachat, Dolezal, Bornschier and Frey2006). This general characterization holds for Dutch, German, and Swedish Social Democrats as well as Norwegian Social Democrats, but one might plausibly assume that the urban–rural divide is a more prominent feature of Norwegian politics – perhaps a more prominent feature of Norwegian income inequality as well – and that this has rendered the Norwegian Social Democrats, and other progressive parties with an urban base, less responsive to low-income citizens than their Dutch, German, and Swedish counterparts (Bjørklund Reference Bjørklund and Hagtvet1992; Rokkan Reference Rokkan and Dahl1966).
A detailed analysis of the issues on which Norwegian governments headed by Social Democrats have gone against the preferences of low- and middle-income citizens lies beyond the scope of this paper. We must also set aside the question of whether or not the strength of the populist Progress Party (with a vote share ranging between 14.6 percent and 22.9 percent since 2000), and its participation in government between 2014 and 2020, might have rendered Right-leaning governments more responsive to low-income citizens. What we can do to shed some light on “Norwegian exceptionalism” and, more generally, to further enhance our understanding of partisan conditioning of unequal responsiveness is to replicate the preceding analysis for a subset of survey items that pertain to economic and welfare issues. Needless to say, this involves a significant reduction in the total number of data points at our disposal and some loss of statistical power.
In assigning survey items to policy domains, we rely on the typology proposed by Kriesi et al. (Reference Kriesi, Grande, Lachat, Dolezal, Bornschier and Frey2006). The category “economic issues” thus encompasses policy questions pertaining on macroeconomic management, government regulation of the economy as well as government interventions (industrial policy), taxes, and government spending on income transfer programs as well as public services. Pooling data across the four countries, this definition of economic and welfare issues yields a sample of 681 survey items (as compared to 1,958 items for the preceding analysis).
To begin with, Table 2.7 shows the results of estimating our baseline models with preference gaps as the main independent variables (controlling for P50 support), without interacting preference gaps with government partisanship. For Germany and Sweden, these results are quite similar to the results for all survey items (shown in Table 2.4). In both of these cases, P90 preferences dominate P50 and P10 preferences. In the German case, P50 preferences also dominate P10 preferences. Although the coefficients for preference gaps are also positive for the Netherlands and Norway, none of the Norwegian coefficients clear conventional thresholds for statistical significance, suggesting that there is no systematic bias in favor of the affluent on economic issues. In the Dutch case, P90 preferences dominate P50 preferences more clearly than P10 preferences.
Table 2.7 Average marginal effects of preference gaps on policy adoption, controlling for P50 support, economic, and welfare issues only (two-year windows)
| Pooled | Germany | Netherlands | Norway | Sweden | |
|---|---|---|---|---|---|
| P90–P10 support | 0.577** | 1.010** | 0.339 | 0.157 | 0.482* |
| P90–P50 support | 0.787** | 1.563** | 0.671* | 0.338 | 0.440* |
| P50–P10 support | 0.506* | 1.422** | 0.154 | −0.268 | 0.021 |
Notes: *p < 0.05, **p < 0.01. See Tables 2.A13–15 in the online appendix for full regression results.
Turning to the conditioning effects of government partisanship, we again interact our partisanship variable (Left parties’ share of cabinet portfolios) with the P90–P50 preference gap. The results are summarized in Figure 2.5. The first thing to note is that Norway no longer stands out as an exceptional case when we restrict the analysis to economic and welfare issues. For the Netherlands and Sweden alike, Left participation in government significantly reduces pro-affluent bias in this policy domain. We do not observe such an effect for Norway, but it is no longer the case that Left participation increases unequal responsiveness. We also do not observe any significant reduction of unequal responsiveness in the German case. In short, the conventional partisan hypothesis seems to hold for the Netherlands and Sweden, but not for Germany and Norway.

Figure 2.5 Predicted probabilities of policy change, economic/welfare issues only, conditional on the P90−P50 preference gap and government partisanship (two-year windows)
Note: See Table 2.A16 in the online appendix for full regression results (and Table 2.A17 for results using the P90−P10 preference gap instead).
Changes in Policy Responsiveness by Income and Partisan Conditioning
Our German data begin in 1998, at a time when many Social Democratic parties, including the German one, had already embraced more market-friendly, less-redistributive “Third Way” policies, but our data for the other three countries extend farther back in time (to the early 1980s for the Netherlands and to the 1960s for Norway and Sweden). To explore whether the reorientation of Social Democratic parties in the 1990s entailed a decline in policy responsiveness to the preferences of low- and middle-income citizens under Left government participation, we conduct separate analyses for the period before 1998 and for the period from 1998 onwards, separating economic and welfare issues from other issues. For the P90–P50 preference gap, Figure 2.6 shows predicted probabilities of policy under the minimum Left government scenarios based on pooling survey items for all countries, that is, for three countries (the Netherlands, Norway, and Sweden) for 1960–1997 and for all four countries for 1998–2016.Footnote 13

Figure 2.6 Predicted probabilities of policy change by time period, conditional on the P90−P50 preference gap and government partisanship (two-year windows)
Note: See Table 2.A18 in the online appendix for full regression results.
Our analysis of temporal change features only pooled results for two reasons. To begin with, it goes without saying that the number of observations in country-specific analyses becomes very small when we restrict them to economic and welfare policies in one or the other subperiod.Footnote 14 Secondly, irrespective of the loss of statistical power, country-specific analyses restricted to one of these subperiods often end up comparing one or two Left-leaning governments with an equally small number of Right-leaning governments and they are arguably “contaminated” by the idiosyncratic experiences of one of these governments. We would not want to generalize about long-term changes in partisan conditioning of unequal responsiveness based on which parties happened to be in government during the Great Recession of 2008–2010.Footnote 15 Pooling data across our four countries serves to minimize the effects of such events and seems to be justified in light of the common patterns of unequal responsiveness and partisan conditioning that we have already observed.
Pooling data from all four countries, we find that Left-leaning governments were distinctly different from Right-leaning governments in the domain of economic and welfare policies prior to 1998. While the policy choices of Right-leaning governments responded primarily to the preferences of affluent citizens, Left-leaning governments were equally responsive to the preferences of low- and middle-income citizens in this policy domain. By contrast, Left-leaning and Right-leaning governments were equally biased in favor of the preferences of affluent citizens in other policy domains. Crucially for our present purposes, we no longer observe any partisan conditioning of policy responsiveness on economic and welfare issues in the post-1998 period. The pro-affluent bias of Right-leaning governments appears to have been more pronounced than in the earlier period and, at the same time, Left-leaning governments are no longer distinct from Right-leaning governments in the post-1998 period. Outside the domain of economic and welfare policies, we find that Left-leaning and Right-leaning governments were equally biased in favor of the preferences of affluent citizens in the pre-1998 period and that the pro-affluent bias of Left-leaning governments has diminished while the pro-affluent bias of Right-leaning governments has become more pronounced.
We hasten to note that the differentiation between Left-leaning and Right-leaning governments on “other issues” in the post-1998 period fails to meet standard criteria for statistical significance. The 95 percent confidence intervals overlap in two of the other panels of Figure 2.6 as well. The main take-away from the analysis summarized in Figure 2.6 is that we observe a significant effect of interacting preference gaps with government partisanship only for economic and welfare issues and only for the period prior to 1998.
Rethinking Unequal Responsiveness
Our main empirical findings can be summarized as follows. First, we find that middle-income as well as low-income citizens in Northwest Europe are consistently underrepresented compared to high-income citizens when representation is measured as responsiveness of policy outputs to stated preferences across the full range of issues captured by public opinion surveys. Second, we find that unequal responsiveness is moderated by government partisanship, such that the pro-affluent bias is less pronounced (but not zero) when Left parties are in government. The second observation comes with more qualifications than the first: it does not hold for one of our four countries (Norway) when pooling all issues, and when we separate policy domains and time periods, it applies mostly to economic and welfare issues before 1998 (possibly to noneconomic issues after 1998).
In closing, let us briefly reflect on the implications of these findings for the debates about the meaning of unequal responsiveness, as measured by Gilens (Reference Gilens2012), and the reasons why governments appear to be most responsive to the preferences of high-income citizens than to the preferences of low- and middle-income citizens. To begin with, it is truly striking that income biases in policy responsiveness, measured in this manner, are at least as pronounced in “social Europe” as in “liberal America” (Pontusson Reference Pontusson2005). How do we reconcile this observation with the fact that tax-transfer systems are significantly more redistributive in Germany, the Netherlands, Norway, and Sweden than in the United States?
As documented by Brooks and Manza (Reference Brooks and Manza2007), American citizens are, in general, less supportive of progressive taxation and redistributive social programs than Dutch, Germans, Norwegian, and Swedish citizens. This contrast holds across the income distribution and may well be more pronounced in the upper half of the income distribution. Support for redistribution among high-income citizens provides a partial explanation for the coexistence of unequal responsiveness and redistribution, but the origins of redistributive politics in Northwest Europe can hardly be explained by reference to the preferences of high-income citizens.
More plausibly, support for redistribution among high-income citizens in Northwest Europe represents an adaptation to policy developments generated by the political mobilization of low- and middle-income citizens in the wake of democratization and the Second World War. In making this argument, we think it is important to recognize that the status quo informs the policy agenda of policymakers and the questions that public opinion surveys ask as well as the way that citizens respond to these questions. And the status quo is, of course, an expression of past policy decisions. Though we lack the data necessary to test this proposition in a systematic fashion, it seems likely that policy responsiveness on economic and welfare issues, by Left-leaning and Right-leaning governments alike, was significantly more equal in Northwest Europe than in the United States in the postwar era.
Our finding that Germany, the Netherlands, and Sweden are comparable to the United States in terms of income biases in policy responsiveness in the period since the 1980s fits with the observation that German, Dutch, and Swedish governments undertook reforms that reduced the redistributive effects of taxation and government spending in the 1990s and 2000s (see Pontusson and Weisstanner, Reference Pontusson and Weisstanner2018, as well as the introductory chapter to this volume). For our present purposes, the key point is that the starting point of these developments was very different from the status quo in the United States. Consistent with this argument, perusing lists of proposed policy changes makes it quite clear that antiredistributive policy proposals are more common and more radical in Gilens’ US dataset than in our European datasets.Footnote 16
Left parties and their trade-union allies played a key agenda-setting role in Northwest Europe in the 1960s and 1970s, when redistribution became a prominent feature of tax-transfer systems in these countries. Again, our analysis yields suggestive evidence that Left-leaning governments in Northwest Europe were more responsive to low- and middle-income citizens than to the high-income citizens in the economic and welfare policy domain prior to the mid-1990s. In this respect, our findings are consistent with the long-standing literature on partisan politics as factor behind cross-national variation in the development of the welfare state.
On the other hand, these findings represent something of a challenge for the conventional view that mainstream Left parties in Northwest Europe have sought to offset the decline of the working-class constituency by appealing to middle-class voters based on new (“post-materialist”) issues while retaining the support of working-class voters based on their continued commitment to redistribution. This interpretation of the reorientation of mainstream Left parties would lead us to expect that mainstream Left parties remain “pro-poor” in the domain of economic and welfare policy while they have become more “pro-affluent” in other policy domains. Generalizing across our four countries, we find instead that mainstream Left parties, like mainstream parties of the Center-Right, have historically been biased in favor of affluent citizens outside the domain of redistributive politics and that post-1998 Left governments are first and foremost distinguished from earlier Left governments by their lack of responsiveness to low- and middle-income citizens in the domain of redistributive politics.
Setting government partisanship aside, what are the implications of our empirical findings for the debate about the causal mechanisms behind income and class biases in political representation? The “Americanist” literature identifies four plausible (and complementary) explanations for the income biases identified by Gilens (Reference Gilens2012) and others.Footnote 17 Perhaps most prominently, and most obviously, this literature posits that the costs of election campaigns and politicians’ reliance on private sources of campaign funding – what Gilens (Reference Gilens2015a: 222) refers to as the “outsize role of money in American politics” – constitute a key reason why policy outputs disproportionately correspond to the preferences of affluent citizens. A second line of argumentation in the US literature invokes the income gradient in political participation – in the first instance, in electoral turnout – to explain unequal policy responsiveness. Yet another line of argument focuses on lobbying by corporations and organized interest groups, positing either that the policy preferences of affluent citizens coincide with corporate interests to a greater extent than the policy preferences of low- and middle-income citizens or that affluent citizens are better organized and thus better represented through “extra-electoral” politics. Finally, Carnes (Reference Carnes2013) has pioneered a line of inquiry that focuses on the social and occupational backgrounds of elected representatives as the key source of unequal policy responsiveness in the United States.
As commonly noted by “Europeanists,” the fact that we also observe unequal responsiveness of a consistent and pervasive nature in countries like Germany and Sweden raises questions about the relevance of campaign finance. Surely, money matters to parties and politicians in these countries as well, but election campaigns are much less expensive and, for the most part, financed by public subsidies. The point here is not to deny that campaign finance might be an important factor in the US case, but rather to point out that other factors must be taken into account in order to explain the ubiquity of unequal responsiveness across countries. The same arguably holds for electoral participation as an explanation of unequal responsiveness. In all four of the countries analyzed in this chapter, we observe unequal turnout by income, but aggregate turnout is higher than in the United States and the income gradient is flatter. And yet overall policy responsiveness does not appear to be markedly more equal.Footnote 18
The argument about unequal responsiveness via the interest-group channel is more difficult to evaluate comparatively, but it seems reasonably clear that corporations and business associations wield less unilateral influence over elected representatives and unelected policymakers in countries with centralized policy consultations and, in particular, tripartite bodies that provide for negotiations over policy implementation as well as policy formulation between representatives of unions, employers, and governments. Our four countries all exemplify this model of “corporatist intermediation.” Especially in Norway and Sweden, unions have historically played, and continue to play, an important role as counterweights to the political influence of business actors (organized or not). Again, it is puzzling that we do not observe more equal policy responsiveness under these circumstances.
Of the various arguments invoked to explain unequal responsiveness in the United States, the argument about descriptive misrepresentation by income and social class seems most easily applied to Northwest Europe. Elected representatives in Germany, the Netherlands, Norway, and Sweden are less likely to be multimillionaires than their American counterparts, but they come overwhelmingly from the ranks of university-educated professionals and tend to belong to the top two or three deciles of the income distribution (see Carnes and Lupu’s contribution to this volume). A growing number of studies show that occupational background and associated life circumstances and social networks influence the policy preferences and priorities of elected officials across a wide range of different national contexts (Alexiadou Reference Alexiadou2022; Carnes and Lupu Reference Carnes and Lupu2015; Hemingway Reference Hemingway2020; O’Grady Reference O’Grady2019; Persson Reference Persson2021; Curto-Grau and Gallego in this volume). In a related vein, recent studies find that elected representatives tend to be more accurate in their perceptions of the preferences of affluent citizens than in the perceptions of the preferences of poor citizens (Pereira Reference Pereira2021; Sevenans et al. Reference Sevenans, Marié, Soontjens, Walgrave, Breunig and Vliegenthart2020). Arguably, this line of argumentation is particularly relevant for understanding the reorientation of mainstream Left parties, as the social backgrounds of candidates for public office fielded by these parties at the national level have become more like those of candidates fielded by other mainstream parties over the last two or three decades.
Beyond these four possible mechanisms, a number of alternatives ought to be considered. In addition to factors pertaining to the behavior of citizens and political elites, the unequal policy responsiveness that we observe across many countries might plausibly be attributed to the systemic power of capital. Following Block (Reference Block1977), the argument would be that governing parties are not responding to any specific demands placed on them by citizens or interest groups, but rather seeking to maximize their chances of reelection by incentivizing capital owners (private individuals) to invest and thereby improve macroeconomic performance. A crucial additional step in the argument would be that the policy preferences of high-income citizens tend to be more closely aligned with the interests of capital owners than the preferences of low- and middle-income citizens. For our present purposes, suffice it to note that this line of argument would seem to imply that unequal responsiveness should be most pronounced with regard to policy issues that bear directly on the interests of capital owners (and conflicts of interest between capital and labor). In other words, we should observe greater pro-affluent bias in the domain of economic and welfare policies than in other policy domains. Our analysis does not yield any evidence in support of this expectation.
Articulated by Persson (Reference Persson2023), another argument that might explain the ubiquity of unequal responsiveness concerns status-quo bias. Simply put, this argument posits that low-income citizens are less satisfied with the status-quo than high-income citizens and, as a result, more likely to support policy changes in general. To the extent that this is true, and given the way that we measure policy outcomes, status-quo bias produces policy outcomes that look as if policymakers were responding disproportionately to the demands of affluent citizens. Analyzing the Swedish dataset on which we draw for this paper, Persson (Reference Persson2023) shows that income groups have had very similar preferences with regard to policy changes that have been adopted, but low-income citizens have been much more supportive of policy changes that have not been adopted than affluent citizens (with middle-income support very much in the middle). As shown in Table 2.2, however, we observe little or no difference between income groups in their average support for policy changes in Germany, the Netherlands, and Norway.Footnote 19
Related to status-quo bias, there is an alternative interpretation of the evidence for unequal policy responsiveness presented earlier that we ought to engage with in a more systematic way than scholars working in this domain have done so far. Observing that policy change happens more often when it is supported by affluent citizens and that support by citizens in the lower half of the income distribution has little, if any, effect on the probability of policy adoption, it is commonplace to conclude that politicians listen to affluent citizens more than they listen to low- and middle-income citizens. But perhaps it is the other way around. Perhaps it is the case that affluent citizens listen more to politicians than low- and middle-income citizens do. We know that income and education are closely correlated and many studies demonstrate that more educated citizens are more interested in and knowledgeable about politics (e.g., Schlozman, Verba, and Brady Reference Schlozman, Verba and Brady2012). Arguably, this means that affluent citizens are more likely to take their cues from policymakers (or debate among “insiders”) in deciding whether they favor or oppose specific policy proposals. More specifically, it seems quite plausible to suppose that more “sophisticated” citizens are more likely to rule out policy options that are unrealistic in the sense that they are unlikely to be entertained by policymakers.Footnote 20
Our empirical findings concerning partisan conditioning of unequal responsiveness raise questions about the reverse-causality line of argument. For the period prior to 1998, our results indicate that Left governments were more responsive to the preferences of low- and middle-income preferences in the domain of economic and welfare policies, but they were more responsive to high-income preferences in other policy domains. Simply put, why should the affluent (well-educated) adapt their preferences to elite discourses under some governments but not others and in some policy domains but not others? And why did low-income citizens apparently take cues from Left governments prior to the 1990s, but not thereafter? When all is said and done, the evidence on partisan conditioning presented in this paper suggests that unequal policy responsiveness to the preferences of different income groups does capture something important about the distribution of political influence in Northwest Europe as well as the United States. Yet much research remains to be done in order to explain the ubiquity of unequal policy responsiveness as well as variation in responsiveness across time, policy domains, and countries.


 Open access