

A shared expectation among both pundits and scholars is that more inequality will be met with more demand for redistribution. Pundits couch this expectation in moral terms: while Left-leaning pundits expect voters to be outraged by “unfair” income differences,Footnote 1 Right-leaning commentators dispute the unfairness charge and expect envy and resentment to drive rising demand for redistribution.Footnote 2 For scholars in political economy, expectations of rising support for redistribution often have little to do with the type of fairness concerns voiced by pundits. These expectations are rooted instead in a set of assumptions regarding human behavior (people prefer more disposable income than less), the redistributive design of the welfare state, and people’s extensive knowledge of the latter’s implications for their own pocketbook (Meltzer and Richard Reference Meltzer and Richard1981). Under these assumptions, as inequality increases, so does the share of voters who stand to benefit from redistribution and who update their policy preferences in line with their material self-interest (e.g., see Lupu and Pontusson, this volume).Footnote 3 This chapter demonstrates how incorporating the type of fairness concerns voiced by pundits into existing political economy models can help explain the absence of a redistributive policy response to rising inequality, despite expectations of growing support for such policy.
An important step in this demonstration is conceptualizing and operationalizing “fairness.” I define fairness reasoning as the thought process through which individuals act as if a third-party judge ruling on the fairness of a given situation and acting to maximize fairness accordingly. In this case, maximizing fairness means expressing support for a policy that moves the status quo closer to what is prescribed by shared norms of fairness. Based on this definition, to study fairness reasoning, researchers first need to identify the finite set of fairness norms widely agreed upon by all members of a given polity. Having done so, they can then measure people’s beliefs about the extent to which the status quo deviates from what these norms prescribe, fairness beliefs for short. Fairness beliefs I show introduce a wedge between changes in the distribution of market income and support for redistribution, explaining why rising income inequality has a less-than-straightforward impact on attitudes toward redistributive policies.
This chapter unfolds in four sections. First, I argue that fairness reasoning, as defined earlier, is the individual-level manifestation of a moral system. I describe the moral system underpinning redistributive institutions and policies in Western democracies and identify the two key norms of fairness that characterize it. I show that these two norms receive broad support. In sections 2 and 3, I turn to fairness beliefs. Fairness beliefs function as an anchoring proto-ideology, a mental map helping people interpret a complicated and uncertain world and pick redistributive policies that increase the fairness of the status quo. As I show in section 2, the conceptualization of fairness reasoning proposed in this chapter suggests a mental map that is very different from the one hypothesized in existing work on the topic. In section 3, I propose a friendly horse race between existing work and the conceptualization presented in this chapter: the evidence overwhelmingly supports the latter. The last section discusses implications for our understanding of the demand side of redistributive politics in times of rising inequality.
Fairness Reasoning, Moral Systems, and Social Order
Studies across the social sciences show that the impulse to do what is collectively recognized as the “right thing” is central to human cognition. This impulse is the individual-level observable manifestation of a moral system, that is, a social technology that helps regulate the constant toggle between cooperation and opportunistic behavior characteristic of social life. This moral system contributes to social orderFootnote 4 and the provision of stable institutional solutions to social dilemmas (Baumard Reference Baumard2016; Binmore Reference Binmore1994; Gintis et al. Reference Gintis, Bowles, Boyd and Fehr2005; Graham, Haidt, and Nosek Reference Graham, Haidt and Nosek2009; Tomasello Reference Tomasello2016). In this section, I unpack the moral system underpinning redistributive institutions in Western democracies. In doing so, I will provide a more precise definition of a moral system and sketch its role in the provision of social order and large-scale cooperation.
Famous examples of moral systems are discussed in the work of Margaret Levi on taxation and mass mobilization as well as that of Eleonor Ostrom on the monitoring of common pool resources (Levi Reference Levi1991; Ostrom Reference Ostrom1998). Given their centrality, not including fairness reasoning in workhorse models of redistributive politics represents a significant oversight. This is especially true when it comes to forming an opinion on redistributive policies: for most people, stakes are too low or too uncertain for selfish material concerns to distract them from doing the fair thing. First, because social programs are “locked-in” (Pierson Reference Pierson1996), policy changes tend to be incremental, affecting existing institutions only on the margin, often with delayed effects, which are themselves hidden by deficit spending and complicated budget arbitrations. Fearing a backlash from affected constituents, politicians have only limited incentives to provide clarifying information on a policy’s diffuse pocketbook implications. Second, in representative democracies, expressing an opinion on a given policy, most often in the context of a survey, is itself a low-stakes task. In such context, the assumption that voters are fully informed selfish income maximizers is heroic at best.Footnote 5 Instead, most people satisfice, that is, settle on a “good enough” policy position using cognitively less demanding decision heuristics that provide satisfactory outcomes. Fairness reasoning is one form of satisficing. It manifests itself as a simple decision rule: “if fair then support,” “if unfair then oppose.” Understanding how people evaluate a policy change as fair or not requires first unpacking the moral system underpinning redistributive institutions in postindustrial democracies.
In Western democracies, the allocation of economic resources is affected by a complex bundle of institutions and policies. A central distinction is the one made between the “market economy” on the one hand and the “welfare state” on the other. The market economy generates income that is taxed to fund the social transfers distributed by the welfare state. The welfare state organizes social solidarity, that is, the collective endeavor through which individuals are insured against life’s main risks (unemployment, old age, illnesses…).Footnote 6 Governments can affect the distribution of income in a given society through three channels: (1) predistribution policies, which affect how market income is generated and distributed, (2) taxation policies, which affect how much market income people get to keep, and (3) changes to the design of the welfare state, which affect the extent to which social insurance is redistributive. With regards to the latter, governments can increase the generosity of means-tested benefits, tweak the relative mix of earnings-dependent and nonearnings-dependent benefits (more or less “giving”) and change the legal definition of who is included in the welfare state (more or less “sharing”). Institutional stability is more likely when a majority finds the existing institutional bundle “fair,” or at least “fair enough” according to shared norms of fairness. Institutional change is more likely when a majority perceives the status quo as unfair. What exactly does “fair” mean in this context? Or to put it differently, what are the norms of fairness people rely on to justify their support or opposition to status quo-changing policy proposals, whether related to predistribution (1), income taxation (2), or social policy design (3)?
A dominant line of research emphasizes the following allocation principle: a fair allocation is one in which economic rewards are related to effort (i.e., “effort pays”). In the words of Benabou and Tirole (2006), support for income redistribution is affected by the views people hold about “the causes of wealth and poverty, the extent to which individuals are responsible for their own fate, and the long-run rewards to personal effort.” This common approach to fairness reasoning in Western democracies does not explicitly engage with the market economy/welfare state dualism mentioned earlier. Yet, as I argue next, the manufacturing of consent is achieved very differently depending on the institutional realm under consideration.
In the market economy, mass consent implies the shared agreement that the status quo abides by what the proportionality norm prescribes, namely that rewards be proportional to merit, itself a combination of personal decisions as a free agent, individual work ethic, acquired skills, and innate talent. Milton Friedman himself emphasized its centrality to the market economy’s system of justification: “payment in accordance to product,” he writes, is part of the “basic core of value judgments that are unthinkingly accepted by the great bulk of [a society’s] members” and enables “resources to be allocated efficiently without compulsion” (p. 167). This is the norm captured by the “does effort pays?” literature. But it is only half of the story: what people experience as actors in the market economy is separate from what they experience as stakeholders in a resource pooling effort embodied by the welfare state. One key difference is the importance of free-riding concerns: while mostly irrelevant for thinking about how economic resources are allocated by the market economy, they are central to how people think about how economic resources are allocated by the welfare state. This suggests the existence of a second norm, the reciprocity norm, which prescribes that all members of a group contribute to the collective effort and that free riding does not go unpunished.
Numerous studies have documented the importance of the reciprocity norm when people are engaged in joint cooperative endeavors (Axelrod Reference Axelrod1980; Ostrom and Walker Reference Ostrom and Walker2003). This norm is both simple to describe and surprisingly difficult to theorize. Simply stated, the norm turns people into conditional cooperators. People willingly contribute to a collective endeavor if they feel others are not free riding (positive reciprocity). They punish free riders by either ceasing to cooperate or by excluding them from accessing the goods generated by cooperation (negative reciprocity). Behavior attached to the reciprocity norm is thus inherently two-faceted and can be presented in one of two lights. The more positive light casts it as a form of conditional altruism: people’s default position is to help others unless others are “antisocial” (Fong, Bowles, and Gintis Reference Fong, Bowles, Gintis, Kolm and Mercier Ythier2006; Henrich et al. Reference Henrich, Robert Boyd, Colin Camerer, Gintis and McElreath2001). Viewed in a negative light, it is a form of conditional punishment: people’s default position is to deny help to others unless they are prosocial.
If the proportionality and reciprocity norms are indeed manifestations of consent-inducing moral systems, agreement with these two norms should be quasi-universal. Specifically, people applying the same norm to the same situation will unanimously agree on whether or not this situation is fair and in need of corrective intervention. Such unanimity is routinely observed in experimental settings where the features of a given situation are carefully explained and communicated to participants (Cappelen et al. Reference Cappelen, Konow, Sørensen and Tungodden2013; Konow Reference Konow2003; Petersen Reference Petersen2012). It is unfortunately beyond the scope of this chapter to review this literature in full: the interested reader can turn to the summary of this evidence provided in Cavaillé Reference Cavaillé2023 (Chapter 2). Another type of evidence comes from cross-national surveys. The World Value Survey, for example, includes items that plausibly measure agreement with the proportionality norm: “Imagine two secretaries, of the same age, doing practically the same job. One finds out that the other earns considerably more than she does. The better paid secretary, however, is quicker, more efficient, and more reliable at her job. In your opinion, is it fair or not fair that one secretary is paid more than the other?”Footnote 7 This question holds constant attributes one is not responsible for (age, tasks being given to accomplish) and only varies factors one has control over (i.e., effort). In all countries, more than four out of five respondents find it fair that one secretary is paid more than the other. Relatedly, the 2008 wave of the ESS asked respondents whether they agreed with the statement that “(a) society is fair when hard-working people earn more than others.” On average over 80 percent of respondents agree with this statement, with a high of 92 percent in Austria and a low of 70 percent in the Czech Republic.
Unfortunately, survey items documenting widely shared agreement with the reciprocity norm in postindustrial democracies are not available. One exception is a recent set of studies by Michael Bang Petersen and coauthors focusing on two most-different cases, namely the United States and Denmark. In one study, Petersen et al. (Reference Petersen, Sznycer, Cosmides and Tooby2012) randomly assign representative samples of American and Danish respondents to one of three treatment conditions. Respondents in all three groups are presented with a male welfare recipient and then asked: “To what extent do you disagree or agree that the eligibility requirements for social welfare should be tightened for persons like him?” In one treatment, no cues are provided about the recipient’s labor market attachment and effort. In another treatment condition, respondents are told that he “never had a regular job” and that, while “he is fit and healthy,” he is not “motivated to get a job.” In a third treatment condition, respondents are told that the recipient “always had a regular job” but was affected by a “work-related injury” and is “motivated to get back to work again.” Assuming individuals in both countries reason in similar ways based on the reciprocity norm, there should be little to no difference in how respondents treat the “deserving” recipient relative to the “undeserving” one. In line with expectations, the authors find that, “despite decades of exposure to different cultures and welfare institutions, two sentences of information (…) make welfare support across the U.S. and Scandinavian samples substantially and statistically indistinguishable.”
To sum up, the existence of moral systems compel people to behave fairly, that is, justify one’s actions (and policy preferences) according to shared norms of fairness. The proportionality norm is most often mobilized when evaluating the fairness of market outcomes and policies that interfere with such outcomes. It constrains envy and resentment from those who have “less than others” and promotes consent over policies that take from those who have more than others. The reciprocity norm is most often mobilized when evaluating the fairness of redistributive social insurance. It helps a group cooperate over the provision of social solidarity and promotes consent over design features that make social solidarity more or less redistributive.Footnote 8 Note that the distinction between deviations from what the proportionality norm prescribes on the one hand, and deviations from what the reciprocity norm prescribes on the other is partly obscured by the generic terms available to discuss the fairness of a given situation, and relatedly the fairness of the status quo. Specifically, two outcomes can be both judged as fair or unfair, with each evaluation referring to different norms of fairness. Relatedly, the same concept of desert or deservingness can apply to very different fairness judgments as illustrated in Figure 10.1.
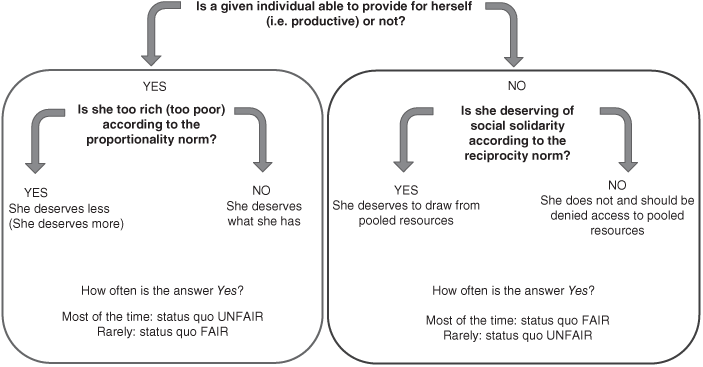
Figure 10.1 What is fair? Who is deserving?
In the realm of mass attitudes toward redistributive social policies, behaving fairly in line with the proportionality norm will mean, for example, opposing (supporting) high taxes because differences in market income (do not) reflect differences in effort and talent. Behaving fairly in line with the reciprocity norm will lead some to oppose social spending cuts because it unfairly affects “deserving” cooperators. Others, in contrast, will support cuts to programs that unfairly reward free riders over those who, in contrast, “carry their weight.” This implies that people rely on prior knowledge regarding the status quo’s defining features. Put differently, they hold empirical beliefs about the nature of the status quo, specifically about the prevalence of deviations from what norms of fairness prescribe (see Figure 10.1). I turn to this point next.
Fairness Beliefs and Demand for Redistribution
Moral systems help promote both stability (consent) and change (dissent). Stability is more likely when enough individuals (1) share the same understanding of what is fair and (2) share the perception that the status quo is fair according to this definition. Change is more likely when enough individuals (1) share the same understanding of what is fair and (2) share the perception that the status quo is unfair according to this definition.Footnote 9 In other words, the existence of a stabilizing moral system implies not only that people agree on shared norms of fairness (what ought to be) but also that people hold beliefs about the fairness of the status quo (beliefs about what is). Yet, while the existence of a stabilizing moral system implies the existence of fairness beliefs, it does not imply that people hold the same set of beliefs. Put differently, agreement on what ought to be does not imply agreement on what is. Indeed, whether a redistributive system is best described as stable (a majority agrees that the status quo is fair), ripe for change (a majority agrees that the status quo is unfair), or a mix of both is an empirical question: moral systems are a social technology that fosters social order, they do not deterministically induce it.
From individuals’ perspective, fairness beliefs function as an anchoring proto-ideology, a mental map helping people interpret a complicated and uncertain world and pick redistributive policies that increase the fairness of the status quo. This suggests that attitudes toward redistributive policies are structured in ways that reflect this mental map. To investigate these empirical patterns, I proceed through a “three-cornered fight” among (1) existing approaches to fairness reasoning (the “does effort pay?” literature), (2) my own framework, and (3) the available data (Hall Reference Hall2006: 27). I start by showing that the argument presented in this chapter suggests a mental map that is very different from the one hypothesized in existing work on the topic. I then show that the evidence overwhelmingly supports the former.
Fairness Reasoning and Support for Redistribution: State of the Art
The previously mentioned “does effort pay?” literature argues that support for income redistribution is affected by the views people hold about “the causes of wealth and poverty, the extent to which individuals are responsible for their own fate, and the long-run rewards to personal effort” (Bénabou and Tirole Reference Bénabou and Tirole2006). If people are rich (poor) for reasons out of their own control, then effort does not pay, income differences are unfair and income redistribution is justified and even fairness-maximizing. In the words of Fong (Reference Fong2001), “the extent to which people control their own fate and ultimately get their just deserts are first-order determinants of attitudes toward inequality and redistribution, even “swamping the effects of own income and education.”
First, a few words on how the literature has conceptualized and measured support for income redistribution, or demand for redistribution for short. One survey item, identified in this chapter as “the traditional redistribution item,” has become researchers’ go to for measuring individual-level differences in support for income redistribution. It asks respondents whether they agree with a version of the following statement: “the government should redistribute income from the better-off to those who are least well-off.” This survey item is also one of the few items that has been asked repeatedly over time in cross-national surveys. As often happens when researchers are constrained by past data collection decisions, this measurement tool has shaped how researchers conceptualize the dependent variable: support for redistribution is now commonly defined as agreement with the policy principle that governments should redistribute income from the haves to the have nots.
As previously discussed, in practice, redistribution occurs through a bundle of heterogeneous policies that affect individuals’ material conditions by taking (e.g., through income or payroll taxes) or not taking (e.g., tax credits) on the one hand, giving more or giving less (e.g., in-cash or in-kind benefits) and sharing (e.g., universal access to healthcare in Great Britain) and not sharing (e.g., benefit targeting as with Medicare in the United States). Under that definition, understanding mass support for redistribution implies understanding how people answer not only the traditional redistribution question but also questions such as:
Should the government financially support those who cannot provide a decent living for themselves? How generous should this support be, and who should pay for it?
Should healthcare be the same for all, irrespective of income, or is a residual system providing basic services enough?
Are taxes too progressive? Not progressive enough?
Can tax cuts come at the expense of social services? If so, should services that benefit the worse off be protected from such cuts?
Are social programs and the taxes that fund them too large? not large enough?
A common approach in the literature is to look for (and usually find) a latent variable that shapes the answers to most, if not all, of the questions listed above. This latent dimension is often described as capturing left-right preferences on “economic issues,” “redistributive issues,” or “government involvement in the economy” (Ansolabehere, Rodden and Snyder Reference Ansolabehere, Rodden and Snyder2008).Footnote 10
These two measurement strategies (the traditional redistribution item and the multi-item latent dimension) are often assumed to capture the same thing, that is, the extent to which people are inclined to support policies designed to take from those who have more to help those who have less, which Alesina and Giuliano describe as one of “the most important dividing line[s] (…)” in democratic politics (Alesina and Giuliano Reference Alesina, Giuliano, Benhabib, Bisin and Jackson2011: 94). According to the “does effort pay?” line of work, one’s position on this dividing line is well predicted by one’s beliefs about the role of effort for explaining both wealth and poverty. This perspective is sketched on the left-hand side of Figure 10.2.
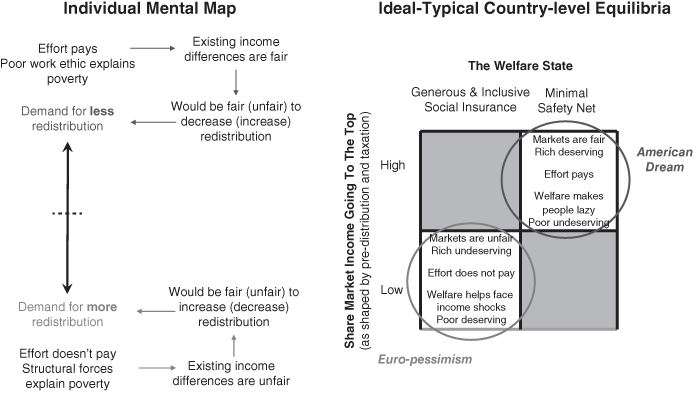
Figure 10.2 Fairness reasoning and demand for redistribution: unidimensional approach
According to Alesina and Angeletos (Reference Alesina and Angeletos2005; see also Bénabou and Tirole Reference Bénabou and Tirole2006), the relationship between demand for redistribution and the belief that effort pays also helps explain why countries differ in their work-to-leisure ratio, levels of income inequality, as well as the share of GDP redistributed through taxes and social spending. Specifically, beliefs, policy preferences, behavior, and institutions all combine to produce a stable outcome, or social equilibrium. Alesina and Angeletos (Reference Alesina and Angeletos2005) identify two ideal-typical equilibria: an American Dream equilibrium and a Euro-pessimistic equilibrium. In the American Dream equilibrium, people believe that effort pays and oppose predistribution policies, progressive taxation, and the redistributive features of social insurance because these policies undermine fairness. Predistribution policies are unwarranted because economic institutions already reward effort. Similarly, taxing those who earn more market income is unfair given that they have worked harder and, consequently, deserve to keep it. Finally, social insurance programs designed to redistribute to the chronically poor and unemployed are also unfair given that they transfer resources to people who prefer living off benefits than trying their best to improve their plight. In this equilibrium, the poor and unemployed are castigated as lazy, income redistribution is limited to offering a charity-like minimal income floor and total effort (annual hours worked) is high. As a result, income inequality is also high.
In the Euro-pessimistic equilibrium, people believe that “effort does not pay” and, consequently, are more supportive of predistribution policies, progressive taxation, and social insurance that is generous and inclusive because these policies help maximize fairness. Specifically, predistribution policies help correct unbalanced labor relations, progressive taxation is fair because it affects the “undeserving” rich and redistributive social insurance helps recipients who, despite efforts to escape poverty, fail to do so because of an unfair “economic system.” In this equilibrium, the poor are less likely to be stigmatized as lazy, income redistribution is extensive, and total effort is comparatively lower than in the American Dream equilibrium. As a result, income inequality is also lower. These two equilibria are summarized in Figure 10.2 (right-hand side). In the next section, I contrast this conceptual framework to the one presented in this chapter.
From One to Two Dimensions
I have argued that what counts as a fair allocation of market income is different from what counts as a fair allocation of social benefits, meaning that beliefs about the fairness of the former can differ from beliefs about the fairness of the latter. The reason for this disconnect extends beyond the existence of two norms instead of one and also follow from the relationship between fairness beliefs and status. People derive status from being “productive members” of society. The distinction between a market economy and the welfare state suggests at least two distinct understandings of “productive.” One draws on an individual’s market value made visible to all through one’s market income: the higher the income, the higher the status. People tend to form proportionality beliefs that make them feel good about their own income level: if high, then they are more likely to believe that effort pays, if low, then they are more likely to think that it does not (Hvidberg et al. Reference Hvidberg, Kreiner and Stantcheva2020). The other understanding of “productive,” overlooked by the “effort pays” literature, draws on an individual’s membership in the welfare state, a resource pool of historical scope. In this case, being a productive member involves “carrying one’s weight” and not free riding on shared resources. Being a productive member is also status-enhancing because of what the members of the pool “owe to one another and to no one else, or to no one else in the same degree,” namely welfare. This implies a distinction between high(er) status members who can access welfare and lower status strangers who cannot. Such distinction makes little sense in a market economy, an “indifferent association, determined solely by personal preference and market capacity” and “open to whoever chooses to come in” (Walzer Reference Walzer1983). People tend to form reciprocity beliefs that make them feel good about being themselves as a deserving member of this resource pooling endeavor. This implies a distinction between oneself and the undeserving other, which can lead to overestimating the prevalence of free riding, even among those most likely to rely on social benefits (Lamont Reference Lamont2002). It can also lead to distorted perceptions of immigrants as welfare shoppers and the perception that access that is not conditional on full membership as inherently unfair.Footnote 11 In other words, there are no reason to expect a priori that status-boosting proportionality beliefs align with status-boosting reciprocity beliefs as hypothesized by the “does effort pay?” literature.
As a result of this disconnect between proportionality and reciprocity beliefs, for some people, fairness reasoning also implies a disconnect between attitudes toward policies that take market income from those who have more (e.g., predistribution and taxation policies) and attitudes toward policies that give to people who can no longer provide for themselves (e.g., generous and inclusive social insurance). As a shorthand, I will call the first type of policy redistribution from policies and the second type redistribution to policies. Below, I provide examples of both types of policies:
Redistribution from Policies
New antitrust legislation or regulations that increase drivers’ bargaining power vis-a-vis a platform like Uber
A progressive wealth tax or closing tax loopholes that benefit rich corporations
A cap on CEO salary
Equal-pay-for-equal-work reforms
Redistribution to Policies
Increase (decrease) in spending on social programs that maintain the living standards of the able-bodied unemployed
Making access to benefits conditional on past contributions and/or on length of residency (if immigrant)
Extending existing generous policies (healthcare, unemployment insurance, pensions) to previously excluded individuals with weak labor market attachment
Because of fairness reasoning, attitudes toward policies that affect the distribution of market income on the one hand can differ from attitudes toward policies that affect the redistributive features of social insurance on the other. This perspective, sketched on the left-hand side of Figure 10.3, implies that individuals sort across four ideal-typical proto-ideological profiles: (1) consistently pro-redistribution (bottom-left quadrant), (2) consistently antiredistribution (top-right quadrant), (3) in favor of more generous redistribution to but skeptical of more redistribution from (top-left quadrant), and (4) inclined to support more redistribution from while opposed to more redistribution to (bottom-right quadrant).
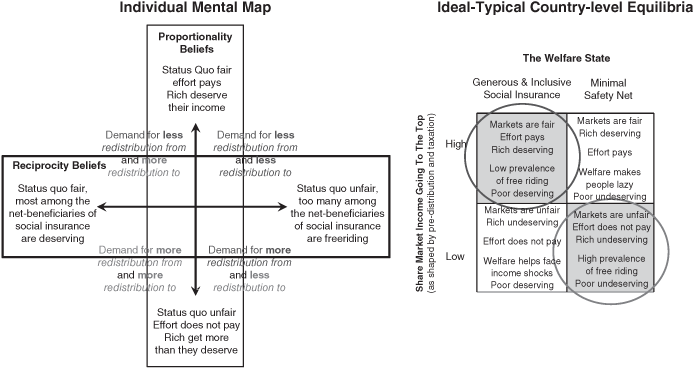
Figure 10.3 Fairness reasoning and demand for redistribution: two-dimensional approach
This two-dimensional conceptualization of demand for redistribution stands in contrast to the mainstream unidimensional conceptualization of demand for redistribution and fairness reasoning sketched on the left-hand side of Figure 10.2. The latter implicitly assumes that proportionality and reciprocity beliefs reinforce each other: the belief that the world is fair (unfair) according to the proportionality norm goes alongside the belief that the world is unfair (fair) according to the reciprocity norm. Specifically, if effort pays, then market income is distributed fairly and net beneficiaries of social transfers are free riders who are not trying hard enough. Conversely, if effort does not pay, income differences are unfair and net beneficiaries cannot be blamed for a situation they cannot control. Relatedly, if the rich are deserving (undeserving) of their high earnings and should not (should) be taxed, then the poor are deserving (undeserving) of their plight and should not (should) be helped. In other words, in this framework, fairness reasoning contributes to what scholars call “issue constraint” (Baldassarri and Gelman Reference Baldassarri and Gelman2008; Converse Reference Converse2006), that is, ideological consistency across beliefs and policy preferences within a given issue area. In contrast, I hypothesize that institutional dualism, as well as free riding and membership concerns that are uniquely salient to the welfare state, imply a disconnect between proportionality and reciprocity beliefs.
Relatedly, the existence of two norms of fairness or two separate institutional spheres suggests not two but four ideal-typical social equilibria (right-hand side of Figure 10.3). To the high redistribution and low redistribution equilibria hypothesized by the “does effort pay?” literature (top-right and bottom-left corners), I add two other combinations: one that limits income inequality at the top but fails to offer generous social insurance cover for the poor and the unemployed (bottom-right corner) and another that does not affect top income inequality but nevertheless engages in large risk pooling through universal and generous social insurance (top-left quadrant). This is summarized on the right-hand side of Figure 10.3.
In the remainder of this chapter, I use survey data to examine which of the unidimensional or two-dimensional conceptualizations of fairness reasoning and demand for redistribution provides the best fit, focusing first on individual-level mental maps and next on country-level differences in support for redistribution to and redistribution from.
Evidence for a Two-Dimensional Mental Map
Because people carry a diverse set of considerations regarding the fairness of the status quo, using more than one survey item is necessary to better differentiate individuals holding mostly “status quo unfair” considerations from people holding mostly “status quo fair” considerations. To proxy for an individual’s proportionality beliefs, researchers can rely on at least three types of survey items. A first type includes items used by the “does effort pay?” literature. Respondents are asked to what extent they believe that economic institutions reward talent and effort. These items need to be complemented with questions asking about the prevalence of norm-violating/conforming outcomes and behaviors. Indeed, the goal is to measure not only whether one believes that effort pays but also whether one believes that effort pays for most people, most of the time. A third type of item directly elicits respondents’ perceptions of the size of the disconnect between existing income differences (what is) and fair income differences (what ought to be).Footnote 12 Below, I provide example of survey items that can be used to measure proportionality beliefs:Footnote 13
Fairness of Market Institutions
“In COUNTRY, people get rewarded for their intelligence and skill. Agree/disagree?” ***
“In COUNTRY, people have equal opportunities to get ahead. Agree/disagree?” ***
“In COUNTRY, with hard work and a bit of luck most people can succeed financially. Agree/disagree?”
“The stock market is mostly there to help rich people get richer. Agree/disagree?”
“The economic system mostly benefits a privileged minority. Agree/disagree?”
Prevalence of Norm-Violating Outcomes
“In your opinion, what share of rich (poor) people are rich (poor) for reason that have nothing to do with how hard they work? All/most/some/none”
“For people born in a poor (rich) family, hard work leads to economic success most of the time/some of the time/rarely/never?” **
“What share of people born in [COUNTRY] in a [POOR/RICH/MIDDLE CLASS] family get a fair shot at life? All/most/some/none” ***
Fairness of the Income Distribution
“What is the income difference between a janitor/bricklayer and a doctor/CEO?” “In your opinion, should this difference be larger/smaller/stay the same?” ***
“Are differences in market income too large/too small/about right?” ***
In the case of the reciprocity norm, norm violation takes the form of people free riding on the common effort. To measure reciprocity beliefs, researchers can ask respondents what they think about benefit recipients’ tendency to cheat “the system” and their perceptions of the system’s ability to successfully identify cheats. Also important are people’s priors regarding how others behave when confronted with the option to free ride on shared resources, something economists like to call “moral hazard.” Below, I provide example of three types of survey items that can be used to measure reciprocity beliefs:Footnote 14
Prevalence of Free Riders in the Recipient Population
“Most unemployed people are trying hard to find a job. Agree/disagree?” ***
“People on benefits do not really have a choice. Agree/disagree?”
Failure to Identify Free Riders
“What share of social benefit cheats are successfully identified? Most/some/only a few/none” ***
“How often does welfare go to people who do not really deserve it? Most of the time/some of the time/rarely” ***
“What share of people who qualify are wrongly denied benefits? A majority/some/only a few/none” ***
Human Nature and Moral Hazard
“Social benefits are too generous and make people lazy?” ***
“To what extent can others be trusted to not abuse and cheat the system? Most of the time/sometime/rarely/never” ***
With enough items similar to those listed earlier, alongside items asking about redistribution from and redistribution to policies, I can directly test which of the two hypothesized mental maps best fits the data using both exploratory and confirmatory factor analysis. To the best of my knowledge, the British Social Attitude Survey (BSAS) is the only representative survey that includes both proportionality and reciprocity items alongside redistribution from and redistribution to policy items. Using the 2016 wave of the BSAS, I examine whether proportionality beliefs and redistribution from policy items load on the same latent factor while reciprocity beliefs and redistribution to policy items load on a separate, only weakly correlated factor.Footnote 15 If the unidimensional framework better fits the data, then all items will load on the same latent factor, with the latter approximating the latent left-right economic dimension often described in the existing literature. Alternatively, items might load on separate but highly correlated factors. Because cross-national surveys do not ask the same respondents about both reciprocity and proportionality beliefs, I cannot repeat this analysis in countries beyond Great Britain. Instead, I follow alternative empirical strategies (described in more detail later) designed to best leverage the set of items available in the cross-national European Social Survey (ESS). When combined, these tests provide additional evidence that the patterns uncovered in the British context are not unique to this country.
Moving from the individual to the country level, I combine data from the ESS and the International Social Survey Programme (ISSP) and examine whether, in line with the unidimensional approach, countries that find it fair (unfair) to increase redistribution from the better off as prescribed by the proportionality norm also find it fair (unfair) to increase redistribution to the worse off as prescribed by the reciprocity norm. Against this expectation, I expect two additional clusters of countries to emerge: countries skeptical of more redistribution from policies but supportive of extending redistribution to on the one hand, and countries enthusiastic about more redistribution from but opposed to increasing redistribution to on the other.
Individual-Level Results
Since the late 1980s, the BSAS has repeatedly asked a battery of items aimed at measuring core political beliefs regarding income redistribution, labor relations, income inequality, social insurance, unemployment insurance, and welfare recipients (Evans, Heath, and Lalljee Reference Evans, Heath and Lalljee1996). When combined into multiple-item scales, these items have helped researchers place respondents on a “socialist versus laissez-faire – or left-right – dimension” as well as a “prowelfare versus antiwelfarist” dimension (Park et al. Reference Park, Clery, Curtice, Phillips and Utting2012). To the best of my knowledge, there has been no attempt to use these items as part of a larger inquiry into the mental maps people use to reason about redistributive social issues. I focus my analysis on the 2016 wave in particular, as it includes additional questions on the topic of progressive taxation alongside questions about social spending for the poor and the unemployed, as well as the traditional redistribution item used in most studies of redistributive preferences. Items are listed in Table 10.1.Footnote 16 Specifically, respondents were asked a set of questions about existing tax levels, differentiating between the taxes of the rich and those of the poor. I use these items to classify people based on the extent to which they think that the tax system in 2016 is not progressive enough (tax on the rich too low and on the poor, about right or too high). I assume that this measure provides a decent proxy of support for, or opposition to, a more progressive tax system and examine whether the tax progressivity item loads on the same dimension as items that measure proportionality beliefs.
Table 10.1 Attitude structure in Great Britain: confirmatory factor analysis
| Item wording | 1st Factor | 2nd Factor |
|---|---|---|
| Reciprocity beliefs | ||
| Benefits for unemployed people: too low and cause hardship vs. too high and discourage job seeking [dole] | 0.60 | |
| The welfare state encourages people to stop helping each other [welfhelp] | 0.45 | |
| If welfare benefits weren’t so generous, people would learn to stand on their own two feet [welffeet] | 0.87 | |
| Many people who get welfare don’t really deserve any help [sochelp] | 0.71 | |
| Most unemployed people could find a job if they really wanted one [unempjob] | 0.71 | |
| Most people on the dole are fiddling [dolefidl] | 0.69 | |
| Redistribution to policies | ||
| Gov’t responsibility: good standard of living for the unemployed [govresp6] | 0.51 | 0.21 |
| More spending on unemployment benefits [morewelf] | 0.50 | 0.20 |
| Proportionality beliefs | ||
| Management will always try to get the better of employees if it gets the chance [indust4] | 0.65 | |
| There is one law for rich and one for poor [richlaw] | 0.71 | |
| Working people do not get their fair share of nation’s wealth [wealth] | 0.87 | |
| Big business benefits owners at the expense of workers [bigbusnn] | 0.83 | |
| Redistribution from policies | ||
| Tax progressivity (combined items) [taxlowsc/taxhisc] | 0.53 | |
| It is the responsibility of the government to reduce the differences in income [govresp7] | 0.32 | 0.58 |
| Government should redistribute income from the better-off to those who are least well-off [redistrb] | 0.18 | 0.65 |
| Correlation coefficient between factors (95% CI) | 0.19 [0.10, 0.29] | |
| Standardized root mean squared residual assuming 2 dimensions (shown) | 0.075 | |
| Standardized root mean squared residual assuming 1 dimension | 0.171 | |
| Sample size | 658 | |
Notes: Results are based on a confirmatory factor analysis; final model relaxes the assumption that policy items load on one dimension only.
Best practice, when testing for the existence of a latent structure using survey data, is to divide the sample in two and run an exploratory factor analysis (EFA) on the first half of the dataset and a confirmatory factor analysis (CFA) on the second half. I use the EFA to test the plausibility of a unidimensional versus a multidimensional factor solution. By letting all survey items freely load on any latent factors in the data, an EFA provides information on whether interitem correlations are larger for distinct subset of items. To improve the interpretation of factor loadings, an EFA imposes structure on the relationship between the latent factors.Footnote 17 Switching to a CFA provides a more reliable estimate of the correlations between latent factors. Indeed, in contrast to EFA, CFA imposes constraints on the factor loadings, allowing to freely estimate the correlation between latent factors (Costello and Osborne Reference Costello and Osborne2005; Matsunaga Reference Matsunaga2010). In other words, an EFA tells us which items “go together” and to what extent, while a CFA tells us whether the latent factors underpinning each cluster of items are meaningfully correlated or not.Footnote 18
Table 10.1 presents the results from the CFA (for EFA results, see Cavaillé, 2023). They indicate that the two-dimensional conceptualization of fairness reasoning and demand for redistribution sketched in Figure 10.3 better explains the correlation patterns found in the BSAS than the unidimensional conceptualization sketched in Figure 10.2. Indeed, the estimation returns a correlation coefficient of 0.19. Furthermore, when analyzing earlier waves, I cannot reject the null that the two dimensions are orthogonal to each other (see Cavaillé Reference Cavaillé2023). Policy items load in expected ways. First, questions about transfers to the poor and the unemployed load more strongly on the same latent dimension as reciprocity beliefs items. Second, items asking about taxes load on the same latent dimension as proportionality beliefs items.
Interestingly, attitudes toward income redistribution as traditionally measured most strongly load on this second latent dimension, implying that answers to this item are best explained by differences in proportionality beliefs, not differences in reciprocity beliefs. In other words, and against common expectations in political economy, answers to the traditional redistribution item appear only weakly correlated with beliefs about the work ethic of net beneficiaries of redistribution: support for redistribution measured in this fashion is best interpreted as support for redistribution from policies, not redistribution to policies.
As previously mentioned, data limitations preclude me from running the same analysis in countries beyond Great Britain. As a result, I focus on testing empirical expectations adapted to the available data. In 2008 and 2016, the ESS included a battery of items similar to the ones used in the British analysis to measure reciprocity beliefs (listed in Table 10.2). Both waves of the ESS also included a version of the traditional redistribution question worded as follows: “The government should take measures to reduce differences in income levels. Agree/disagree?” I examine whether, as found in the BSAS, knowing what someone thinks about the prevalence of free riding among welfare recipients says little about their agreement with the claim that the government should redistribute income from the most to the least worse off.
Table 10.2 Reciprocity beliefs: factor loadings
| Item wording | ESS 2008 | ESS 2016 |
|---|---|---|
| Beliefs about the ubiquity of shirking | ||
| Most unemployed people do not really try to find a job | 0.54 | 0.65 |
| Many manage to obtain benefits/services not entitled to | 0.40 | 0.49 |
| Employees often pretend they are sick to stay at home | 0.47 | NA |
| Beliefs about the disincentive effects of social benefits | ||
| Social benefits/services make people lazy | 0.77 | 0.80 |
| Social benefits/services make people less willing to look after themselves/family | 0.80 | NA |
| Social benefits/services make people less willing to care for one another | 0.79 | 0.71 |
| Redistribution to policies | ||
| Role of government to ensure a reasonable standard of living for the unemployed? | 0.34 | 0.28 |
| Eigenvalue | 2.65 | 1.91 |
Notes: Exploratory factor analysis on the pooled data using a polychoric correlation matrix adapted to ordinal variables. Extracted method: iterated principal factor method, robust to using other extraction methods. Countries included in the analysis are GB, FR, IE, BE, PT, DE, NL, CH, NO, AT, ES, FI, DK, SE, GR, as well as EE, HU, PL, SI, SK, CZ. The latter countries were included because they are market economies with large welfare states. Note however, that given half a century of Soviet occupation, the results for these countries should be analyzed with caution.
To do so, I use items listed in Table 10.2 to compute individual factor scores that rank respondents according to how prevalent (and concerning) they believe free riding to be.Footnote 19 Table 10.3 (top panel) reports the predicted probability of disagreeing with the principle of income redistribution for a hypothetical individual with a reciprocity belief score equal to the 10th and 90th percentile of scores in her country. I repeat this analysis using the 2016 data, results are presented in the bottom panel of Table 10.3. In most countries and in both waves, moving from the 10th to the 90th percentile on the reciprocity scores says little about one’s level of opposition to income redistribution as traditionally measured. There is one notable exception to this pattern, Sweden, with a differential equal to 23 percentage points for the year 2016. Additional analysis seems to indicate that, in Sweden, the correlation between the two latent dimensions is likely higher than in other countries (Cavaillé and Trump 2015).
Table 10.3 Opposition to redistribution is not predicted by reciprocity beliefs
| Probability of not agreeing that gov’t should redistribute | |||
|---|---|---|---|
| Fair – free riding not a concern (10th percentile) | Unfair – Too much free riding (90th percentile) | Delta | |
| 2008 | |||
| France | 0.20 | 0.21 | 0.01 |
| Germany | 0.31 | 0.38 | 0.06 |
| Sweden | 0.29 | 0.45 | 0.16 |
| Denmark | 0.50 | 0.65 | 0.16 |
| Netherlands | 0.42 | 0.48 | 0.06 |
| Great Britain | 0.39 | 0.43 | 0.04 |
| Spain | 0.20 | 0.20 | 0.00 |
| Poland | 0.21 | 0.28 | 0.07 |
| 2016 | |||
| France | 0.24 | 0.25 | 0.01 |
| Germany | 0.23 | 0.32 | 0.09 |
| Sweden | 0.26 | 0.49 | 0.23 |
| Denmark | NA | NA | NA |
| Netherlands | 0.34 | 0.46 | 0.11 |
| Great Britain | 0.29 | 0.41 | 0.12 |
| Spain | 0.10 | 0.22 | 0.13 |
| Poland | 0.24 | 0.32 | 0.08 |
Notes: People who agree and strongly agree that the government should redistribute income are coded as 0. Other response categories are coded as 1.
Country-Level Analysis
Moving from the individual to the country level, I combine data from the ESS survey of 2008 and the ISSP survey of 2009 to examine country differences in fairness beliefs and policy preferences. First, a few words on the ISSP items, which are listed in Table 10.4. The first measurement item combines answers to a set of questions asking about the perceived and preferred income of a fixed set of occupations. Specifically, I regress items capturing preferred income (what ought to be) over items capturing perceived income (what is). The resulting regression coefficient is equal to 1 if a respondent believes that existing income differences align with their preferred income differences. The closer the coefficient is to zero, the more the respondents believe that existing income differences (as they perceive them) deviate from their preferred benchmark. In other words, this item measures perceived dissatisfaction-satisfaction with existing income differences. The second item captures the extent to which people think blue-collar workers are underpaid. I focus on this occupation as embodying the quintessential hardworking individual: respondents who believe that this individual is underpaid are less likely to believe that effort alone is enough.Footnote 20 The third item is a dummy variable equal to 1 if a respondent perceives the society she lives in as highly unequal, that is, a few rich at the top and most people at the bottom. Items 4 and 5 directly ask about inequality, while items 6 and 7 ask about the role of wealth and effort to get ahead in the country respondents live in. Item 8 is the ISSP’s version of the traditional redistribution item, while item 9 asks about support for more progressive taxation.
Table 10.4 Proportionality beliefs and “redistribution from”: factor loadings
| 2009 | 1999 | |
|---|---|---|
| 1. Labor income: IS versus OUGHT | 0.37 | 0.31 |
| 2. Blue-collar worker income: IS versus OUGHT | 0.42 | 0.40 |
| 3. Shape of society | 0.46 | 0.50 |
| 4. Income differences are too large | 0.77 | 0.78 |
| 5. Inequality continues to exist because it benefits the rich and powerful | NA | 0.51 |
| 6. Wealth important to get ahead | 0.24 | 0.21 |
| 7. Effort important to get ahead | 0.13 | NA |
| 8. Government should reduce income differences | 0.74 | 0.76 |
| 9. People with high income pay more taxes than people with low income | 0.45 | 0.55 |
| Eigenvalue | 1.97 | 2.30 |
Notes: Exploratory factor analysis on the pooled data using a polychoric correlation matrix adapted to ordinal variables. Extracted method: iterated principal factor method, robust to using other extraction methods. Note the small factor loading on items 6 and 7, items which are often used in the “does effort pay?” literature.
Table 10.4 includes factor loadings from an EFA on the pooled data: all items load on the same latent factor. I also repeat the analysis on the 1999 wave of the ISSP, which includes many of the same items.Footnote 21 I use these items to compute factor scores that measure individual differences in how much people find income differences unfair (fair) and support (oppose) redistribution. I then aggregate these scores at the country level.
Figure 10.4 compares country averages computed using the 2009 wave with country averages computed using the 1999 wave. The correlation between the 1999 country averages and the 2009 averages is 0.90 (N = 13). Figure 10.4 also includes the same analysis using the 2008 and 2016 waves of the ESS. Specifically, I use the items in Table 10.4 to compute factor scores measuring individual differences in the extent to which people believe the unemployed and the poor are free riding and oppose transfers that benefit this group. In this case, the correlation between the two waves is 0.86 (N = 19). Fairness beliefs appear to be a stable component of a country’s attitudinal landscape.
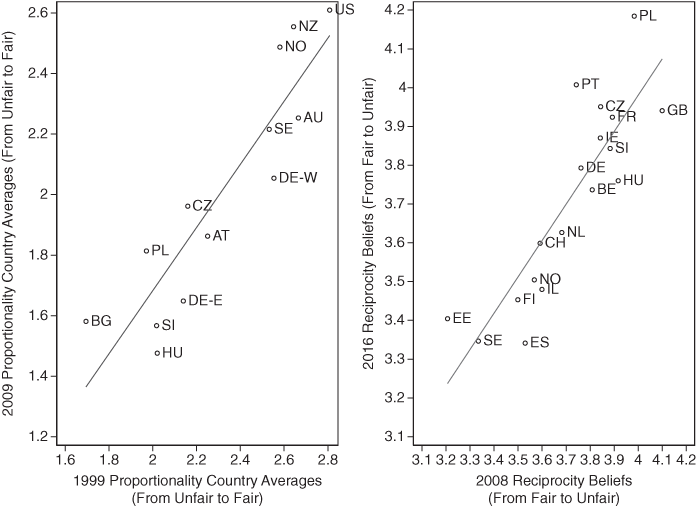
Figure 10.4 Changes in fairness beliefs
Note: See text for more detail on the measures.
Figure 10.5 combines the 2008 wave of the ESS and the 2009 wave of the ISSP. Note that the ESS does not include the United States. To place this country with regards to the reciprocity norm, I have relied on data collected independently by Clem Brooks and available in Svallfors (Reference Svallfors and Svallfors2012). Brooks’ results show that response patterns in the United States are similar to those found in Great Britain. Overall, very few countries align along the traditional left-right axis (from the bottom-left to the top-right), which runs from consistently pro-redistribution beliefs (fair according to reciprocity, unfair according to proportionality) to consistently antiredistribution beliefs (unfair according to reciprocity, fair according to proportionality). If anything, the key axis appears to be one running from fair to unfair according to both norms.
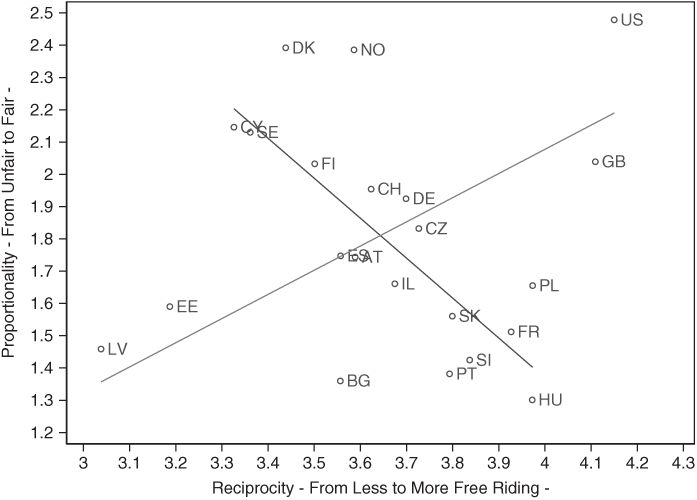
Figure 10.5 Correlation between proportionality and reciprocity beliefs
Notes: See text for more detail on the measures. Note that the US score on the X-axis is approximated using Svallfors (Reference Svallfors and Svallfors2012).
Given the imperfection of available items, the country-level evidence remains tentative. Nevertheless, it highlights the limits of existing approaches to fairness reasoning as well as the benefits of the two-dimensional framework. First, notice how, despite very different institutional setups, Denmark, Norway, and the United States are in the same ballpark when it comes to proportionality beliefs. Scandinavians find their economic system fair and rightly so: mobility rates are much higher and differences in market income lower. As a result, in these countries, support for income redistribution, as traditionally measured, is often lower than one might expect. In Denmark, for example, agreement with the traditional redistribution item was a low 55 percent, compared to a high 90 percent in Portugal. Where Scandinavian countries differ from the United States is in terms of their reciprocity beliefs: they express high trust and comparatively much lower concerns about free riding and moral hazard. In contrast, the United States (and Great Britain) are much more likely to perceive unemployed workers as undeserving and be concerned about shirking. There is a similar split among countries that find the economic system and income inequality unfair. France and most postcommunist countries are closer to the United States and Great Britain than to Scandinavian countries in terms of their level of concern about free riding. The exceptions are Baltic countries who appear satisfied with how welfare spending is disbursed in their country.
Overall, the two-dimensional structure found at the individual level is also found at the country level, echoing the ideal-typical setup sketched in Figure 10.3 (right panel). Jointly, the individual- and country-level evidence demonstrates that the conceptualization of fairness presented in this chapter provides a better fit to the available survey data than existing work on fairness reasoning. In the concluding section, I discuss implications for studying the relationship between income inequality and attitudes toward redistributive policies.
Implications for Policy Change in the Age of Inequality
I have argued that in Western societies with mature welfare states, there exist, to paraphrase Michael Walzer, distinct “spheres” of fairness, each with their own social good and distributive principle (Walzer Reference Walzer1983). The “economy” and “markets” produce one type of good – market income – whose allocation is, at least partly, regulated (and contested) through the proportionality principle. “Society,” through the “welfare state,” pools resources to produce a second type of good – social insurance in the form of social benefits – whose allocation is, at least partly, regulated through the reciprocity principle. The existence of a shared understanding of what constitutes fair inequality and fair social solidarity (i.e., shared norms of fairness) helps regulate envy, minimize resentment, and promote consensual resource sharing. When fairness beliefs, policy preferences, and existing institutional arrangements complement each other, then the system is in equilibrium. On the policy side, this means that fairness beliefs constrain the types of policy reforms that get implemented: those that do not “fit” existing fairness beliefs tend to fail. On the mass opinion side, changes in aggregate preferences should be limited to small fluctuations around a stable mean. What evidence do we have for this?
With regards to policy reforms, one interesting case is that of flexicurity, a type of policy reform first promoted in Scandinavian countries and heralded as the ideal combination of market efficiency and social solidarity. Based on Figure 10.5, Scandinavian countries’ combination of fairness beliefs appears particularly hospitable to such reform: the belief that effort pays underpins support for proactive labor market policy, while the belief that abuse of social spending and free riding is the exception, not the norm, underpins support for generous social insurance. Now imagine trying to advocate for such reforms in a country like France, which holds the exact opposite beliefs: these reforms are likely to poll poorly. A combination of vocal opposition from those directly affected by the reform and bad polling will be enough to block proposed reform packages. This has indeed been a recurrent pattern in France since the mid-1990s. France, which taxes high incomes and regulates the market based on the belief that effort does not pay, appears to be less enthusiastic about deepening the redistributive features of social insurance. While there have been no dramatic welfare cuts in France, this might nevertheless preclude welfare reforms that seek to better meet the needs of the growing contingent of labor market “outsiders” (Emmenegger et al. Reference Emmenegger, Häusermann, Palier and Seeleib-Kaiser2011; Rueda Reference Rueda2007; Saint-Paul Reference Saint-Paul1999).
With regards to public opinion, in line with expectations, stability is the norm and change is the exception. Indeed, as shown by Kenworthy and McCall, while aggregate social policy preferences vary across countries, they do not vary nearly as much over time (Kenworthy Reference Kenworthy2009; Kenworthy and McCall 2008; McCall and Kenworthy Reference Kenworthy2009; see also Svallfors Reference Svallfors and Pierre2016). These patterns, in line with the hypothesis of fairness reasoning as the manifestation of an order producing social technology, align with the hypothesized existence of self-reinforcing equilibria.
This suggests a key role for fairness reasoning in explaining the disconnect between rising inequality and support for redistribution (specifically, the redistribution from a subset of redistributive policies that interfere with the accumulation of market income among the better off). For most people, income inequality is an abstract reality, meaningful only through the lenses of fairness reasoning and prior proportionality beliefs. At the individual level, stable proportionality beliefs introduce a disconnect between changes in inequality and mass perceptions of these changes. At the aggregate level, only a subset of the population (the one that already finds market income unfair) will experience a rise in income inequality as something that needs to be addressed. Ultimately, countries with institutions most favorable (unfavorable) to an increase in income inequality are also those most likely to have a larger share of the population that believes that income inequality is fair (unfair) and are less likely to increase their support for policies that interfere with this distribution (Bénabou and Tirole Reference Bénabou and Tirole2006).
This argument presented in this chapter also has implications for research on demand for redistribution broadly defined.Footnote 22 For example, studies that focus on information about inequality as the missing link in the causal chain connecting inequality to demand for redistribution (e.g., Matthews et al., this volume) assume a very specific distribution of fairness beliefs, one in which the median voter finds the status quo unfair, as defined by the proportionality norm. Only then can we expect more information on rising income inequality to translate into a growing demand for more egalitarian policies. However, whether or not a majority perceives income inequality as a violation of the proportionality norm is something to be explained, not assumed.
Researchers should also revisit expectations that disruptive events such as an economic recession or a pandemic have implications for mass policy preferences. Absent ideal conditions, the expectation should be that mass attitudes will not be affected by such events. Instead of puzzling over “too much” stability, researchers might choose to focus their efforts on theorizing what such “ideal conditions” for change might look like. One recent example is given by Scheve and Stasavage (Reference Scheve and Stasavage2016). Change, they argue, happens as a result of a unique “shock” (i.e., total warfare) and political entrepreneurs finding the correct fairness appeal to present policy innovations as both necessary and fair. Total warfare constitutes a social dilemma: citizens’ individual interest is to defect, at the expense of the collective. In line with the reciprocity principle, their willingness to contribute their blood to the war effort is conditional on the belief that everyone is engaged in a similar sacrifice, that is, nobody is free riding (Levi Reference Levi1991). In such a context, large economic profits are perceived to violate the reciprocity norm: they reflect an actors’ selfish economic gains at the expense of the collective (ultimate) sacrifice. According to Scheve and Stavasage, the ability to (temporarily) frame high-income earners as war profiteers who violate the reciprocity norm helps explain why some countries were able to introduce wealth taxation while others were not. In other words, total warfare opens the door to a new type of critique of high-income individuals as profiteers abusing the joint effort. When mobilized by political actors, this fairness language finds echo in people’s personal experiences of hardship and sacrifice.
This chapter considers the role of economic information in generating political inequality across income groups. Income inequality across many advanced democracies has risen sharply over the last four decades (Lupu and Pontusson, this volume). Not only have market incomes become increasingly concentrated among the very rich in a wide range of national contexts; so, too, have posttax-and-transfer incomes. In other words, many elected governments, notwithstanding the formidable range of market-shaping and redistributive policy instruments at their disposal, have over an extended period of time allowed a narrow and extremely affluent segment of the population to reap a further outsized share of the fruits of economic growth. How has this happened? What has allowed inequalities in material resources to mount in political systems that, nominally, distribute votes equally across adult citizens? Why have basic mechanisms of electoral accountability not induced governments to pursue economic and social policies that better serve the distributional interests of the vast majority of the electorate?
While scholars have identified a wide range of causes of political inequality in advanced democracies (many of them the focus of other chapters of this volume), our focus is on an examination of a key informational prism through which voters learn about the state of the economy: the news media. A vast literature points to the strong influence of citizens’ evaluations of the economy on their votes (e.g., Duch and Stevenson Reference Duch and Stevenson2008; Lewis-Beck Reference Lewis-Beck1988). Meanwhile, a substantial body of evidence highlights the powerful role that the news media play in informing citizens’ economic evaluations (Blood and Phillips Reference Blood and Phillips1995; De Boef and Kellstedt Reference De Boef and Kellstedt2004; Boydstun, Highton, and Linn Reference Boydstun, Highton and Linn2018; Garz and Martin Reference Garz and Martin2021; Goidel et al. Reference Goidel, Procopio, Terrell and Denis Wu2010; Hollanders and Vliegenthart Reference Hollanders and Vliegenthart2011; Mutz Reference Mutz1992; Nadeau, Niemi, and Amato Reference Nadeau, Niemi and Amato1999).
Building on our own prior work on the United States (Jacobs et al. Reference Jacobs, Scott Matthews, Hicks and Merkley2021) and presenting a set of new cross-national analyses, we investigate how journalistic depictions of the economy relate to real distributional developments. In particular, we ask: when the news media report “good” or “bad” economic news, whose material welfare are they capturing? How does the positivity and negativity of the economic news track income gains and losses at different points along the income spectrum?
Using sentiment analysis of vast troves of economic news content from a broad set of advanced democracies (drawing on data from Kayser and Peress Reference Kayser and Peress2021), we demonstrate that the evaluative content of the economic news strongly and disproportionately tracks the fortunes of the very rich. Although we observe somewhat more news responsiveness to the welfare of the middle class in this cross-national sample than we did in our earlier US study, the pro-rich skew in economic news observed in other advanced democracies is highly comparable to that found in the United States. To the extent that economic news shapes citizens’ economic evaluations and that evaluations of the economy shape votes, we thus have in hand at least a partial potential explanation of why mechanisms of electoral accountability have failed to deliver more equal economic outcomes.
And yet the finding of class-biased economic news raises one further puzzle: why does economic news content appear to overrespond to gains and losses for the rich? We review a range of potential explanations drawn from the existing media studies literature, most of which posit a set of interests or preferences among news owners, producers, sources, or consumers that lead inexorably to a pro-rich bias in economic reporting.
We then propose an alternative account, arguing that pro-rich biases in news tone could arise from routines of economic reporting in which journalists aim to capture the performance of the economy in the aggregate while paying minimal attention to distributive matters. In this model, the class bias in news content need not arise from a set of pro-rich interests within the news sector, but from the workings of the economy itself: from the fact that, in most capitalist democracies, aggregate expansion and contraction over the last forty years have been positively and disproportionately correlated with the rise and fall, respectively, of the incomes of the very rich. Thus, a news media that seeks merely to cover the ups and downs of the business cycle will generate news that, implicitly, tracks the fortunes of the most affluent. Voters will tend to read “good” economic news in those periods when inequality is rising and “bad” economic news as disparities shrink. We test key predictions of this theory on a large sample of news content from a broad range of OECD contexts, finding that movements in GDP growth, unemployment, and share valuations explain most of the association between news tone and relative gains for the very rich. In addition, we show that pro-rich bias in the economic news is relatively uniform across outlets with varying partisan slants, suggesting that these biases arise at least in part from sources other than journalists’ or owners’ economic preferences.
In sum, the analyses that we present in this chapter suggest that the democratic politics of inequality may be shaped in important ways by the skewed nature of the informational environment within which citizens form economic evaluations. Moreover, this informational skew appears to be in part a product of the underlying structure of the economy itself. In an economy that distributed aggregate economic gains relatively equally, journalists and voters alike could fairly well assess the changing welfare of the typical household simply by following the ups and downs of the business cycle. In a political economy that generates systematically biased distributions of the fruits of growth, however, the informational demands of our normative model of democratic accountability are steeper, and there is reason to worry that the news media are not currently meeting those demands.
The Economic-Inequality Puzzle
A substantial share of advanced democracies has witnessed rising inequality in posttax-and-transfer income over the last four decades. We illustrate the pattern in Figure 11.1, where we plot change over time (1980–2014) in the posttax-and-transfer income share of the richest 1 percent of individuals for nineteen advanced democracies, grouping countries approximately by welfare-state-regime type (see “Data” for information on data sources). We see that top-income shares, after taxes and transfers, have risen considerably across most of these countries: most steeply in countries with liberal welfare states; somewhat less so, but still markedly in social democracies; and more modestly but nontrivially in continental, corporatist settings. In Southern Europe, we see top-income shares holding about steady over this period (see also Lupu and Pontusson, this volume).
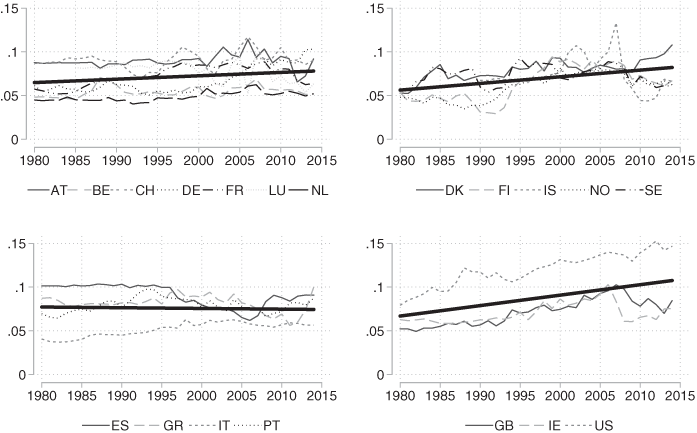
Figure 11.1 Posttax-and-transfer income share of the top 1 percent of individuals for nineteen advanced democracies
Note: Thick black lines are overtime trends based on pooled OLS regressions.
Governments in these nations have had opportunities to shape the allocation of households’ consumption possibilities at multiple stages. A range of “predistributive” policies can influence the allocation of income derived from labor and capital, while tax rules and social welfare systems can, and to varying degrees do, compensate for market-driven disparities. Given the powerful tools at the state’s disposal for influencing final distributional outcomes, those countries in which disposable income (and wealth) have become increasingly concentrated among the very rich represent a puzzle: how have political systems that are nominally governed under the principle of political equality failed to generate more egalitarian outcomes?
Explanations for rising postgovernment inequality (or, similarly, for the incompleteness of compensatory redistribution) abound, and many are considered in this volume. We can distinguish between two broad lines of explanation. One such line emphasizes political inequality, or differentials in influence wielded by the rich and the nonrich: the nonrich might want more equal outcomes, but their demands lose out in the political sphere to those of the most affluent (e.g., Giger, Rosset, and Bernauer Reference Giger, Rosset and Bernauer2012; Gilens Reference Gilens2012; Hacker and Pierson Reference Hacker and Pierson2011, Reference Hacker and Pierson2020; Peters and Ensink Reference Peters and Ensink2015; Bartels, this volume; Mathisen et al., this volume).
A second line of explanation focuses on the “demand side” of the political dynamic and, in particular, on the attitudes and political behavior of the nonrich.Footnote 1 We can usefully think of demand-side research on the politics of inequality as coming in two varieties. A majority of demand-side scholarship has focused on citizens’ policy preferences, such as their level of support for redistribution (e.g., Cavaillé, this volume; Cavaillé and Trump 2015; Cramer, this volume; Fong Reference Fong2001; Kenworthy and McCall Reference Kenworthy and McCall2007; Lupu and Pontusson Reference Lupu and Pontusson2011). If we aim to explain elected governments’ distributional policy choices, then citizens’ attitudes toward those policy choices is a perfectly reasonable place to start.
At the end of the day, however, incumbents in a democracy who wish to remain in office must win elections, a goal that may depend only weakly on their distributive policies. Voters typically lack strong preferences on all but the most salient policy controversies (Converse Reference Converse2006, Reference Converse and Apter1964; Tesler Reference Tesler2015) and, in the absence of specific views, may be inclined to adopt the positions of candidates who are favored for reasons unrelated to their policy commitments (Lenz Reference Lenz2012; but see Matthews Reference Matthews2019). When distributional issues do meaningfully influence vote choice, furthermore, that influence may be swamped by other considerations.
On the other hand, among the best-established regularities uncovered in decades of research on electoral behavior is that voters’ choices are strongly influenced by economic outcomes, or, at least, by voters’ assessments of those outcomes (e.g., Duch and Stevenson Reference Duch and Stevenson2008; Lewis-Beck Reference Lewis-Beck1988). A second line of demand-side inquiry has begun to examine how economic voting interacts with the politics of distribution, asking how electorates respond to different distributions of economic gains and losses. This line of research is motivated by a baseline, normative notion of how economic voting might work: we might in principle expect nonrich members of the electorate to defend their economic interests at the ballot box by voting out governments that oversee patterns of (income) growth that concentrate gains at the very top and rewarding incumbents that spread gains broadly. Even in the absence of conscious demands for redistribution, electoral dynamics should serve as a brake on rising material inequality if citizens cast their economic votes in distributionally sensitive ways, in ways that align in some way with their income stratum’s distributional economic interests. Do they?
The answers we have so far suggest that electorates respond to distributional outcomes in a manner directly at odds with this normative model. Not only do nonrich voters appear not to vote their distributional interests, but patterns of economic voting may play a substantial role in incentivizing governments to concentrate economic gains at the top. Studying presidential elections from 1952 to 2012, Bartels (Reference Bartels2016) finds that incumbent parties in the United States perform better in election years with higher rates of income growth at the 95th percentile, conditional on mean income growth. In other words, for any given level of per capita income growth, incumbent parties receive an electoral premium when a higher share of that growth flows to the family at the 95th income percentile. At the same time, the US presidential electorate as a whole appears unresponsive to mean income growth after taking into account income growth at the top. Moreover, and most puzzlingly, this broad pattern – which Bartels (Reference Bartels2016) terms “class-biased economic voting” – holds specifically for voters in the bottom third and in the middle third of the income distribution. Lower-income voters appear to respond favorably to top-income growth conditional on mean growth, but not at all to mean growth conditional on top-end growth. And while middle-income voters show some responsiveness to mean income growth, they are about twice as responsive to top-income growth.
In an extension of Bartels’ work, we find clear evidence of the operation of class-biased economic voting in a broader comparative context (Hicks, Jacobs, and Matthews Reference Hicks, Jacobs and Scott Matthews2016). Analyzing individual-level election-study data, for instance, we find that lower- and middle-income voters in Sweden and the United Kingdom vote for the incumbent party at higher rates as income growth for the richest 5 percent rises for any given level of mean growth, and appear unmoved by income growth for the bottom 95 percent.Footnote 2 Further, analysis of aggregate election data for 200 postwar elections across fifteen OECD countries reveals a substantial average reward to the incumbent party for overseeing rising income shares for the top 5 percent. And, as in the United States, OECD electorates on average fail to reward governing parties for the portion of mean income growth that does not flow to the top.
In short, what we know about the relationship between distributional dynamics and electoral patterns suggests a serious empirical problem with a normative model in which voters defend their (income groups’) economic interests at the ballot box. What we seem to be seeing is not the absence of economic voting but a distributionally perverse form of it. The observed patterns suggest the operation of one or more mechanisms that do more than prevent citizens from casting economic votes in distributionally sensitive ways; they seem to turn distributional self-interest on its head.
In the remainder of this chapter, we focus on a mechanism that plausibly intervenes in critical ways between the economy and voter evaluations: the news media. A substantial body of evidence highlights the powerful role that the news media plays in informing citizens’ economic evaluations (Blood and Phillips Reference Blood and Phillips1995; Boydstun, Highton, and Linn Reference Boydstun, Highton and Linn2018; De Boef and Kellstedt Reference De Boef and Kellstedt2004; Garz and Martin Reference Garz and Martin2021; Goidel et al. Reference Goidel, Procopio, Terrell and Denis Wu2010; Hollanders and Vliegenthart Reference Hollanders and Vliegenthart2011; Mutz Reference Mutz1992; Nadeau, Niemi, and Amato Reference Nadeau, Niemi and Amato1999). A key question, then, is how economic news coverage itself relates to objective distributional dynamics in the economy. If the economic news disproportionately reflects the economic experiences of the very rich, then nonrich voters will be operating in an informational environment that is, in an important sense, systematically skewed against their own material interests. In the section that follows, we consider reasons why the economic news in advanced capitalist democracies might tend to be biased in favor of the interests of the most affluent.
Potential Preference- or Interest-Based Sources of Class-Biased Economic News
It is not difficult to imagine reasons why major news outlets might cover the economy in ways that favor the interests of the rich. One possible source of such bias might be the general economic interests of media owners. Since the owners of news outlets tend to be either large corporations or very rich families (Grisold and Preston Reference Grisold and Preston2020; Herman and Chomsky Reference Herman and Chomsky1994), they share an interest in rising concentrations of income and wealth at the top. Moreover, news outlets depend on revenue from advertisers, who themselves may have an interest in policies that promote or permit higher inequality. To the extent that owners and advertisers can influence content, the result may be economic coverage that systematically favors the interests of wealthy households and corporations (for a formalization, see Petrova Reference Petrova2008; though see also Bailard Reference Bailard2016; Gilens and Hertzman Reference Gilens and Hertzman2000: 371).
A further potential source of class bias in economic reporting might arise from the upper-middle-class composition and elite educational background of most members of the journalism profession (e.g., Gans Reference Gans2004, 124–138; Weaver, Willnat, and Wilhoit Reference Weaver, Willnat and Cleveland Wilhoit2019). Journalists’ interpretation of economic events may be shaped directly by their class interests, and their involvement in upper-middle-class social networks might shape the kind of information about the economy to which they are exposed and, in turn, their beliefs about which economic topics are newsworthy.
On a related note, bias in economic-news content might derive from the skewed perspective of the sources on whom journalists routinely rely when reporting on the economy. As numerous studies have documented, economic reporters looking for commentary and analysis tend to turn disproportionately to elites with close ties to the business community and finance (Call et al. Reference Call, Emett, Maksymov and Sharp2018; Davis Reference Davis2002, Reference Davis, Basu, Schifferes and Knowles2018; Knowles Reference Knowles, Basu, Schifferes and Knowles2018; Knowles, Phillips, and Lidberg Reference Knowles, Phillips and Lidberg2017; Wren-Lewis Reference Wren-Lewis, Basu, Schifferes and Knowles2018). Dependence on economic-elite and corporate sources might tend to generate coverage that systematically privileges the interests of firms, financial institutions, and investors and that is skeptical of state intervention to redress inequality.
Independently of owners’, reporters’, or sources’ interests and outlooks, readers of economic news may themselves tend to be more affluent than the general population (Davis Reference Davis, Basu, Schifferes and Knowles2018) and prefer content that reflects their material interests. Gentzkow and Shapiro (Reference Gentzkow and Shapiro2010) find suggestive evidence of the effects of audience partisanship on editorial content in the United States, while Beckers et al. (Reference Beckers, Walgrave, Valerie Wolf, Lamot and Van Aelst2021) find that Belgian journalists overestimate the conservatism of the general public, a perception that might dampen any focus on inequality and boost attentiveness to outcomes aligned with the interests of the rich.
A further possibility is that, in many OECD contexts since the 1970s, economic reporting as a whole has been influenced by a general, rightward ideological shift in the political sphere, especially the ascendance of free-market ideas (Davis Reference Davis, Basu, Schifferes and Knowles2018; DiMaggio Reference DiMaggio2017; Schifferes and Knowles Reference Schifferes, Knowles, Basu, Schifferes and Knowles2018). Cutting against this view, however, is evidence that journalistic opinion (e.g., Rothman and Lichter Reference Rothman and Robert Lichter1985) and use of sources (Groseclose and Milyo Reference Groseclose and Milyo2005) reflect a left-wing bias (though see Nyhan Reference Nyhan2012) and findings of considerable ideological variation in news outlets’ economic content (Arrese Reference Arrese, Basu, Schifferes and Knowles2018; Barnes and Hicks Reference Barnes and Hicks2018; Larcinese, Puglisi, and Snyder Reference Larcinese, Puglisi and Snyder2011).
A Theory of News Bias Independent of Preferences: Covering the Business Cycle
While the material interests and ideological preferences of those who produce, inform, or consume the news might all serve to skew journalistic portrayals of the economy, we will argue that a pro-rich tilt in the economic news can readily emerge from a process in which news outlets seek to do nothing more than faithfully report on the aggregate state of the economy – depending on how the economy itself operates. If journalists seek to assess overall economic performance but economic growth itself is associated with greater relative gains for the rich, then media evaluations of the economy will tend to most closely track the welfare of the rich, even in the absence of pro-rich preferences among media actors themselves.
To be clear, the argument that follows is not a case against the view that ideological or interest-based biases shape economic news coverage. What we seek to elucidate in this section is how features of the economy itself, together with a set of facially neutral journalistic operating routines, could themselves be sufficient to generate bias before the worldviews or class interests of news producers even enter into the equation.Footnote 3
A Focus on Economic Aggregates
We begin by positing the operation among journalists of an understanding – a “mental model” – of the economy that treats the promotion of aggregate expansion as the central, if not exclusive, objective of economic management. In his classic study of American newsrooms, Gans (Reference Gans2004) finds that “responsible capitalism” is among the core values of American journalism and that, in economic reporting, “[e]conomic growth is always a positive phenomenon” (p. 46). Thomas’ (Reference Thomas, Basu, Schifferes and Knowles2018) analysis of British TV news during the postfinancial-crisis recovery similarly finds that economic growth was depicted as an unalloyed good, while Davis (Reference Davis, Basu, Schifferes and Knowles2018) reports that British economic reporting largely “focuses on a series of headline macroeconomic indicators,” including GDP growth and unemployment (p. 165). “Good” and “bad” economic news, then, are defined by developments that signal or reflect an upturn or a downturn, respectively, in the business cycle – especially in output and its close correlate, employment.
In this framework, moreover, distributional questions as such are generally not salient, on the assumption that the benefits of economic growth are typically broadly distributed, with rampant rent-seeking by economically privileged actors rare. As Gans writes of TV news in the United States, journalists display “an optimistic faith that in the good society, businessmen and [business]women will compete with each other in order to create prosperity for all, but that they will refrain from unreasonable profits and gross exploitation of workers or customers.” Along just these lines, in their study of coverage of the Bush tax cuts in the United States, Bell and Entman (Reference Bell and Entman2011) find that news stories emphasized their potential effects on growth, while neglecting their likely impact on inequality.
Aggregate Growth and Distribution
How might a journalistic focus on economic aggregates generate a class bias in economic news? In principle, it need not. Where economic gains and losses were equally distributed, a journalistic focus on the business cycle would generate news that is equally sensitive to the fortunes of all income groups. However, that will cease to be the case in any context in which aggregate income growth is systematically skewed in favor of the most affluent. In particular, if economic growth, its drivers, or its presumed proxies (such as corporate performance) tend to generate higher concentrations of income at the top, then journalists who “cover the business cycle” will, without necessarily intending to, generate portraits of the economy that systematically and disproportionately track the fortunes of the rich.
In Figure 11.2, we plot the post-1980 correlation between the annual rate of GDP growth and annual change in top-1 percent pretax income shares for a broad set of countries, with the pre-1980 correlation plotted where data are available (see “Data” for information on data sources). As we can see, since 1980, there is clear evidence of cyclicality of top-income shares in more than half of the countries in this sample. Put differently, it is incomes at the top that most closely track the business cycle: that grow fastest during periods of aggregate growth and fall most rapidly in recessions. We also note that the group of countries featuring cyclical inequality represents a wide range of political economies, from liberal market economies like Britain, the United States, and Canada to most of the coordinated market economies of Scandinavia. While pre-1980 data are missing for some countries, we also see considerable evidence, on balance, of increasing cyclicality over time.
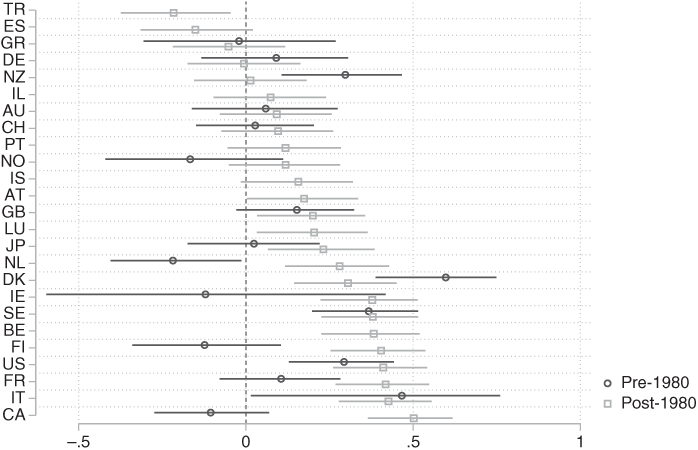
Figure 11.2 Correlation between the annual rate of GDP growth and annual change in top-1-percent pretax income shares for a broad set of countries, before and after 1980
Notes: Quarterly observations. Pre-1980 observations unavailable for certain countries.
In Figure 11.3, we turn to another oft-reported economic aggregate, the unemployment rate. The figure plots the correlation of annual change in the unemployment rate with annual change in top pretax income shares for all advanced democracies for which consistent data were available, pre- and post-1980. While unemployment is commonly understood to weaken the bargaining power of labor vis-à-vis capital, we see that change in the unemployment rate has more often been negatively correlated with income concentration at the top, meaning that years with falling unemployment have tended to be years of growing top-income shares – or in which top incomes grow faster than incomes of the nonrich. This is, again, the case for a diverse set of political economies, including the United States, Denmark, and France.Footnote 4
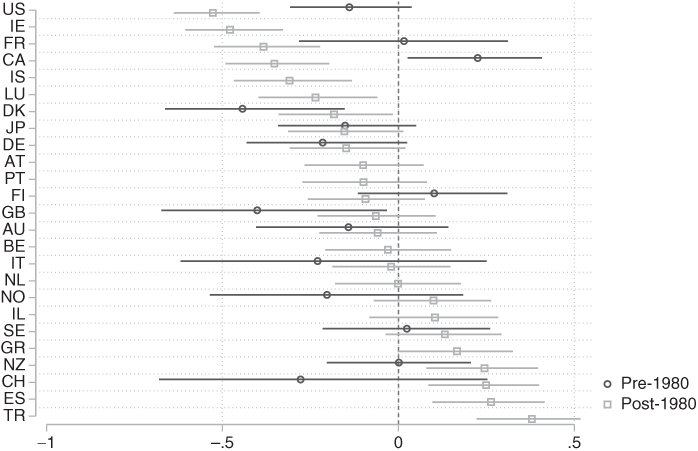
Figure 11.3 Correlation between the annual change in the unemployment rate and annual change in top-1-percent pretax income shares for a broad set of countries, before and after 1980
Notes: Quarterly observations. Pre-1980 observations unavailable for certain countries.
Why do the incomes of the rich tend to grow faster than incomes of the nonrich during economic booms and fall faster during recessions? While we do not seek to unravel this piece of the puzzle in this chapter, we can point to a few possible suspects: reasons why the forces driving economic growth might simultaneously drive greater inequality. Several studies point to changes in the distribution of demand for skills driven by trade and technical change that might generate relatively faster growth (decline) in top incomes as overall output and employment expand (contract). Focusing on the United States, Cutler et al. (Reference Cutler, Katz, Card and Hall1991) argue that, during the recovery of the 1980s, while employment rose – a phenomenon that, on its own, would have benefited lower-paid workers – this aggregate development was overwhelmed by an increase in relative demand for higher-skilled labor, generating a net increase in wage dispersion and income inequality. In broader theoretical work, Aghion, Caroli, and García-Peñalosa (Reference Aghion, Caroli and García-Peñalosa1999) contend that technological change, especially the spread of general-purpose technologies, has become a key driver of both economic growth and earnings inequality by creating a growing skill premium, particularly as the supply of higher-end skills fails to keep pace with demand (see also Goldin and Katz Reference Goldin and Katz2009; Parker and Vissing-Jorgensen Reference Parker and Vissing-Jorgensen2010). Factors such as the increasing financialization of OECD economies (Lin and Tomaskovic-Devey Reference Lin and Tomaskovic-Devey2013) and the decline of labor unions in many advanced economies (Volscho and Kelly Reference Volscho and Kelly2012) may play a similar role, simultaneously driving higher rates of economic growth and higher concentrations of income at the top. And, of course, the same forces might not explain the observed correlations across political economies as different as the liberal United States and social democratic Denmark.
Whatever the underlying economic mechanisms, however, we can see that the share of income going to the most affluent has in recent decades been closely tied to key economic aggregates across a broad swathe of advanced democracies. The implication for the economic news is striking: the tone of news focused on economic aggregates, like growth and unemployment, will be characterized by a bias toward the interests of the very rich – even without any conscious intention, on journalists’ part, to deliver a skewed portrait of the economy. To the extent that growth and income inequality arise from a common source, “good” economic times – understood in aggregate terms – will tend to be accompanied by rising concentrations of income at the top. We should, on this logic, expect economic news focused on the business cycle to more closely track the incomes of the very rich than the incomes of the nonrich, and we should expect the news to become more positive as income inequality – understood as an income skew toward the top – rises. Given the steep concentration of company shareholding among the very rich, economic assessments tied to corporate or stock market performance will likewise be disproportionately correlated with welfare at the top of the income scale.
This argument (if true) would not imply that class-biased economic news emerges apolitically or via the ineluctable operation of market forces. In the United States, for instance, there is strong reason to believe that political choices in areas such as trade, education, labor relations, and taxation have played a substantial role in tying growth and inequality more closely together in recent decades (see, e.g., Hacker and Pierson Reference Hacker and Pierson2011). Moreover, one could understand a journalistic focus on economic aggregates at the expense of distributional dynamics as itself ideological in nature – as a “blind spot” underwritten by a political worldview or material interests. Our claim, however, is that class-biased economic reporting itself need not involve any deliberate effort by reporters to overattend to the interests of the rich. Given the underlying distributional biases in the broader political economy, the emergence of class-biased news merely requires that journalists cheer the economy on during periods of aggregate growth and lament its decline in aggregate downturns.
Why would class-biased economic news matter for the politics of inequality? Recall that voters’ choices are shaped to a substantial degree by sociotropic assessments of the economy and that those assessments are influenced by signals from the news media. If economic reporting is driven overwhelmingly by changes in economic aggregates, and the incomes of the nonrich are less closely correlated with aggregate growth than are the incomes of the rich, then the signals received by nonrich voters in many OECD contexts will most closely track the fortunes of the rich. The implication is not just that nonrich voters’ economic assessments are less likely to capture welfare changes among the nonrich. It is also that nonrich voters are, on average, taking in more favorable assessments of economic performance at precisely those times when inequality is increasing – and less favorable signals as inequality is falling. To the extent that the economic vote is shaped by the news media, then, journalism that covers the business cycle – in a context in which the fruits of growth are concentrated at the top – will tend to generate an electoral environment favorable to rising income disparities between the rich and the rest.Footnote 5
Empirical Predictions
We can summarize our core argument with this simple causal graph:

where X denotes a set of inequality-inducing drivers of growth and employment (e.g., trade, skill-biased technological change, financialization, union decline). In this model, the drivers of growth simultaneously generate aggregate expansion and higher inequality (i.e., higher income shares for the very rich). Economic aggregates, in turn, drive the positivity of economic news, resulting in a positive correlation between inequality and news tone. Importantly, inequality itself has no causal effect on news tone in this model, and class-biased economic news does not emerge from a journalistic response to inequality. Rather, class-biased news arises here from media actors placing a positive value on features of the economy that are systematically correlated with rising inequality, owing to common causes of these features of the economy and rising inequality.
Part of the analysis that follows is focused on the descriptive question of whether class bias is operating: whether the news tracks gains and losses for different income groups in a manner that is disproportionately sensitive to the welfare of the rich. In addition, we examine a number of empirical implications of our theorized causal mechanism. Specifically: (1) News tone should be positively correlated with inequality. (2) News tone should be correlated positively with GDP growth and negatively with unemployment rates. (3) A final prediction – one more specific to the aggregate-centered-journalism explanation for class-biased economic news – is that any correlation between inequality and news tone should be weaker conditional on the macroeconomic aggregates than it is unconditionally. In the language of Pearl (Reference Pearl2009), conditioning on the macroeconomic aggregates should, under this causal model, “block” the path running between news tone and inequality, eliminating any correlation between the two that arises from this path (while potentially preserving other sources of correlation not captured in the model).
Further, in their efforts to find indicators of the performance of the overall economy, journalists may be expected to devote special attention to the health of the corporate sector – with corporate performance itself an important driver of inequality:

Under this argument, (4) corporate performance should be correlated with news tone, and (5) controlling for corporate performance should reduce the size of the correlation between top-end inequality and news tone, since conditioning on corporate performance blocks a path connecting these two variables.
Empirical Evidence of Class-Biased Economic News
We now consider empirical evidence on both the presence of class-biased economic news in advanced democracies and the mechanisms driving it. A growing literature, drawing on increasingly sophisticated data collection and measurement techniques, has examined how the economic news – usually captured by the positivity and negativity of the tone of coverage – responds to changes in the real economy. This has included analysis of the sensitivity of the news to levels and changes of various economic parameters, such as growth, unemployment, and inflation, over different time horizons (Kayser and Peress Reference Kayser and Peress2021; Soroka Reference Soroka2006, Reference Soroka2012; Soroka, Stecula, and Wlezien Reference Soroka, Stecula and Wlezien2015). There has been little analysis to date, however, of whose material welfare the economic news reflects or of whether and how the news captures the distribution of aggregate economic gains and losses.
The media studies literature has yielded significant qualitative evidence, derived from close readings of modest corpora of news content, of how journalists represent distributional issues. On the whole, these studies suggest that news coverage of economic issues generates a discursive environment that is not merely unfavorable to proequality policies, but also favorable to policies that might aggravate existing material disparities. For instance, in the US context, Bell and Entman (Reference Bell and Entman2011), drawing on a qualitative assessment of television news coverage of the highly regressive Bush tax cuts, argue that reporting created an informational environment favorable to their passage. Kendall (Reference Kendall2011), analyzing the frames used in US newspapers to describe people of different classes, finds more sympathetic portrayals of the affluent, even when engaged in wrongdoing, than of the working class and the poor. Schifferes and Knowles (Reference Schifferes, Knowles, Basu, Schifferes and Knowles2018), in a qualitative content analysis of British economic commentary on austerity in the wake of the Global Financial Crisis, find that it overwhelmingly legitimized austerity measures and devoted little attention to its impacts on poverty or household income. Grisold and Preston (Reference Grisold and Preston2020), in a four-country study of newspaper coverage of the debate unleashed by Thomas Piketty’s book, Capital in the Twenty-first Century, report that while inequality is largely represented as a problem, there remains a strong focus on inequality’s quasi-automatic causes (e.g., technology, globalization) at the expense of its political sources. They also find that journalists tend to emphasize the goals of meritocracy and equality of opportunity over that of equality of material outcomes; characterize growth as beneficial for all; and depict redistributionist policies in unfavorable terms. Further, they identify important silences in coverage, including an absence of attention to the failure of earnings to keep pace with productivity growth and to the adverse consequences of inequality.
While these studies shed light on the substantive frames and considerations shaping news coverage, they are unable to speak to broader systematic patterns in news responsiveness. In particular, they cannot tell us how news coverage of the economy on the whole relates to real developments in the distribution of resources. Studies that systematically examine the relationship between a large corpus of news content and objective material-distributional conditions have been sparse and mixed in their findings. Kollmeyer (Reference Kollmeyer2004) analyzes a modest sample of Los Angeles Times articles from the late 1990s and finds that negative economic news focused disproportionately on difficulties faced by corporations and investors as compared to those faced by workers, at a time when corporate profits in California were skyrocketing relative to wages. On the other hand, taking a longer time period and examining a European setting, Schröder and Vietze (Reference Schröder and Vietze2015) analyze postwar coverage of inequality, social justice, and poverty in three leading German news outlets, finding that coverage of these topics rises with inequality itself.
In the remainder of this section, we present analyses that relate the tone of large corpora of economic news content over extended periods of time to real distributional dynamics in the economy across a substantial set of OECD economies. These analyses build on those reported in Jacobs et al. (Reference Jacobs, Scott Matthews, Hicks and Merkley2021), where we examine biases in the economic news in the United States. In that study, drawing on an original dataset of sentiment-coded economic news content from thirty-two large-circulation US newspapers, we uncover a set of descriptive relationships strongly consistent with the operation of a pro-rich bias in the economic news as well as evidence consistent with the empirical predictions of the “covering the aggregates” mechanism. However, the US political economy and media environment are different from those of other OECD nations in many highly consequential ways; relationships uncovered in the United States tell us little on their own about whether class-biased economic reporting is a widespread or general phenomenon in advanced capitalist democracies. Our aim in the remainder of this chapter is thus to ask whether we find similar patterns – in regard to both the descriptive question of whether class bias is operating and the causal question of why – across a broader set of OECD countries. To do so, we bring together a massive new cross-national, time-series dataset of economic news tone from Kayser and Peress (Reference Kayser and Peress2021) and data on the distribution of income from the World Inequality Database.
Data
The dependent variable in all analyses – the tone of the national economic news – derives from Kayser and Peress’s (Reference Kayser and Peress2021) cross-national, time-series dataset. Based on a sample of roughly 2 million newspaper articles about the economy, this dataset provides monthly readings of economic news tone – the degree of positivity or negativity of sentiment in economic news articlesFootnote 6 – for sixteen countries for the period 1977–2014 (coverage windows vary by country; see Table 11.A1 in the Appendix). Complete details regarding data collection can be found in Kayser and Peress (Reference Kayser and Peress2021: 7–12). For our purposes, two critical features of the Kayser and Peress (KP) dataset are worth noting.
First, the data were collected with the aim of studying, among other things, whether media with different ideological leanings portray economic developments differently: whether left-wing outlets report more positively on the economy when a left-wing government is in power, and whether the reverse holds for right-wing outlets under right-wing governments. A key element of the data structure, accordingly, is that tone is observed in two media outlets in each country: one left-wing and one right-wing newspaper. The data consist, thus, of thirty-two time series (16 countries × 2 newspapers per country) of monthly economic-tone observations.Footnote 7
Second, as in Jacobs et al. (Reference Jacobs, Scott Matthews, Hicks and Merkley2021), the KP dataset utilizes a dictionary-based approach to the coding of economic sentiment. Kayser and Peress translated their English-language sentiment dictionaries into five additional languages (French, German, Spanish, Portuguese, and Italian), allowing them to code equivalent measures of economic news tone for multiple countries. The KP dataset contains separate news tone measures concerning coverage of “the economy in general, growth, unemployment and inflation” (p. 12). Our analysis relies solely on the first of these measures. The tone measures are based on coding of the tone (positive or negative) of individual sentence fragments containing terms denoting relevant economic concepts. In turn, these fragment-level tone scores are aggregated by month, such that the monthly tone score is given by the ratio of positive fragments to all positive/negative fragments. This approach normalizes the measure for monthly variation in the volume of economic news.
To the KP dataset, we add measures of growth in pretax and disposable incomes and income shares at different points in the income distribution derived from the World Inequality Database (WID). These measures allow us to replicate in the cross-national sample precisely the same descriptive analyses estimated with US data in Jacobs et al. (Reference Jacobs, Scott Matthews, Hicks and Merkley2021). We rely exclusively on WID measures for the population of individuals over twenty years of age, assuming income is distributed equally among household members (e.g., for average pretax income of the top 5 percent, the variable name is aptinc992j_p95p100). We are also able to use the KP dataset to search for evidence of the possible mechanisms of class-biased economic news, examining the empirical predictions set out in the preceding section. For measures of GDP growth and the unemployment rate, we rely on the indicators included in the KP dataset, which combine data from the Organization for Economic Cooperation and Development and the International Monetary Fund. In addition, we capture corporate performance using a measure of the market capitalization of listed domestic companies as a percentage of GDP, obtained from the World Development Indicators dataset (variable name: mkt_capitalization).
As noted, the KP dataset consists of monthly observations. To align with the analysis in Jacobs et al. (Reference Jacobs, Scott Matthews, Hicks and Merkley2021), we collapse these data to the quarterly level, taking the mean value for each variable within quarters. For economic variables that we observe only annually (such as income growth for income groups), we use linear interpolation to produce monthly values (prior to collapsing the data to quarters). All income-growth variables record twelve-month growth as a percentage. Income share variables are twelve-month first-differences in the proportion of income captured by a particular group. GDP growth is observed quarterly. Finally, we take first differences by month in the unemployment rate and capture monthly percentage growth in market capitalization (again, collapsing these by quarter in the analysis).
Descriptive Patterns across Countries
We start by asking the descriptive question of whether the economic news differentially captures the changing fortunes of individuals in different income groups. We do so by estimating, in different model specifications, the relationship between news tone and income growth at various points along the income distribution. Because our theoretical logic operates via market dynamics, we focus our analysis on the relationship between news tone and changes in market incomes,Footnote 8 but we show toward the end of this subsection that the pattern is remarkably similar when we instead examine changes in disposable income.
Given the spatial and temporal structure of our data, simply pooling the observations and estimating the relationships of interest by OLS would not be appropriate, as this requires implausible assumptions regarding the independence of observations over time and across the panels (i.e., the thirty-two newspapers). Accordingly, throughout this section and the next, we estimate dynamic models of economic tone that incorporate newspaper-specific fixed effects and time trends, quarter-of-year fixed effects, and four lags of the dependent variable. Our goal is to model the “nuisance” variance within our data, in the form of temporal trends and autocorrelations, so that our remaining inferences regarding the associations between news tone and changes in the economy are credible. More precisely, we estimate the following regression model:

where  is economic news tone for newspaper
  at time
  , the
, the  are newspaper fixed effects, the
  are newspaper-specific time trends,
  is a time counter,
  are quarterly dummies, and
  is a set of income quantiles that varies by model. We also allow a newspaper-specific AR1 process in the errors and estimate panel-corrected standard errors.Footnote 9
First, dividing each country’s population into income quintiles, we ask how the tone of the economic news relates to income growth for each quintile, conditional on income growth in all of the other quintiles. We display, in Figure 11.4, estimates of these associations across the sixteen countries, revealing that growth in the top quintile is significantly associated with economic tone. The estimate implies that, in this cross-national sample, a standard deviation increase in the average income of the top 20 percent is associated with an increase in the positivity of economic news of 0.13 standard deviation units. There is no sign that income growth in any other quintile is associated with the tone of economic news, as the relevant coefficients cannot be reliably distinguished from zero. The top-20 percent coefficient is also significantly larger than the first- (p = 0.02) and fourth-quintile (p = 0.02) coefficients.

Figure 11.4 Association between economic news tone and pretax income growth for each income quintile, conditional on income growth for all other quintiles
We next turn to the association between economic news tone and income growth within progressively narrower slices of the very top of the income distribution. We include, in separate models, measures for the top 10 percent, 5 percent, 1 percent, and 0.1 percent of income earners. As regards income growth at the top, the results, presented in Figure 11.5, suggest that the fortunes of highly affluent subgroups of the population are significantly associated with economic tone in the cross-national sample. A standard deviation increase in income growth among the top 10 percent of earners, for example, is associated with an increase in the positivity of economic tone of 0.11 standard deviations. Equivalent shifts among the top 5 percent, top 1 percent, and top 0.1 percent are associated with increases in economic tone of 0.10, 0.08, and 0.05 standard deviations, respectively. The comparison between the top 10 percent and top 0.1 percent in the magnitude of these associations bears emphasis: whereas the top 10 percent group is 100 times the size of the top 0.1 percent group, the magnitude of the former’s association with tone is just over double that of the latter. Notwithstanding the sizable correlation between these two income-growth variables ( ), the results suggest that an outsize share of the association between top 10 percent growth and economic tone reflects the association between tone and a tiny sliver of earners at the very top of the income distribution.
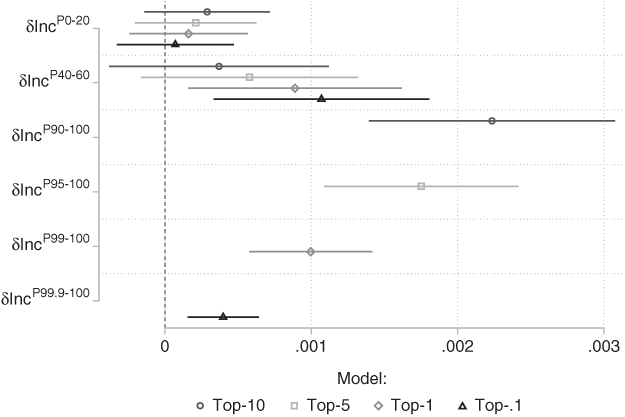
Figure 11.5 Association between economic news tone and pretax income growth for top-income groups, controlling for bottom- and middle-income growth
A notable difference between Figure 11.5 and the US results, reported in Jacobs et al. (Reference Jacobs, Scott Matthews, Hicks and Merkley2021, Figure 11.3), concerns associations between economic tone and income growth in the middle of the distribution. In the United States, there is no sign whatsoever that change in the fortunes of any group below the very top is associated (conditional on income changes at the top) with the positivity of economic news. In the cross-national sample, however, there is evidence that growth in the third quintile is related to economic news sentiment. In models that include the top 1 percent or top 0.1 percent of income earners (diamonds or triangles in Figure 11.5), who have been so central in popular discourse on economic inequality, growth in incomes at the middle is significantly associated with economic tone. Specifically, in the top-1 percent model, a standard deviation increase in growth at the middle of the income distribution is associated with a 0.04 standard deviation increase in tone, while the same increase in the top-0.1 percent model is associated with a tone shift of 0.05 standard deviations. The important substantive implication is that, when we look beyond the United States, there is some evidence that coverage of the economy is, on average, somewhat reflective of the experiences of a broad swath of the population.
Nevertheless, the estimates depicted in Figure 11.5 also imply that there is still a very substantial class bias in economic news in the cross-national sample. For instance, focusing on the top-1 percent model, recall the 0.08 standard deviation shift in tone associated with a standard deviation increase in income growth in this top-income group – an association that is double the estimate for the middle quintile (in the top-1 percent model), even as the latter income group is twenty times larger than the former.
We now evaluate these patterns more formally by constructing a test for the presence of pro-rich bias in the tone of the economic news. This test takes into account the fact that the income groups we are comparing are comprised of different numbers of individuals, with (for instance) the bottom 20 percent being comprised of twenty times more people than the top 1 percent. We define unbiasedness according to the normative principle that every individual’s welfare should weigh equally in representations of the nation’s welfare. On this “representational equality” principle, the absence of pro-rich bias would require that the correlation between, for instance, bottom-quintile income growth and news tone be twenty times larger than the correlation between top-1 percent income growth and news tone. Under this logic, inferences about biasedness must derive from the ratios of relevant coefficients, rather than the raw coefficients themselves.
On this basis, we estimate models that allow us to assess the degree of descriptive pro-rich bias in news tone. The core specification that we adopt here contains income-growth rates for three income groups: the bottom 20 percent, the top X percent, and the broad middle from the 20th percentile to the lower threshold of the top-X percent group – where we estimate models with X ∈ {10, 5, 1, 0.1} to assess the robustness of the inferences to progressively narrower conceptions of top income.
We separately present results for a comparison of the broad middle to the top (Figure 11.6a) and for a comparison of the bottom to the top (Figure 11.6b). For the former, for each top-income measure, the circle represents the estimated ratio of news tone’s association with income growth in the broad middle to news tone’s association with income growth for the top-income group. We see that, in Figure 11.6a, the ratio of tone’s association with middle-income growth to tone’s association with top-income growth is statistically indistinguishable from zero for all but the comparison with top-1 percent income growth. Meanwhile, the diamonds represent the group-size-based normative baseline of unbiasedness for each top-income measure. We do not plot the diamonds for the top-0.1 percent models because these values (799 for the middle-top comparison and 200 for the bottom-top comparison) would be located so far to the right that the x-axis scales would be too large to clearly read off the inferences for the other top-income groups.
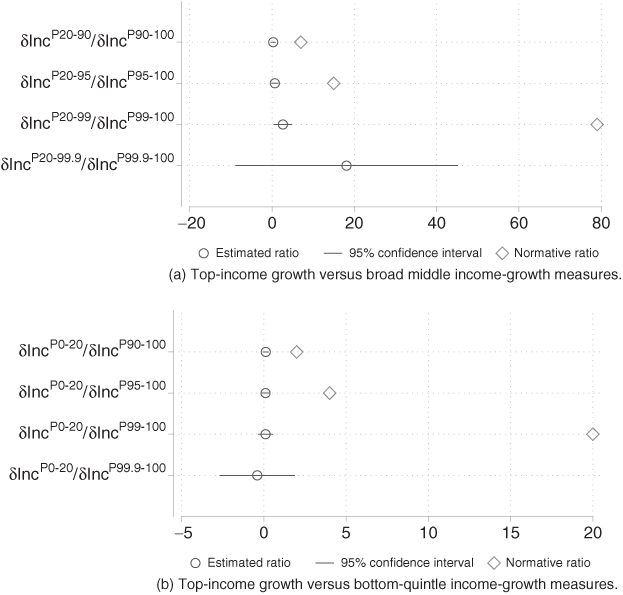
Figure 11.6 Estimated coefficient ratios from models predicting economic news tone with pretax income growth for different parts of the income distribution
Notes: Each row in each panel represents a ratio between the news-tone/income-growth correlation for a top-income group to the news-tone/income-growth correlation for a nonrich group. The diamond represents a normative baseline ratio for each comparison, derived from relative population sizes and the principle of equal per capita weighting. The circle (with 95 percent confidence interval) represents, for each comparison, the actual estimated ratio between the two tone-growth correlations. Confidence intervals not apparent where they are smaller than the radius of the dot representing the point estimate.
To illustrate how one would read this graph, consider the third row in Figure 11.6a, which plots the comparison between the top 1 percent (p99–100) and the income group that lies between the 20th and 99th percentiles (p20–99). The diamond represents the normative baseline for this comparison. If every individual’s economic welfare received equal weighting in the news media’s depiction of each nation’s economic welfare, then the correlation between news tone and income growth for the p20–99 group should be seventy-nine times the size of the correlation between news tone and income growth for the p99–100 group – since the population of the former group is seventy-nine times as large as that of the latter. The plotted circle on this same row represents the actual estimated ratio between these two correlations and the 95 percent confidence interval around that estimate for our sixteen countries. As can be seen here, the estimated ratio is a tiny fraction of that normative baseline, indicating that the association between news tone and income growth for the p20–99 group is dramatically smaller than that for tone and income growth of the top 1 percent, once we adjust for the differing sizes of the groups. Figure 11.6b is read in the same way, but with the nonrich comparison group always being the bottom 20 percent, rather than the broad middle.
The core message of Figure 11.6a is that, across all four top-income measures, the estimated ratios are much lower than the normative baseline: in other words, news tone’s association with top-income growth is far stronger, relative to that with middle-income growth, than would be expected on the basis of an equal weighting of the welfare of individuals across the income distribution. As the confidence intervals indicate, the inferences in this regard are extremely clear. Figure 11.6b displays, with respect to the bottom-top comparison, a remarkably similar pattern of stark overrepresentation of the welfare of the very rich in the tone of the economic news.Footnote 10
We have so far analyzed tone-income growth relationships for market incomes, but we might wonder whether government intervention changes the picture. To address this question, we undertake precisely the same set of analyses we have presented for pretax incomes, but now substitute measures of growth in disposable income for the pretax indicators. Note that, in doing so, we lose five countries for which disposable income estimates are not available (Australia, Canada, Israel, Japan, New Zealand), which together comprise over 40 percent of our observations.
Figure 11.7, which plots associations between news tone and disposable income growth by quintile, yields the same inference as the counterpart figure for pretax incomes: there is a significant positive association between tone and income growth in the top quintile, and only extremely weak evidence of such an association for any other quintile. The estimates indicate that a standard deviation increase in the rate of income growth in the top quintile is associated with a 0.18 standard deviation increase in the tone of economic news.
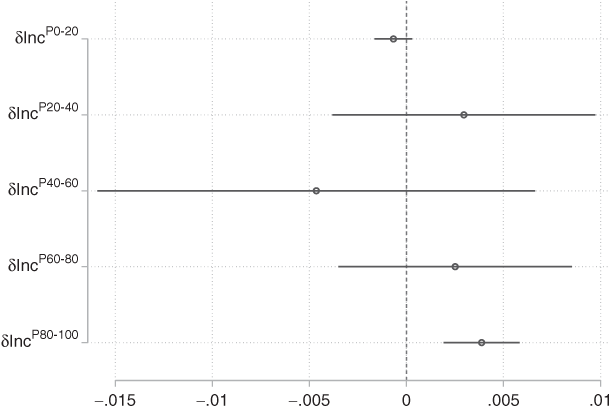
Figure 11.7 Association between economic news tone and disposable income growth for each income quintile, conditional on income growth for all other quintiles
Figure 11.8 captures relationships between economic tone and narrow slices at the top of the income distribution and is the disposable income counterpart to Figure 11.5. Again, the inferences are largely similar. Economic tone is positively associated with disposable income growth for the top 10 percent, top 5 percent, and top 1 percent of income earners; only among the top 0.1 percent does the association fall from statistical significance. A standard-deviation increase in disposable income growth among the top 10 percent, top 5 percent, and top 1 percent is associated with increases in the positivity of economic tone of 0.15, 0.12, and 0.07 standard deviations, respectively. As in the pretax estimates, tone is also positively associated with income growth in the middle quintile, except in the model including top 10 percent income growth. Depending on the model, a standard deviation increase in the rate of income growth in the middle quintile is associated with economic tone increases of between 0.10 and 0.11 standard deviations.
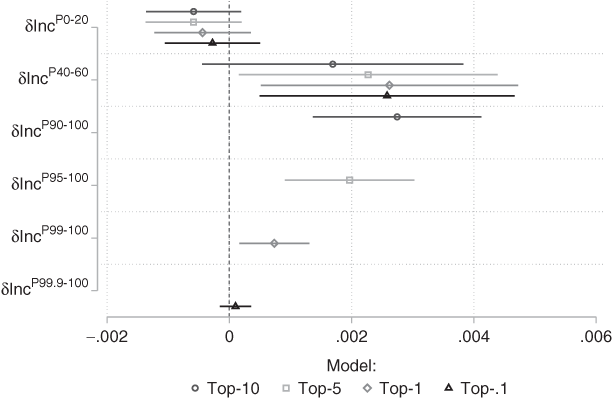
Figure 11.8 Association between economic news tone and disposable income growth for top-income groups, controlling for bottom- and middle-income growth
Finally, Figure 11.9 returns to our formal test for class-biased economic news. Figure 11.9 is exactly parallel to Figure 11.6, but uses disposable income growth instead of pretax income growth. As in Figure 11.6, we are comparing the ratios of growth-tone coefficients for different group pairings against a normative standard of representational equality. By this standard, it will be recalled, coefficient magnitudes should be in proportion to group sizes – that is, for instance, the coefficient for income growth in the bottom quintile should be twenty times that of the top 1 percent (see further discussion earlier). In each row, the diamond represents the normative baseline ratio of the growth-tone correlation for the top-income group to the growth-tone correlation for the middle (11.9a) or bottom (11.9b) income group. So, for instance, we see that for the comparison of the p20–95 group to the p95–100 group, we would normatively expect news tone’s correlation with the former group’s welfare to be about fifteen times as large as its correlation with the latter group’s welfare. The circle in this row represents the estimated actual ratio between these two growth-tone correlations. As we can see, the estimated ratio is much smaller than the normative baseline ratio, indicating that the correlation of news tone with the welfare of the p20–95 group is in a per capita sense (our normative baseline), dramatically smaller than news tone’s correlation with the welfare of the top 5 percent. Note that we omit comparisons involving the top 0.1 percent: as the coefficients for this group are very imprecisely estimated, the wide confidence intervals for the corresponding ratios have a distorting effect on the plot.
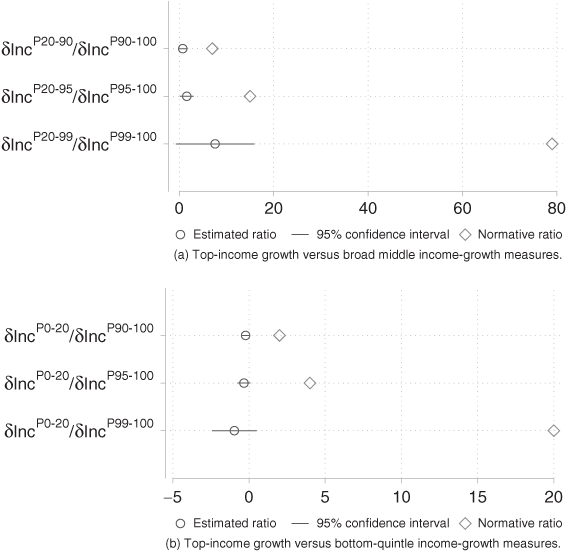
Figure 11.9 Estimated coefficient ratios from models predicting economic news tone with disposable income growth for different parts of the income distribution
Notes: Each row in each panel represents a ratio between the news-tone/income-growth correlation for a top-income group to the news-tone/income-growth correlation for a nonrich group. The diamond represents a normative baseline ratio for each comparison, derived from relative population sizes and the principle of equal per capita weighting. The circle (with 95 percent confidence interval) represents, for each comparison, the actual estimated ratio between the two tone-growth correlations. Confidence intervals not apparent where they are smaller than the radius of the dot representing the point estimate.
In short, as with the pretax income estimates, the estimated ratios uniformly diverge from the normative standard of equality. Figure 11.9a shows that the association between disposable income growth and economic tone is much stronger – sometimes many times stronger – for top-income groups than for the broad middle of the income distribution. Figure 11.9b tells a substantively equivalent story for the comparison of top- to bottom-income group coefficients, with the notable qualification that the estimated ratios are actually negative. This pattern reflects the fact that the coefficients for the bottom quintile, while statistically insignificant, are in fact less than zero. In any case, the implication is the same: relative to lower income groups, improvements in the welfare of those at the very top are vastly better reflected in the tone of economic news.
To summarize, our analysis of associations between economic tone and income growth measured at different points in the income distribution reveal a pattern of class-biased economic news across a broad sample of advanced democracies. In Tables 11.A7 and 11.A8 in the Appendix, we show that the comparative results are virtually unaffected by excluding the United States from the analysis. Having said that, there is one notable way in which the United States stands out. Contrary to our earlier US results, we do find some evidence in the cross-national sample of associations between economic tone and income growth below the very top. However, the below-the-top associations are still substantially smaller than those at the top when considered relative to the size of the income groups concerned.
Mechanisms of Class-Biased Economic News in the OECD
We next go looking for evidence of the mechanisms that might explain this normatively troubling descriptive bias in the relationship between economic news tone and distribution. We begin by asking whether and how much of the observed bias can be explained by our central argument: that is, by the media’s tendency to cover economic aggregates, which are themselves positively correlated with top-end inequality.
To shed light on this question, we take advantage, as noted earlier, of time-series data on economic aggregates (measures of GDP growth and the unemployment rate) for each country in the KP dataset. To these measures, we add the measure of market capitalization growth obtained from the World Development Indicators. We focus our analysis on the five empirical implications of the covering-the-aggregates argument, outlined earlier. For these tests, we return to using pretax incomes since our proposed mechanism speaks primarily to the relationship between economic aggregates and the market income of the very rich, whether earnings or capital income. We estimate models of the form described earlier, though now we include additional variables – principally, economic aggregates – relevant to our theory.
Estimates for the variables of interest are reported in Table 11.1. We start with a baseline estimate of the correlation between economic news tone and income inequality. If, as we showed in the preceding section, economic news sentiment is relatively more strongly associated with growth in the incomes of the most affluent, then it follows that a change in the share of income captured by the most affluent – here, the top 1 percent of income earners – should be positively associated with economic tone (Prediction 1). The estimates for Model 1 confirm this expectation.
Table 11.1 Mechanisms of class-biased economic news
| (1) | (2) | (3) | (4) | (5) | (6) | |
|---|---|---|---|---|---|---|
 | 0.8329*** | 0.4735** | 0.6666*** | 0.6137** | 0.3052 | 0.8367*** |
| (0.2087) | (0.1826) | (0.1891) | (0.2058) | (0.1846) | (0.2086) | |
 | 0.0382*** | 0.0261*** | ||||
| (0.0043) | (0.0038) | |||||
 | −0.0738*** | −0.0529*** | ||||
| (0.0107) | (0.0102) | |||||
 | 0.0039*** | 0.0032*** | ||||
| (0.0007) | (0.0006) | |||||
  | 0.0852 | |||||
| (0.0839) | ||||||
| Constant | 0.1463*** | 0.1429*** | 0.1563*** | 0.1186*** | 0.1284*** | 0.1466*** |
| (0.0281) | (0.0260) | (0.0265) | (0.0268) | (0.0245) | (0.0281) | |
| Observations | 2061 | 2061 | 2061 | 1947 | 1947 | 2061 |
Standard errors in parentheses. Regressions include quarterly and newspaper-fixed effects, newspaper trends, and 4 lags of economic tone, with panel-corrected standard errors.
*p < 0.05, **p < 0.01, ***p < 0.001
In Models 2 and 3, we consider whether economic aggregates, specifically, GDP growth and change in the unemployment rate, drive the tone of economic news (Prediction 2) and also account, via their correlations with income inequality, for some part of the correlation between inequality and economic tone (Prediction 3). The former expectation is strongly supported in these models: Model 2 shows that GDP growth is positively related to economic tone, while Model 3 indicates that change in the unemployment rate is negatively related to tone. Both coefficients are statistically significant at the 99.9-percent level.
Critically, there is also clear evidence that part of the association between inequality and economic tone reflects correlations between inequality and these two economic aggregates. When GDP growth is controlled for, the association between economic tone and change in the income share of the top 1 percent is sliced by more than two-fifths (Prediction 3). Controlling for change in unemployment has a similar, if more modest, effect: the coefficient on top 1 percent income share change is reduced by one fifth (Prediction 3).
Model 4 addresses the specific role of corporate performance in the covering-the-business-cycle process. We see here that growth in market capitalization is positively related to positive economic tone (Prediction 4). We also see that controlling for this variable reduces the association between economic tone and top 1 percent income share change by more than a quarter (Prediction 5).
Model 5 captures the combined effect of GDP growth, unemployment rate change, and market capitalization growth on the association between economic tone and income inequality. Notably, while the associations between the three growth-related variables shrink in this setup, each variable retains a sizable and statistically significant association with economic tone, which reflects the modest correlations between these variables in the cross-national sample.Footnote 11 Most importantly, from the perspective of the covering-the-business-cycle theory, the inclusion of these variables in the same model shrinks the top 1 percent income share change coefficient by almost two-thirds, rendering it statistically insignificant.
Overall, looking across the estimates of Models 1–5, one finds substantial support for the argument that the class bias in economic news across OECD countries reflects journalists’ focus on economic aggregates in reporting on economies in which inequality itself is cyclical. Moreover, we show in Table 11.A9 in the Appendix that the results of these mechanism tests are broadly the same when the United States is excluded from the sample.
Last, we leverage Kayser and Peress’ coding of the ideological leanings of newspapers to speak to alternative mechanisms. If class-biased economic news reflects the class-biased interests or worldviews of news producers or consumers, then class bias in the tone of economic news should be stronger in those outlets that present a more conservative worldview in general. Model 6 thus adds an interaction between top 1 percent income share change and newspaper ideology. The interaction between inequality and ideology is not statistically significant: the tone of the news in left-wing newspapers is as strongly associated with inequality as is economic news tone in right-wing newspapers. Of course, it is possible to imagine ideological or interest-based mechanisms that might operate for left- as well as right-wing outlets (e.g., even the former are likely to be owned by members of the richest 1 percent and rely on corporate advertising). Yet the lack of any detectable difference should cast at least some doubt on the notion that class biases derive in any straightforward way from media actors’ ideological commitments.Footnote 12
Conclusion
Our aim in this chapter has been to suggest that there is something worth puzzling over in the relationship between economic news and income distribution in advanced democracies. The analysis that we present here naturally has its limits. In seeking to characterize national media environments, we have drawn on data from only two newspapers per country, and our sample is limited both in the number of countries and the time period covered. Yet we think the evidence in this chapter constitutes at least a prima facie case that economic reporting by leading news outlets in a wide range of advanced democracies aligns relatively poorly with the economic experiences and distributional interests of the nonrich. We hope that other scholars will seek to test this proposition with more data drawn from a wider set of national contexts.
Among the questions that we have not addressed here is what might explain the variation in patterns of class-biased reporting across countries. Table 11.A1 in the Appendix suggests considerable differences in the presence and strength of pro-rich biases in economic news across the OECD contexts in our sample. Some of this variation may be mere “noise,” given the small number of available observations for some countries. At the same time, these results may, in fact, understate the variation across the OECD, insofar as Nordic social democracies are not captured in the KP data.
What might explain the cross-national variation in class-biased economic reporting? We suggest a few possibilities in the spirit of hypothesis generation. One conjecture that flows directly, and almost mechanically, from our theoretical argument is that settings in which economic growth and contraction are less strongly (and positively) correlated with top-income shares should see less-biased economic news coverage. We would expect a range of factors – from labor-market rules and institutions to the tax treatment of executive compensation to the degree of financialization of the economy – to condition the link between inequality and the business cycle. Variation in the underlying structure of the political economy should, in turn, generate variation in the pro-rich bias of the economic news. That said, Table 11.A1 does not suggest any straightforward pattern, given the considerable variation across countries typically considered to have broadly similar political economies (e.g., Ireland vs. other liberal countries; Germany and France vs. Austria).
We might also imagine variation in the norms and routines that shape the production of news content itself. In characterizing the performance of the economy, journalists might attend more to the distribution of gains and losses in contexts that otherwise make distribution more salient. These might include, for instance, contexts in which inequality is especially high, in which parties on the Left place distributional matters prominently on the agenda, or in which party competition is strongly configured around a distributional dimension of conflict.
We would also emphasize that our analyses by no means settle the question of whether or how the ideology and interests of news producers and consumers shape economic reporting. The news outlets in our sample may represent too little variation in ideological leanings or economic worldviews to pick up the effect of these factors. As we have also noted, a journalistic focus on the business cycle might itself reflect a set of widespread ideological presumptions about the benefits of growth or satisfaction with a set of measures that in fact do a good job of capturing the welfare of the most affluent. Unpacking these possibilities will likely require, in part, the collection of individual-level data tapping media owners’ and journalists’ economic attitudes and worldviews.
Finally, we point out some complexity in making normative sense of our findings. While periods of economic growth see rising concentrations of income at the top, they also tend to be the periods in which most groups experience absolute income gains. One might, therefore, ask whether it is such a bad thing if the nonrich receive favorable signals about economic performance in periods in which they are gaining in absolute terms, even if they are losing in relative terms. Indeed, news tone has a positive, statistically significant (p < 0.05) bivariate relationship (i.e., without controls for other income quintiles) with disposable income growth for all but the first and second income quintiles in the countries in our sample (see Figure 11.A1 in the Appendix). This pattern suggests that the economic news might tend to correctly signal the direction of welfare change for most income groups. This fact, however, does not seem to us to dispose of the normative problem. For one thing, news tone appears to provide no meaningful signal about how the economy has performed for the bottom 20 percent of the income scale; and, more generally, Figure A1 suggests that news tone provides a less-informative signal as we move down the income distribution. More importantly, accepting the signaling of absolute gains as normatively sufficient would commit us to the view that information about distribution is effectively irrelevant for the formation of citizen assessments of economic performance. We see no clear reason to believe that nonrich citizens with full information would be indifferent to the distribution of aggregate gains and losses.Footnote 13
We also note that these patterns – news tone’s positive correlation with both inequality and absolute income gains for middle-income groups – may shed light on the economic and political resilience of advanced capitalist democracies, as examined by Iversen and Soskice (Reference Iversen and Soskice2019). In Iversen and Soskice’s view, postwar democracy and advanced capitalism have operated in a symbiotic relationship, as democratic governments have made economic policy choices in response to voter demands for effective economic management, delivering both prosperity and democratic legitimacy. At the same time, as we have shown in Figure 11.1, that growth has in most countries disproportionately benefited the very rich. Our analysis of the informational environment might help explain how incumbents have won support for prosperity-generating policies that exacerbate inequality: as they evaluate governments’ economic management, the middle classes receive media signals that track the rise in aggregate prosperity and the absolute gains experienced by their own income groups but are insensitive to the distribution of those gains. Economic reporting that systematically attended to distribution – perhaps applying a “tone penalty” to less-equal allocations – might well heighten the contradictions embedded in advanced capitalist democracy.
The contributions to this volume each attempt to understand why advanced capitalist societies are less equal and less redistributive than they were in the 1990s. Our editors point out in their introduction that one set of potential explanations for the general rise in inequality centers on the decisions of elites, and another centers on the attitudes and choices of members of the public.
This chapter focuses on the latter explanation. Why do members of the public not support redistribution when doing so would likely benefit them economically? In the United States, racism is a leading explanation (Alesina and Glaeser Reference Alesina and Glaeser2004; Katznelson, Geiger, and Kryder Reference Katznelson, Geiger and Kryder1993; Lupu and Pontusson Reference Lupu and Pontusson2011). Racism interrupts the ability of people to feel concern for each other, which support for redistribution requires (Epper, Fehr, and Senn Reference Epper, Fehr and Senn2020). Instead, people tend to save their concern for those with whom they identify (Fowler and Kam Reference Fowler and Kam2007). In the United States, a disproportionate share of low-income earners are people of color. Racism among Whites appears to drive lack of empathy or acknowledgment of the role of racism in economic inequality, which undermines support for more redistribution (Alesina and Glaeser Reference Alesina and Glaeser2004; Elkjær and Iversen, this volume; Knowles et al. Reference Knowles, Lowery, Chow and Unzueta2014; Lupu and Pontusson Reference Lupu and Pontusson2011).
To be clear, it is Whites who are particularly less supportive of redistribution (Alesina and Giuliano Reference Alesina, Giuliano, Benhabib, Bisin and Jackson2011; Alesina and La Ferrara Reference Alesina and La Ferrara2005), especially when they perceive the recipients of “welfare” are people of color (Gilens Reference Gilens1999) or when they are living in contexts that suggest they likely perceive that recipients of redistribution are people of color (Luttmer Reference Luttmer2001; Poterba Reference Poterba1997). In other words, racism appears to dampen the willingness of Whites to support what Cavaillé calls “redistribution to” others (this volume).
The fact that racism prevents redistribution is not news. Political actors in the United States have used racist appeals since the end of slavery to interrupt coalition building between Whites and Blacks that might threaten the fortunes of higher-income Whites (Alesina and Glaeser Reference Alesina and Glaeser2004). But the fact that the relationship between racism and lack of support for redistribution persists suggests we need to know more about how it is reproduced in the current political context.
In recent years, questions about the role of racism in lack of support for redistribution in the United States have arisen frequently with respect to White rural residents. I am drawn to these questions after years of studying what I eventually labeled “rural consciousness,” an identification as a rural resident intertwined with a perception of distributive injustice (Cramer Reference Cramer2016; Cramer Walsh Reference Cramer Walsh2012). I became aware of this perspective while conducting intensive listening in several dozen communities throughout the state of Wisconsin between 2007 and 2012. In the conversations I witnessed, I heard many White people in smaller communities and rural places expressing a perception that people living outside major metro areas were not getting their fair share of attention, resources, or respect. They said that the decisions that affected their lives were made primarily in cities and communicated out to them with little listening going on to the needs and concerns of people in rural areas. They also perceived that the wealth and the good jobs were primarily in the cities and that their taxpayer dollars were spent primarily on these urban communities, not on communities like their own. Finally, they perceived that the people making the decisions that affected their lives did not respect rural people like themselves.
This perspective tended to coincide with a preference for Republican Party candidates, who in the contemporary era have generally opposed redistribution. Many of the people I listened to perceived that the government was not working for them and therefore were highly skeptical of more government programs. This aversion to government is particularly striking in recent decades, given that rural areas have been particularly slow to recover from the Great Recession of 2007–2008 (Pipa and Geismar Reference Pipa and Geismar2020; The New Map of Economic Growth and Recovery 2016).
The rural resentment toward urban areas that makes opposition to redistribution seem appropriate has been simmering, if not growing, for decades. Its multifaceted nature facilitates its use as a persuasive tool. The perspectives of resentment I heard in Wisconsin included resentment toward cities, city residents, public employees, liberal elites, Democrats, and people of color. Through this lens, geography represents not just whom the political in-group is, but whom people can trust, and whom they deem deserving. Candidates or politicians priming resentment toward any one of the facets of rural resentment activate negative attitudes toward the other associated groups. Republican Scott Walker rose to power as Wisconsin’s governor this way, and Donald Trump used a similar strategy to help win the US presidency.
In the wake of Trump’s 2016 victory, Brexit, and other successes for right-wing populist candidates, a key debate has been whether support for these actors is driven by economic or cultural concerns (Inglehart and Norris Reference Inglehart and Norris2017; Margalit Reference Margalit2019). The understandings that I heard suggest that the driver is not one or the other, but instead the intertwining of the two (Gidron and Hall Reference Gidron and Hall2017; Mutz Reference Mutz2018; see also Rooduijn and Burgoon Reference Rooduijn and Burgoon2017). When people told me they were not receiving their fair share, they were claiming that they deserved more and that others were getting more than they deserved. Such assessments were about economics and culture at the same time. These claims are part of a culture infected with racist notions of what human lives are worth and who works hard (and is therefore deserving) (Soss and Schram Reference Soss and Schram2007). Whether or not people support redistribution rests on their willingness to extend support to others and to see others in the country as members of the same community. In this way, economic concerns cannot be understood independently from cultural concerns in the United States.
In the study that follows, I sought to learn more about how racism in particular is intertwined with economic concerns and interrupts support for redistribution among White residents of rural areas in the United States. Specifically, I sought to listen to the way White residents of rural areas talked about racism and whether and how understandings of economic inequality and redistribution entered. In my earlier fieldwork, the people I listened to seldom talked about racism. For this reason, in this study, I intentionally focused on conversations about racism and listened to the way economics entered.
To do so, I turned to local talk radio shows. Investigating the conversations among hosts and callers on local talk radio shows allowed me to listen to the way people rooted in particular places made sense of politics during the pandemic, when face-to-face fieldwork was not possible. The talk radio audience is extensive,Footnote 1 and talk radio is an important source of information among Right-leaning voters in particular in the United States (Dempsey et al. Reference Dempsey, Suk, Cramer, Friedland, Wagner and Shah2021; Mitchell et al. Reference Mitchell, Jurkowitz, Oliphant and Shearer2021). National talk radio hosts have operated as important opinion leaders within the Republican Party since shortly after the repeal of the Fairness Doctrine in 1987, which made it possible for stations to air partisan programming without providing equal time to opposing views (Berry and Sobieraj Reference Berry and Sobieraj2011; see also Bobbitt Reference Bobbitt2010). Hosts such as Rush Limbaugh have likely been drivers of public opinion and the behavior of party leaders (Hacker and Pierson Reference Hacker and Pierson2020; Rosenwald Reference Rosenwald2019).
Local talk radio shows are aired within a particular media market or select region. Many talk radio stations have at least one local show (Bobbitt Reference Bobbitt2010: Ch. 1). These local shows are important because their content is more likely to tap into placed-based identities and illuminate the relevance of national-level issues for their listeners. Such information increases the chances that people will consider their own socioeconomic circumstances when forming an opinion on it (Chong, Citrin, and Conley Reference Chong, Citrin and Conley2001) and therefore be more likely to engage in political action (Ozymy Reference Ozymy2012).
I focused on shows broadcast out of predominantly White, northern (and primarily Midwestern), and less metropolitan areas in order to focus my attention on the communication among residents comparable to those I had listened to while studying rural resentment. This communication is not necessarily representative of all communication among all conservative Whites, or even among all conservative northern, rural Whites. My intent was to closely observe specific cases of conservatives talking about race and racism to observe whether and how they connect these topics to opposition to redistribution.
Since the focus of my listening was on shows broadcast from places considerably less racially diverse than other rural areas of the country, future work would benefit from listening to similar conversations in other parts of the United States and around the globe, since understandings of race and racism are distinctive in the rural north (Carter et al. Reference Carter, Corra, Carter and McCroskey2014).
I focus my analytic listeningFootnote 2 on local talk show discussions about a particular event that undeniably involved race and racism: the murder of unarmed African-American George Floyd by Derik Chauvin, a White Minneapolis, Minnesota, police officer, and the resulting protests that took place in that city and around the world. Floyd’s death on May 25, 2020, was captured on video and lit global protests against racial injustice because of the egregious nature of the way he was killed, with Chauvin kneeling on his neck for over nine minutes while Floyd gasped and pleaded for air.
There was very little explicit connection between racism and redistribution in these conversations. Instead, the shows deflected attention away from race and racism in a variety of ways, preventing much discussion of connections between redistribution or even economics and racism.
Paying attention to situations in which people legitimize turning away from racism is necessary for understanding how racism continues to prevent the United States as well as other countries from pursuing the redistribution that would to enable those at the bottom of the income scale to attain a sufficient standard of living in order to thrive. What narratives do people tell that de-emphasize humanitarianism and equality, and instead raise up individualism and aversion to large government (Feldman and Zaller Reference Feldman and Zaller1992; Hochschild Reference Hochschild1981)? What do people tell each other that leads them to perceive the cause of racial inequality is individual initiative rather than systematic disadvantage (see Kam and Burge Reference Kam and Burge2018)?
In what follows, I will discuss when attention to racism arose and will describe and explain how hosts and callers deflected from it and how this prevented consideration of the linkage between racism and redistribution. The results contribute to our understanding of the way US society continues to relegate Blacks to the bottom of the status hierarchy in a way that perpetuates inequality. The active refusal to consider racism casts the problem of inequality as those at the bottom getting more than they deserve, rather than those at the top getting too much, and thereby places responsibility on Blacks for their lack of income, not on broader forces that might be advantaging Whites (see Knowles et al. Reference Knowles, Lowery, Chow and Unzueta2014).
The collective deflection from racism that occurs on these shows perpetuates a view that racism is no longer a factor in the United States. Through this lens, hosts and callers justify their lack of empathy with people of color by treating inequality as the result of individual failings, or as the fault of Democrats, who make it an issue in pursuit of their own political goals.
Using Local Talk Radio to Listen
To focus on the content of talk radio shows, I used a talk radio data collection tool designed by the Center for Constructive Communication at the MIT Media Lab.Footnote 3 This tool, RadioSearch, ingested and automatically transcribed the content of dozens of talk radio stations from around the country for several years.
I initially focused my listening on a Right-leaning show broadcast out of Duluth, Minnesota, which is located in a rural area of the state in which Floyd was killed. (See Table 12.1 for details on the shows examined.) This was a weekday morning show called “Sound Off with Brad Bennett.”Footnote 4 Each day, it started with this introduction: “Good morning, Northlanders, and Welcome to Sound Off. For the next 3 hours let your voices be heard about the things that are important to you, the hardworking men and women of the Northland, who pay more than their fair share of taxes.” This introduction also announced that host Bennett served as a Marine Corps Sergeant in the Vietnam War, and served three terms on the Duluth School Board.
Table 12.1 Characteristics of broadcast communities
| Station | Show | Location | City populationFootnote 1 | 2020 Trump vote in countyFootnote 2 | Percent people of color in city | Percent people of color in county | Median household income in city | Median household income in county |
|---|---|---|---|---|---|---|---|---|
| KBUL | Montana Talks | Billings, MT | 109,595 | 60.6% | 14.9% | 14.1% | $58,394 | $61,186 |
| KLIX | Bill Colley Show | Twin Falls, ID | 48,951 | 71.5% | 22.5% | 21.8% | $50,739 | $55,785 |
| KLXX | Joel Heitkamp Show | Fargo, ND | 121,889 | 49.9% | 17.3% | 15.6% | $52,810 | $62,218 |
| KOAN | Eddie Burke Show | Anchorage, AL | 293,531 | 52.8% | 42.1% | – | $82,716 | – |
| KZSE | MPR News with Kerri Miller | Rochester, MN | 118,924 | 43.8% | 25% | 20.9% | $74,527 | $80,096 |
| WAOK | Wanda Stokes Show | Atlanta, GA | 488,800 | 26.2% | 61.7% | 60.4% | $66,657 | $61,980 |
| WDSM | Sound Off with Brad Bennett | Duluth, MN | 85,195 | 41.3% | 11.7% | 9.1% | $55,819 | $60,434 |
| WTAQ | John Muir Show | Green Bay, WI | 104,565 | 52.8% | 31.3% | 19.7% | $49,029 | $64,458 |
1 Population and race/ethnicity data are from 2019 American Community Survey 5-year estimates. Income data are from ACS 2019 1-year estimates. Percent people of color is defined as percent not identifying as non-Hispanic white alone.
2 www.usatoday.com/in-depth/graphics/2020/11/10/election-maps-2020-america-county-results-more-voters/6226197002/. For Anchorage, Percent Trump support reported is for entire state since Alaska does not have counties (and information is not provided in the ACS estimates by borough. Anchorage is in Anchorage Borough.). Counties are as follows: Billings, MT, is located in Yellowstone County; Twin Falls, ID, is in Twin Falls County; Fargo, ND, is in Cass County; Rochester, MN, is located in Olmstead County; Atlanta, GA, is located in Fulton County with parts of the city extending into DeKalb County; Duluth, MN, is located in St. Louis County; and Green Bay, WI, is located in Brown County.
My logic of comparison was to focus on this show, then compare the content with shows hosted by White men in other states that were also broadcasting to White, rural, northern, and conservative audiences (Billings, Montana; Twin Falls, Idaho; Anchorage, Alaska; and Green Bay, Wisconsin). I wanted to know what patterns in these understandings were common across White, rural northern communities. I also compared these understandings to those I heard on less conservative shows broadcast to White, rural, and northern communities, in order to illuminate the partisan and ideological nature of the patterns (i.e., a Minnesota Public Radio statewide talk show; a center-left show broadcast out of Fargo, North Dakota, hosted by Joel Heitkamp, the brother of former Democratic US Senator from North Dakota Heidi Heitkamp). Finally, I contrasted these patterns to the way a Black female host targeting an urban, southern, and Black audience (in Atlanta) and her callers talked about George Floyd’s death and ensuing protests as a most different comparison case, to help illuminate the distinctiveness of the understandings in the White, rural, and northern communities.
Floyd was killed on May 25, 2020. These shows began discussing his death on the morning of May 28th, after demonstrations turned violent in Minneapolis. I listened to entire broadcasts of the shows on this and the following several days, as well as broadcasts in the preceding months, on the day after the November 3, 2020, presidential election, and on the morning after the January 6, 2021, insurrection at the US Capitol, to deepen my understanding of the contexts of these talk radio on-air communities.
As I listened to a show, I typed transcripts of what was said and noted observations on the tone and voice characteristics of callers. (The RadioSearch tool created machine transcriptions, but they were not sufficiently accurate for my purposes.) I periodically compared transcripts across stations and wrote memos about the patterns that I was noticing. When I completed my listening, I read through the transcripts station by station, starting with WDSM and worked out geographically through the other Right-leaning shows. I then analyzed the transcripts from the contrast shows (from Fargo and Atlanta).
As I read through the transcripts, I examined whether and how conversations about the economy, economic concerns, and economic inequality arose, and looked for the connections people made between economic inequality and race or racism. I recorded these observations in a memo along with excerpts from the transcripts that had led me to these conclusions.
It did not take long to notice that detouring away from race or racism was more prominent than conversations about race or racism. I therefore investigated how people steered each other away from racial and economic inequality and what the conversations suggested about hosts’, listeners’, and callers’ concerns and understandings. Three major characteristics of the connection between race and economic inequality emerged: (1) the avoidance of race and racism, (2) a shifting of the conversation to blame political opponents, and (3) an assertion of values that justified these shifts.
Empirical Findings
The local talk radio shows I listened to clearly communicate identity with a particular place and the people living there. The stations air these shows in a line-up of nationally syndicated shows, such as The Rush Limbaugh Show, The Sean Hannity Show, The Mark Levin Show, The Savage Nation, and The Mike Gallagher show.Footnote 5 The Fox news stations’ local talk shows reference, quote, and rebroadcast some of the content from these national shows. Even when the hosts and callers on the local shows talk about national issues, they do so while referencing their local community. The hosts and their producers (who are often a part of the conversation as well) refer to their histories in the community. Hosts greet callers with their first name and place of residence (e.g., “Hello, Sandy from Silver Bay!”) The advertisers tend to be local and are sometimes guests on the shows. (The Duluth show regularly welcomed representatives of the Benna Ford car dealership, Chad Walsh from the Dead On Arms shooting range, or “Lady O” from Lady Ocalat’s Emporium [a fortune-telling business]).
Regular callers are important parts of the shows’ communities (Brownlee and Hilt Reference Brownlee and Hilt1998). The shows celebrate first-time callers on the air and in online descriptions of the broadcasts’s content.Footnote 6 Callers influence the agenda and how it gets discussed, even when the host pulls in another direction. Such tension is the exception, however. Consensus is the norm, and callers are generally treated warmly, and sometimes even memorialized. On the Duluth show, Bennett and producer Kenny Kalligher made a point of honoring local veterans who had recently died. On one such occasion Bennett recalled a deceased listener, Thomas Fontaine, from “up in Grand Moret [Minnesota],” explaining that he was a Vietnam and Desert Storm veteran who “listened to us all of the time…. He had crazy-glued the dial on his radio so you couldn’t move it off of WDSM.”Footnote 7
Each of these shows is a community unto itself and exudes a tone of familiarity. For example, when a caller gets dropped, hosts use the airwaves to speak directly to that person. “Mary, you call back. I hit the wrong dol garn button and I will get you on. I promise,” the Fargo host said one morning.Footnote 8
As I noted earlier, the talk radio audience is considerable and national-level politicians clearly believe these shows have an important reach.Footnote 9 High-profile candidates and their surrogates made appearances on these broadcasts during the 2020 election cycle. The host and the producer of the Duluth show talked throughout the 2020 campaign about getting “the big guy” (Trump) on the air and were disappointed when the campaign sent “only” his son Eric Trump instead. Aaron Flint, the host of the Billings, Montana, show, welcomed US Senator Steve Daines onto the air on June 3, the morning after the Montana primary elections. On May 29, John Muir enthusiastically welcomed gun rights proponent and Trump supporter Ted Nugent onto his Green Bay show.Footnote 10
Although the conservative shows are often supporting Republican candidates, they do not simply toe the line, at least in the early stages of an issue. For example, Bennett, the Duluth show host, supported the use of masks early in the pandemic before doing so became a partisan issue. He also occasionally resisted extreme right-wing or conspiratorial comments from his audience. For example, on January 11, 2021, after the insurrection at the US Capitol, he lectured that one of the rioters, the “guy with the horns” was not in fact part of Antifa, the antifascist protest movement, as some callers were alleging. The libertarian host of the Twin Falls station, Bill Colley, likewise admonished a caller for suggesting that the reaction to the storming of the Capitol was overblown. One caller asked, “How many police were injured when Antifa did their riots?” Colley shouted back, “So that makes it OK?! What the hell is wrong with you?!! Because stupid people on the left do it?”
Caller: No I’m just saying it is being blown out of proportion.
Colley: Oh my God, there were people storming through the Capitol, breaking windows!! People are dead!!
These hosts did perpetuate conspiracy theories at times. Even after Bennet lectured that the man in the Viking helmet was not part of Antifa, he went on to argue that “There are some real things happening here that are just as bad as some of the stuff that is being made up … [for example], the attempt to destroy free speech…. In the last few days … almost every one of the [social media] websites of any kind … has limited or cut off anything conservative. They have even killed the platform for one of the conservative websites out there [Parler]. Does this sound like China? A little bit!” Also, Colley claimed that the understaffing and underresourcing of security personnel on January 6th might have been intentional to justify a subsequent tightening of security at the Capitol.
Although these shows deflected attention away from racism, the hosts made a point to distance themselves from the labels of racist or White supremacist (see Bonilla-Silva Reference Bonilla-Silva2018). During the first presidential debate in the 2020 general election, Trump refrained from taking moderator Mike Wallace’s invitation to denounce White supremacist groups, telling them instead to “stand back and stand by.” The next morning, Bennett defended Trump, arguing that Wallace was wrong to insinuate that Trump had never condemned White supremacists. When Floyd was killed, host Muir in Green Bay argued it was ridiculous to tie Trump and his rhetoric to the actions of the officer who had knelt on his neck.
Trump is not a racist. The overwhelming number of Trump supporters are not racist…. We can’t help it if there are isolated individuals or groups who are racist who support the Trump presidency…. The reason that they falsely demonize Trump and Trump supporters is because they don’t actually have anything on Trump. Trump, even though they don’t want to admit it, has been immensely successful for the United States on countless fronts for 3 plus years now. He has done a great job for all Americans, including African Americans…. This is leftists on the political left trying to control African Americans, politically.
Various hosts and guests talked about the importance of unity and a focus on commonalities over differences.Footnote 11 However, this attention to unity was typically a desire for less disruption to the status quo, not a desire to unify through attention to difference – a common strategy among Whites confronting the reality of racism (Cramer Walsh Reference Cramer Walsh2012). One broadcast that laid this out plain and clear was Bennett’s show on January 8, 2021, after the US Capitol insurrection. Within minutes, he and his producer went from lamenting attention to divisions or subgroups to deriding pictures of interracial marriages on TV.
I am getting so sick and tired of being fed— spoon fed— that we all have to intermarry. Every time I watch a commercial on TV I see a white guy married to a black guy or a black woman or a white woman married to a black woman and mixed racial kids. That’s not a hundred percent the way the world works, it just doesn’t. But it seems that there is an effort to force us to accept that as a way of life, that we are going to all become a grey society or a beige society. Who has made that decision that every couple on TV needs to be biracial?
Recognizing the Injustice of Floyd’s Death, Then a Shift Away
It was in these contexts, in which the Right-leaning hosts distanced themselves from racism while preferring to deny it exists, that they reacted to Floyd’s murder. On each of the Right-leaning shows, the hosts’ initial response was a recognition that his death was the result of a horrific crime. “As far as George Floyd, I think it was a very serious crime that was committed against him,” Bennett in Duluth said.Footnote 12 In Green Bay, Muir was similarly blunt. “Based on what this show has seen to date, regardless of the motive, what happened appears to be totally unacceptable.”Footnote 13 In Anchorage, a guest on the show was even more direct: “Somebody should have walked up to that cop and shot him right there.”
However, even though these hosts recognized the injustice of the killing, they each quickly detoured away from the possibility that the incident was reflective of a broader pattern of racial injustice. Many of the hosts interpreted the murder as the case of a “bad apple” law enforcement officer. Even when callers suggested racism might be involved, the hosts turned attention back to the officers’ individual behavior. On the Green Bay show, Muir read a text from a listener that “Minneapolis obviously has a culture of hate within the police and it is being reciprocated within the community but I will never understand riots.”Footnote 14 Muir’s response was that Floyd’s death was a result of “some terrible apples within the police dept.” The next day, caller Jim in Green Bay (who may have sent the text the day before), said,
An issue that is being overlooked … the argument is that you have a few bad apples … I agree, but what are the chances that in the entire Minneapolis police department you are going to get 4 or 3 to overlook and 1 to commit the crime? I guarantee that if you hand-picked 3 others they would have done the same thing … I have relatives who are officers in the Green Bay area so I am very much pro law enforcement. I agree to pretty much everything you said so far, but I just wish people would quit saying it’s just a few bad apples. Because I think it’s worse in some police departments than we want to admit to and we have to as a society, we have to look at that.
Nevertheless, Muir gave the “bad apple” response. “This show does not want to speculate. We don’t know how many bad apples are out there. …officers that were there they certainly failed. Inexplicable, inexcusable. There certainly are bad apples in that field.”
Asserting that the officers involved were just bad apples enabled the hosts to refocus attention on the protestors and discount the possibility that they were reacting to racism. They criticized the violent protests and claimed the protestors did not actually care about Floyd’s death. “When I see injustice I don’t go out and loot the local Target store. How does that bring you justice in any way?” Colley in Twin Falls asked.Footnote 15 In Billings, host Flint had his own string of questions. “Everybody is criticizing what [officer Chauvin] did, so why are you burning down police precincts, AutoZones, cars? Why are you spraying a woman in a wheelchair with a fire hydrant? Why are you stealing TVs? That is not protesting, that is rioting and nothing to do with what this cop did.”Footnote 16 A caller, Herb from Sheboygan Falls, asked Muir on his Green Bay show, “That man murdered that man … [but] that being said, why with the economy the way it is would you burn down an AutoZone and loot a Target? Their whole message gets distorted and lost.”
Herb’s comment acknowledged the economic challenges that many people were facing. Such comments were not unusual on these shows. But Herb, like others, did not talk about these economic struggles as shared across racial groups. Instead, he brought up economic concerns as a reason to ridicule the way people in Minneapolis were responding to Floyd’s murder.
Blaming Democrats
As the days of protests continued, the hosts not only deflected attention away from racism, they deflected blame for the events onto other targets. Occasionally, the hosts suggested that Floyd was intoxicated and therefore to blame for his own death.Footnote 17
More prominently, though, hosts focused on Democrats as the main target of blame. On the Billings, Montana, show, caller Monte in Livingston claimed that Floyd’s death was part of a pattern of police shootings in Minneapolis.Footnote 18 Host Flint agreed that Chauvin had crossed the line, but then he quickly deflected blame onto Democrats. “Senator [Amy] Klobuchar, Democrat presidential candidate, failed to hold [Chauvin] accountable when she was a prosecutor.”
Others deflected blame onto Democratic presidential candidate Joe Biden. Bennett in Duluth said, “You can hear Biden trying to blame this on the Trump administration. What is missing here? Biden has been in office 44 years, Schumer, Pelosi, the lovely Maxine Waters for 48 years, and yet they blame America’s problems on President Donald Trump who has been in office for about 3 years.”Footnote 19
Another common version of Democrat-blaming was to point out that the riots were happening in cities led by Democrats. On Bennett’s show, Sandy from Silver Bay said, “Everyone agreed the officer made the wrong choice. You have a constitutional right to peaceable protest. However, you do not have the right to destroy anything. Now you are breaking the law and need to pay the consequences. Now, Brad [referring to the host], as far as I can see a lot of this is taking place in Democratic states and those with sanctuary cities.”Footnote 20 Later in the show Bennett brought on the Republican candidate for the Minnesota US Senate seat, Jason Lewis.Footnote 21 Lewis asserted, “Look, this is a colossal failure of leadership, and it is no different than their colossal mismanagement of COVID and nursing homes or their mismanagement of the inner cities for decades upon decades. We have had liberals control – left-wing politicians, liberal Democrats – control the most urban areas and now we’ve reached this breaking point.”
The hosts went beyond accusations of negligent leadership. Some of them claimed that Democrats were actually fueling the riots to improve their chances of a Biden win in November. On June 2nd on Bennett’s show, caller Todd from Duluth suggested, “Pelosi says she’s going to impeach again, and Biden and the Democrats are going to bail the demonstrators out of jail. Looks like they are funding all of this. Looks like they are going to burn down our cities and destroy our country.” Bennett responded with a theory.
If for example I were a conspiracy theorist nut job I would say, “Let’s see. We’ve got the Democrats who have a candidate who probably doesn’t have much of a chance of winning against Donald Trump with the economy as robust as it is and with so many people working, how would they possibly be able to kick the stool out from under President Trump? How would they possibly be able to do that?” Well, uh so Joe Biden is raising his hand and saying, “We gotta find a way to destroy the economy! Well how we gonna do that? Well, uh how ‘bout we get a pandemic? And we shut the whole country down? Nobody can go to work. Everybody’s gonna lose their jobs, they gotta wear masks. Oh! And then on top of that if that isn’t good enough if that doesn’t kick ‘er down enough then how ‘bout we have a mass riot and vandalism, we turn Antifa loose and uh destroy oh, I don’t know, how about like Minneapolis, how about we destroy 600 buildings in downtown Minneapolis/ St. Paul in about a 3-day period? Burn ‘em all down, wreck ‘em, destroy ‘em? That oughta pretty well kick the economy in the rump, don’t ya think?”
BennettFootnote 22 and Flint in BillingsFootnote 23 talked about an international campaign among liberals to raise money to bail out protesters. They were treating the protests as a coordinated strategy by Democrats to win the presidential election, not as an outcry against racial injustice.
At least one host made an explicit claim that such behavior was part of a long-term strategy to use race to promote socialism. On June 1, host Colley in Twin Falls played a clip of Harvard Professor Cornell West talking with host Anderson Cooper on CNN, and then launched into a narrative that wove together the Democrats, socialism, and race. The clip he played was extensive and included West saying,
I thank God that we have people in the streets. Can you imagine this kind of lynching taking place and people are indifferent?!… You know what’s sad about it though, brother, at the deepest level? It looks as if the system cannot reform itself. We have tried Black faces in high places. Too often our Black politicians, professional class, middle class become too accommodated to the capitalist economy, too accommodated to the militarized nation state, too accommodated to the market-driven culture…. And what happens? What happens is we’ve got a neofascist gangster in the White House who really doesn’t care for the most part….Footnote 24
Colley interpreted the clip this way: “So he is talking like a Bolshevik. Look, I can’t give you my property. You burned it down, for crying out loud!”Footnote 25
In these commentaries, the hosts were not only deflecting attention away from racism, but deflecting attention away from inequality. Bennet’s remarks associated Democrats with both racial unrest and with manufactured economic challenges. Colley discounts Cornel West’s system-level critique as socialist. This act of equating Democrats with the protests in response to Floyd’s death makes it inappropriate to even consider the relationship of racial injustice to economic concerns.
Reverse Racism and the Reframing of Victimhood
The Right-leaning hosts did not completely ignore the issue of racism. However, they did not let it remain the focus of attention for long, except to claim that it is Whites who are the targets of hate. Muir in Green Bay stated matter-of-factly that “BLM is a VERY racist group” whose members “don’t actually care about the injustices that have been done to people – they are just there to forward their agenda and personally profit.”Footnote 26 On Bennett’s show, caller Tom from Port Wayne put it this way:
I’m very sad for the country…. Our country is in great peril. It is literally in some places on fire. We have people who were penned up for a long time through this stay-at-home and have lost their minds. They have envy and hatred of the majority of people in this country…. We have never had a moment in which people have such zeal and hatred toward others in the country.Footnote 27
While some of this concern about reverse racism was fear of hatred toward Whites, some of it was anger over a perception that racial minorities were treated better than Whites. This was especially clear on the Flint show in Billings. Elena in Philipsburg complained that nobody rose up in protest “when the government slaughtered the people at Waco or at Ruby Ridge”Footnote 28 On June 3, Flint brought up new legislation in New York that was “making it a felony for officials to share illegal immigrant driver data with U.S. customs officials.” He took this as a sign of injustice toward law-abiding citizens, presumably Whites. “To me the rioting that is going on in this country is so similar to the illegal alien story where they want to create all these rules and these laws to crack down on the legal and the innocent, us, but then they want to protect people who are acting illegally.”
Similar perceptions of injustice and victimhood laced comparisons the hosts drew between the January 6 insurrection and the George Floyd protests. Bennett in Duluth noted that the Minnesota attorney general intended to prosecute any Minnesotans who took part in the insurrection. A caller asked, “But took part how? Broke windows, or just there? You would want people who did violence. But they didn’t do that for the other riots this year.” Bennett agreed: “Ok to uphold the rule of law, but let’s do it evenly across all political leanings,” suggesting a double standard in which liberals taking part in the Floyd protests were not prosecuted although conservatives storming the US Capitol were.
In Twin Falls, Colley voiced similar complaints and drew a connection to a rural versus urban divide. In the days after Floyd’s death, he talked about the protests that had erupted in Portland and Seattle. He talked about this as a case of urban lawlessness contrasting with rural common sense. He and a caller joked that people in the nonmetro areas were armed, and would eventually be the last ones standing. A caller said, “Antifa types and these entitled little rich kids showed up in Washington [state], doing it in Tacoma, ran into about 60% of the armed citizens of the town and decided to go back to Seattle to burn it down.” Colley responded, “One side has 60 rounds of ammunition, the other doesn’t know which bathroom to use [referring to debates over transgender bathrooms]. [laughs] The people who can defend themselves, accurately anyway, are just regular Americans in flyover country, which is why you’re not going to see [those protests] happening here.”Footnote 29
Hosts and callers framed themselves as victims by claiming their communities were treated unfairly, thereby diverting attention away from racism. Those claims were part of a broader perspective that demographic change was making them the victims of injustice, in which they were not getting their fair share of attention, resources, and respect. One manifestation of this was that these shows occasionally lamented the loss of a whiter time in the United States. Senate candidate Lewis mentioned on Bennett’s Duluth show “the same liberal policies that have turned the Twin Cities into something our grandparents wouldn’t recognize.”Footnote 30 Caller Sandy in Silver Bay said, “I look at what is happening right now, this is not the United States” and “On our money it says In God We Trust. Where are you people? You are not trusting God.” She, too, was lamenting her image of a past society.Footnote 31 Host Bennett conveyed a similar kind of nostalgia when he said, “This has now become a story of how much can we steal, how much can we burn? ‘Who’s George Floyd? [he said, sarcastically quoting hypothetical protestors.] Let’s burn this place … Let’s break in and steal everything they got.’ Is this Minnesota we’re looking at? This looks like Detroit or some other community! It does not look like Minnesota anymore.” He read a note from a caller on the air that expressed a similar sentiment: “I am so shameful of the people of this state…. No place deserves this chaos. We are so disheveled in what is happening. So shameful, disgusting. What happened to Minnesota?”Footnote 32
When the hosts gave voice to concerns about their geographic and on-air communities being victims of unequal and unfair treatment, they drew attention away from injustices to people of color, or even injustices, such as economic inequality, that they might have shared with people of color.
Momentary Expressions of Empathy or Solidarity
There were moments on these shows during which the hosts and callers expressed empathy with people of color, but they were brief. For example, on May 29th, Bennett at WDSM said,
What do we hear often from low-income minority type people about their housing in certain developments? We hear, “There’s—We don’t have enough low-income housing. We need more low-income housing. We need better housing, this housing is so old we need better housing.” And I kinda feel for a lot of them many times [emphasis added]. Until I saw this today. One of the buildings that burned last night that was torched to the ground by one of these supposed people that are concerned about what happened to George Floyd, was a under-construction, affordable housing development that was burned to the ground…. And now what will we hear? “Well, we don’t have enough low-income housing. We don’t have enough housing for us.” You just burned it to the ground!
A few days later Bennett again shifted from empathy, this time using the topic of food deserts. “You know how minorities always say they have a food desert? Well, this Aldi grocery store was extensively looted.”Footnote 33 And then the next morning, he launched into a similar complaint.
So I think that when we look at the big picture of what is going down here or what has gone down, we have to be very attuned to the fact that a lot of the damage that was created in this community, a lot of the heartbreak, and a lot of the people in the community that are going to suffer now as a way to find food, find clothing because … not only did they lose food stores that were there but a lot of the stores that were damaged were also stores … that they bought clothing at … and it has just become very, very difficult now for some of these areas to get the kinds of support that they need. So when you start sometimes by protesting, you sometimes leave your own communities unprotected, and you sometimes hurt your own people by what you do in that community [emphases added].
Sometimes Bennett’s language and that of his callers went beyond the use of an ambiguous “you people” to calling people foreigners.Footnote 34 This was part of a pattern of othering in which the “them” according to these shows was a vast anti-identity that included urbanites, Democrats, liberals, people of color, and foreigners. They were treated as a general outgroup of un-American residents of the United States (Finkel et al. Reference Finkel, Bail, Cikara, Ditto, Iyengar, Klar, Mason, McGrath, Nyhan, Rand, Skitka, Tucker, Van Bavel, Wang and Druckman2020). Caller Don spelled this out from his cell phone on June 8th on Bennett’s show. “Defunding the police department is the next step in a liberal experiment that is going to go wrong. Minneapolis is a sanctuary city. We brought in refugees from all different countries, and we’ve lived under their social liberal rules, and now it has gone bad, and along with the bigger cities, New York, L.A.” After a little back and forth with Bennett, he added, “[Floyd] was no saint, and the cop was no saint, but to demonize – to say that there is systemic racism in the Twin Cities, that’s a failure of how Minneapolis is run. It has nothing to do – nothing other than a reflection of the policies they continue to do to divide people by. We bring in people you know, they support different laws. Moslems have their view of how they think things should be run, they came from a different country. Instead of adopting our rules, they want to change everything.”
Comparing to Talk about Floyd’s Death on Left-Leaning Shows
To help illuminate the perspectives I was hearing on these conservative shows, I turn now to content from the three Left-leaning shows. I sought to understand whether the hosts’ and callers’ comments considered a connection between the economic concerns and racism. Did their conversations around the Floyd murder and ensuing events touch upon economic concerns among Whites and people of color? Did they raise a different kind of connection between racism and economic concerns or inequality?
The show broadcast from Atlanta targeted to Blacks made explicit connections. The host, Wanda Stokes, talked about the riots resulting from Floyd’s murder in a way that made it clear she and her audience were well aware that people were angry about the racial and economic injustices experienced by Blacks in Minneapolis and elsewhere. She did not have to explain that people were angry. Instead, she focused on how people should be channeling their anger.Footnote 35
Likewise, the Minnesota Public Radio show broadcast out of Rochester, near Minneapolis, addressed Floyd’s murder as part of a pattern of injustice to Black Americans. One morning on MPR, civil rights attorney and leader Nekima Valdez Levy Armstrong was a guest. In contrast to the discussions on Heitkamp’s show, Armstrong did not find it necessary to accommodate Right-leaning perspectives. “The system” she said, “is rigged when it comes to justice for African Americans. That has been the case since the system was developed. Cries for justice often fall on deaf ears just like the cries of George Floyd. That is very symbolic of what we go through day in and day out.” At one point in the interview, the host said, “There is a tension between the process [for bringing the officers involved to trial] and the need for swift justice.” Armstrong responded, “The tension resides in the minds of white America. For Black Americans it is very easy to look at the video and to know that something unlawful happened.” Armstrong also challenged the idea that the rioting was inappropriate.
I don’t want any more lives to be lost but the reality is that this comes with the territory of people finally being fed up with the status quo, of no accountability. When it gets to this level of frustration, this combustible, you cannot predict or control the outcome. I’m not sure why people are so surprised that it happened here…. Given the volume of people who were present, people who are so outraged, we can’t control what they do as a result of their frustration. We are worried about repairing property damage. We need to be worried about the damage that has been done to communities from one generation to the next for maintaining the status quo and allowing police to kill with impunity. That is the real problem.
These two shows, targeted to urban audiences, made clear links between racism and injustice. However, in their broadcasts I analyzed, I did not hear emphasis on the manner in which Whites as well as people of color might benefit from greater redistribution.
I turned to the Fargo, North Dakota, show to listen for such a connection. This show’s audience was predominantly White and rural. It airs on an agricultural news station that announces crop prices and weather forecasts throughout the shows and broadcasts ABC News.
The show’s political orientation was moderate to Left-leaning. Although host Heitkamp’s sister is a former Democratic US Senator and Fargo is more liberal politically than the rest of the state, the station’s lineup includes an array of conservative-leaning nationally syndicated talk show hosts.
Some of the conversations on this show resembled those on the conservative shows. For example, the hosts and callers complained that the stay-at-home orders were unfair to relatively rural places like theirs, where the COVID-19 virus had not yet spread. Even on the morning of May 29th, as the news of Floyd’s murder was spreading, Heitkamp lamented that attention might be diverted by the murder and protests away from the struggles Fargo and other communities tuning in were having with the impacts of the pandemic. This was despite the fact that many of Heitkamp’s listeners were living in Minnesota, the state of Floyd’s death, since Fargo is located on the border of Minnesota and North Dakota. On the morning of May 29th, Heitkamp said, “With COVID there is a lot going on. Just understand we are going to be on this Minneapolis story, but lots going on, as this whole COVID thing happens. I hope the governor [of Minnesota] doesn’t give all his attention to Minneapolis because in outstate Minnesota the policies the governor has in place are crippling. They are really hard on certain businesses.”
Such comments about the competition for attention between more rural communities and urban places were common on his show. On the morning of May 29th, Heitkamp’s listeners were also reeling at the time over the death of a White police officer in Grand Forks, North Dakota, who was shot and killed while on duty. Heitkamp lamented that although this was a tremendous loss to their local community, it would never be noticed by the national press. “I brought that up to a national reporter yesterday. Do they even know that we have an officer who died? Do they know what happened?” At times like this, Heitkamp’s resentment about the attention that urban areas received resembled that of the conservative hosts.
Heitkamp’s commentary was different from that of the more conservative hosts. He urged his listeners to have empathy across prominent divides. He encouraged them to notice that it was possible to mourn the death of a White police officer and a Black man killed by an officer. “You can have empathy. You can care and be heartbroken about what happened in Grand Forks and still question what happened in Minneapolis. You can be that person.”Footnote 36
Heitkamp also contrasted with the conservative hosts in his direct consideration of race and whiteness. He noted that his audience members likely had little experience with people who were not White. He said that the stations that carry his show in Canada, Minnesota, South Dakota, and North Dakota “don’t have a diverse of a culture so they might not know the sheer logistics of the neighborhoods where the riots are taking place.”Footnote 37 The local weather and sports reporters on his show also talked openly about racism.
Although Heitkamp considered the role of racism and expressed more empathy with the people protesting Floyd’s death, his ability to consider the similarities in economic challenges faced by Whites and people of color was constrained by his audience and by his own rural versus urban frame. For example, some of his callers suggested Floyd was partly to blame, but Heitkamp disagreed, in an instructive rather than chastising manner. For example, a caller said, “I just wanted to mention this guy [Chauvin] should be charged with murder, but what if [Floyd] died of a heart attack? We need to wait and see the results of the autopsy. I think you said he clearly murdered the guy.” Heitkamp cut the caller short, saying, “I said he clearly caused his death. If I had my arm around your neck and you suffocated would I be charged?”Footnote 38
Heitkamp resisted the callers’ attempts to move away from the injustice of Floyd’s death, but he nevertheless moved quickly to more common ground, such as claims that the rioting was unjustified, or their shared support for police in general. In the days after Floyd’s death, Heitkamp regularly commented that the looters and protestors using violence ought to be charged, taking a tough-on-crime stance that resembles the comments on some of the conservative broadcasts.
Some of his audience members seemed to believe he was not doing enough to counteract conservative narratives. On May 29th, he read a text from a listener sent after others on the show had questioned the point of the looting. “One of you responded, ‘They tried peacefully kneeling and you all had problems with that, too’” (referring to the National Football League players’ protests during the playing of the national anthem).
However, other audience members questioned the support for the protests that he or others had voiced. Heitkamp relayed one story of such backlash. He explained that while he was broadcasting on the Saturday night after Floyd’s death, when protests had turned violent in Fargo (May 30, 2020), a listener had sent him a message. He recalled the message like this: “‘I don’t care. Those Black’ and then using the N word ‘should all be shot.’ And then he goes on and writes, ‘Any of our officers marching with them’ and then uses the N word ‘should be shot, too’.”Footnote 39
In these ways, portions of Heitkamp’s audience limited how much he could highlight common cause with people of color. Also, his own resentment toward the attention given to urban concerns constrained any move toward recognition of common cause across racial lines, even when the conversation was focused on economic affairs. On May 29th, one of his guests was a business leader from Morehead, Minnesota, a community just across the Red River from Fargo. They talked about the injustice of Floyd’s death, but the emphasis of their conversation was on the perception that the rioting and protests were taking attention away from the serious economic challenges facing small towns in the pandemic and the way the restrictions on opening up businesses, created with urban businesses in mind, were economically devastating. In other words, the show did not draw attention to the ways economic challenges are similar across different social groups and communities, but instead on the competition between rural and urban areas for attention and resources.
Heitkamp may have been encouraging his audience to have more empathy, but he was still in the business of maintaining, if not growing, an audience of listeners. Like the conservative hosts, his commentary and that of the callers and guests he welcomed on, had to resonate with a predominantly White audience. To varying degrees, these shows faced the tragedy of Floyd’s death by tapping into a set of widespread values that further inhibited the connection these shows made between racism and economic inequality or other shared economic concerns.
One of the more common values that hosts and callers invoked as they detoured away from racism was accountability. Heitkamp, like the conservative hosts, noted that, yes, the officers involved in Floyd’s death needed to be held accountable, but then said the rioters needed to be held accountable as well.
Heitkamp’s emphasis on a respect for law and order was common on the conservative shows as well. Immediately after the storming of the US Capitol, many hosts denounced that violence, as they denounced the violent protests against Floyd’s death. Bennett in Duluth opened his broadcast the day after the insurrection by saying that yesterday was an “absolute disaster” in Washington, D.C., and laid out his law-and-order conception of good citizenship.
First of all, some of the TV stations tried to portray this as Trump patriots who had gone amuck. Let me just tell you that in my estimation patriots enlist and defend their country. They work hard, they do their best, raise families, good families, help their neighbors, perform civic duties, they grit their teeth and pay their taxes but they do pay. They show up and vote. They compete and whether they win or lose they do both with grace. They do not storm their Capitol over a lost election…. Hopefully they will be arrested and they will be jailed.Footnote 40
Likewise in Twin Falls that same morning, Colley took his listeners to task for thinking that the Capitol Police were traitors. He said he had been watching a video of the officers at the Capitol being stampeded.
Some people were screaming ‘traitors!’ What did you think they were going to do? March in with you and hold members of Congress hostage?! Some of you are saying they should choose their side. You expect them to lose their jobs in this tough economy? You think they should sacrifice their job but you shouldn’t?!… Those Capitol officers, their job is to protect that building and the people inside it. That is their mission.
Although one can imagine how referencing widely shared values could help draw attention to shared concerns, the manner in which hosts talked about them reinforced divides. For example, especially on the conservative shows, discussion of patriotism portrayed real Americans as White Christians. Also, the shows celebrated civic engagement in their communities, but demonized government while doing so.
The shows regularly emphasized that local businesses, organizations, and volunteers were the appropriate safety net for their communities, not government. In Duluth, Bennett and Kalligher criticized the enormous bill that the government was running up by sending out pandemic recession stimulus checks. But they applauded the fact that a local grocery store was handing out gift cards to “deserving” people, funded by donations from community members.
The shows conveyed a blatant reverence for capitalism and the free market. For example, on Bennett’s show in Duluth on June 1st, caller Don argued that what was going on in Minneapolis and in other cities was the failure of leadership in liberal cities, among Democrats, and the left-wing protestors. “Failure of these people to respect any type of authority. They chastise capitalism. I challenge any of these people if they would like to go to a third world country and ask these people if they would like to be involved in capitalism that supports all these people who can go out and protest.”
Discussion and Conclusion
The inability to understand and share the feelings of members of racial outgroups is a part of racism that dampens Whites’ support for redistributive policy. The local conservative talk radio shows I listened to for this study suggest that one of the ways this lack of understanding is perpetuated is by denying the existence of racism and by painting those who draw attention to racism as un-American. The hosts and callers justified deflections from the topic of racism while they reaffirmed beliefs in accountability, capitalism, and law and order. Broadcasts of these shows on topics other than Floyd’s death conveyed that the communities of these shows were understanding public affairs through a lens that emphasized these values as well as patriotism, Christianity, and aversion to big government. The way they did so conveyed that considerations of either racism or a greater role for the government in the economy (e.g., through redistribution) were anti-American.
The image of the archetypal American conveyed on the conservative shows, and on Heitkamp’s show, was that of a hard-working, flag-bearing, God-fearing, rural White male. This undermined empathy with people of color, and reduced the chances of recognizing that a broad swath of Americans are victims of economic inequality and are harmed economically by a lack of redistribution.Footnote 41 Associating Democrats with people of color and the ambiguous specter of socialism also made it seem ridiculous to even consider redistribution. These hosts and their callers claimed that Democrats had fostered the violent protests after Floyd’s death to push their political goals of “Bolshevism.” In this perspective, communities were not getting their fair share because of the lack of Americanness of people of color and their allies.
Notice what this means about the way the aversion to redistribution is intertwined with racism. In this interpretation, it is the Democrats who are using racism to achieve downward redistribution. This is quite the opposite of perceiving that it is the Republicans who are using racism to inhibit empathy to prevent such redistribution from taking place.
Whether or not this understanding is part of an explicit political strategy, this is a notable framing. It is different from what we would expect from a divide-and-conquer strategy, in which attention to the haves versus have-nots is redirected through a frame of makers versus takers. Instead, it would seem to result from an attempt to cast support for redistribution as a threat to the very fabric of the country. It also opens up the possibility for those opposed to redistribution to campaign to people of color and argue that the actors and organizations calling themselves allies are more interested in imposing socialism than in achieving racial justice. In other words, as this perspective gains traction, it creates an opportunity for the Republican Party to win votes among people of color.
Looking closely at the way political commentators like these talk radio hosts treat the possibility of redistribution reinforces what we know about the relationship between race or ethnic difference and support for redistribution more globally: that this relationship varies from country to country and seems to most centrally depend on how the political culture equates the presence of racial or ethnic “others” (e.g., immigrants) with concerns about the viability of social policy (Burgoon Reference Burgoon2014). How racism matters for the possibility of redistribution depends on whether and how people use racism in these debates. Some might use racism to stoke fear over the way resources are currently allocated (i.e., Brexit). Some might use racism by ironically deflecting away from the topic in a way that prevents recognition of shared economic concerns among people of a wide range of cultural backgrounds.
The fact that the use of racism to prevent redistribution in the United States is a centuries-old story might suggest that this is not likely to change any time soon. But I draw your attention back to one of the Left-leaning contrast shows, the Joel Heitkamp Show, broadcast out of Fargo, North Dakota. There are currently spaces in American political culture in which people are actively struggling with the archetype of the true American as a hard-working, flag-bearing, God-fearing, rural, White male, rather than insisting on the defense of this image. It is notable that the shows I investigated, except for the Atlanta show, took place in the North, which has lagged behind the South in coming to terms with the legacies of slavery (Bartels and Cramer Reference Bartels and Cramer2019). We should pay attention to communication in which people are actively struggling with the notion that real Americans are White Americans, because such moments may be a source of political change. Public opinion scholars have famously taken manifestations of ambivalence as signs of civic incompetence (Converse [1964] 2006). But maybe instead they should be taken as signals from the public that a reckoning of their competing values and commitments is in order (Hochschild Reference Hochschild, George and Hanson1993, 204–206).
These occasions of ambivalence are also a caution against concluding that the processes of understanding that we witness on these shows are the act of members of the audience adopting the talking points fed to them by the local show hosts, national show hosts, or a shadow set of political elites generating the shows’ content. Yes, there is a sharing of arguments in an apparently concerted fashion, particularly among conservative media outlets. But these arguments gain traction because they resonate with the experiences and understandings of the audience. The expressions of ambivalence are reminders that people are active processors who are guided by elites, but nevertheless have minds of their own.
Heitkamp’s discussion of racism took place in a context in which rural consciousness was common. He regularly stated that policies are made with major cities in mind. He reinforced the idea that his listening areas were neglected. The avoidance of racism we hear in these broadcasts is part of a perspective in which it is these nonmetro communities and the people within them who are the victims, not people of color in the cities. Through this lens, people are perceiving that they are not heard enough by policymakers and that those who are heard are people of color who are allied with those they believe are in power, wealthy liberal urbanites.
In this way, people justify deflecting attention away from racism and away from the possibility of recognizing the ways in which their struggles are similar to those in larger metropolitan areas. When rural Whites understand economic policy this way, through a zero-sum framework in which listening to people of color comes at the expense of listening to people like themselves, it is not surprising that participants in these shows deflect attention away from racism.
Class- and income-biases in political representation in advanced democratic systems have been documented in many studies. The interests and preferences of citizens in lower income categories or lower social classes are on average less well represented in democratic politics than the interests and preferences of middle- and upper- (income) class citizens. This finding holds both for representation in terms of political attitudes (Bartels, this volume; Giger et al. Reference Giger, Rosset and Bernauer2012; Rosset et al. Reference Rosset, Giger and Bernauer2013; Rosset and Stecker Reference Rosset and Stecker2019), as well as in terms of policy responsiveness, in particular social policies and redistribution (e.g., Elsässer, Hence, and Schäfer 2020; Mathisen et al., this volume; Schakel, Burgoon, and Hakverdian Reference Schakel, Burgoon and Hakverdian2020). In terms of implications and consequences, research on class-biased unequal representation has not only documented representation deficits, but also demonstrated detrimental effects of nonrepresentation, for example, in terms of political participation and alienation (Mathisen and Peters, this volume; Offe Reference Offe, Streeck and Schäfer2009).
Most of these studies assume that voters are aware of “objective” misrepresentation on these issues. However, given data constraints, this is oftentimes hard to study empirically, and we still have rather limited knowledge about the structure and extent of perceived representation. Rennwald and Pontusson (Reference Rennwald and Pontusson2021) thus advocate a “subjectivist turn” in the study of unequal representation, in order to better understand the extent, determinants and consequences of grievances caused by misrepresentation. We share their argument that voter perceptions of representation cannot simply be assumed, but rather need to be studied empirically. Moreover, we know little about voters’ perception of representation across different subfields of social and distributive policies. Hence, we need to know both: (a) whether citizens feel badly represented by “politicians” and the political system overall, and (b) whether perceptions of misrepresentation are also manifest when inquiring about specific and tangible welfare policy areas on which parties and elites can intervene. Moreover, placing the focus on how voters perceive representation on specific policy logics and fields sheds light on the complexity of these perceptions. There are reasons to believe that different dimensions of representation (on different principles and areas of social policy) are not identical, and that class differences in perceptions of misrepresentation may vary across them, with potentially relevant implications. If citizens in lower social classes or income groups, for example, perceive a lack of representation when it comes to pensions and unemployment (typical social consumption policies), and citizens of higher social and income classes perceive a lack of representation in the areas of education and childcare infrastructure, both groups of voters may be similarly dissatisfied with representation.
In this paper, we leverage newly collected data from the ERC project “welfarepriorities”Footnote 1 on voters’ social policy priorities, their perception of parties’ social policy priorities, as well as their evaluation of overall social policy representation to study these questions. We focus on social policy as a field that is key to the literature on unequal representation. Indeed, this strand of research has always had a tendency to focus – implicitly or explicitly – on fiscal and social policies when assessing representation and congruence; a focus that is reasonable given that the direct distributive outcomes of these policies could redistribute power relations and reinforce or mitigate patterns of unequal representation.
The chapter is structured as follows: In the next section, we explain why studying perceptions of misrepresentation matters, particularly in what concerns specific welfare policies. We develop hypotheses on the class biases in both party and systemic representation along different social policy dimensions. We also put forward different expectations as to how the presence of strong challenger parties on the radical left and/or the radical right can mitigate some of these perceptions of unequal representation across different systems. The subsequent section presents our data and measures. The analysis section studies class as a determinant of perceived representation by voters’ preferred party and the system overall on different policy dimensions and across different party-political contexts.
Theory
Distributive policies, and social policies in particular, have always occupied a special place in the study of unequal representation. Not only is social policy one of the key areas of state expenditures and material redistribution, it is also an area that affects social stratification and thus very directly links to those material inequalities that structure and exacerbate unequal representation. At the same time, however, social policy and redistribution have always been fields for which representation has been difficult to study because despite extensive divergences in material “objective” class interests in this field, actual attitudinal differences are not very large (Ares Reference Ares2017; Rosset and Stecker Reference Rosset and Stecker2019). Indeed, a wide range of public opinion surveys show that lower-, middle-, and even upper-class citizens on average tend to support expansive, generous social policies (Elsässer Reference Elsässer2018; Garritzmann et al. Reference Garritzmann, Busemeyer and Neimanns2018a; Häusermann et al. Reference Häusermann, Pinggera, Enggist and Ares2022), especially when they are asked for their unconstrained preferences. Hence, even though there is evidence of class bias in policy responsiveness, it remains hard to assess unequal representation in this field because of attitudinal convergence on social policy support in mature welfare states.
There is reason to think, however, that this seeming attitudinal convergence masks underlying differences in social policy preferences: a lot of the recent literature has shown that rather than in the level of support, citizens today differ more strongly in the type or field of social policy they prioritize: middle-class support is stronger for policies securing life cycle risks than for policies addressing labor-market risks (Jensen Reference Jensen2012; Rehm Reference Rehm2016); furthermore, while middle-class voters prioritize social investment, such as education and childcare much more strongly than voters in lower occupational and income classes, working-class voters prioritize income protection and social compensation policies, such as pensions or unemployment benefits (Garritzmann et al. Reference Garritzmann, Busemeyer and Neimanns2018; Häusermann et al. Reference Häusermann, Pinggera, Enggist and Ares2022). While insiders prioritize employment protection, outsiders prioritize redistribution and employment support (Häusermann, Kurer, and Schwander Reference Häusermann, Kurer and Schwander2014; Rueda Reference Rueda2005). And while working class and national-conservative voters emphasize the protection of national welfare states from open borders, voters in the upper-middle classes and left-libertarian voters prioritize the integration of immigrants and their inclusion in universal social protection schemes (Enggist and Pinggera Reference Enggist and Pinggera2021; Lefkofridi and Michel Reference Lefkofridi and Michel2014). All these conflicts and divergences certainly do occur in a context of overall strong support for welfare states (Pinggera Reference Pinggera2021); however, social policy conflict today revolves as much around prioritizing particular social policy fields than around contesting levels of benefits, redistribution, and taxation in general.
This is why, in this contribution, we focus on (unequal) representation in terms of social policy priorities: do parties (and politicians more generally) attribute similar or different levels of importance to reforms in different social policy fields as their voters? Do parties/elites set other priorities than voters in general and voters from lower social classes in particular? Recent research has emphasized the importance of extending studies of congruence and responsiveness beyond positional measures to also include accounts of the issues and policies that voters prioritize (Giger and Lefkofridi Reference Giger and Lefkofridi2014; Traber et al. Reference Traber, Hänni, Giger and Breunig2022). More importantly, we study these questions through the “subjectivist lens” of voter perceptions. Do voters feel generally unrepresented by “politicians” in terms of social policy? How do voters’ own priorities compare to the priorities they perceive all parties and their preferred party to have?
Answering these questions is relevant to evaluate the extent of the problem of unequal representation, as well as the expected effectiveness of potential remedies to misrepresentation in terms of policies or parties adapting their positions to voters.
Class and Unequal Social Policy Representation
What are our expectations for citizens’ differential subjective perceptions of representation? If subjective perceptions match the abundantly documented patterns of unequal congruence and responsiveness along income (see, among others, Elsässer et al. 2020; Giger et al. Reference Giger, Rosset and Bernauer2012; Lupu and Warner Reference Lupu and Warner2022a; Rosset et al. Reference Rosset, Giger and Bernauer2013), we would expect a class gradient in perceptions of representation: higher social classes should perceive better representation of their policy preferences on the part of political elites, in comparison to citizens in lower social classes. These perceptions could stem both from a class gradient in evaluations of input congruence (how well citizens think their preferences get voted into parliament through elections), as well as of output responsiveness (what decisions elected representatives take on policy). In fact, previous research on class-biased representation (Rennwald and Pontusson Reference Rennwald and Pontusson2021) has indicated that middle- and upper-middle class voters feel more congruent with the policy positions of parties and politicians than working-class voters, whenever the preferences of these classes diverge. Rennwald and Pontusson (Reference Rennwald and Pontusson2021) identify a clear class hierarchy in voters’ perceptions of being represented by politicians in their countries.
Alternatively, we can also expect that voters could perceive that their voices are equally heard, irrespective of their social class. Since our sample of cases includes many political systems with proportional representation (PR), from a perspective of input representation, these systems typically allow for a wider variety of points of view and preferences to be represented in legislative bodies (Blais 1991). Given the more diversified partisan supply, it should be more likely that individuals of different social classes find a party that represents their interests. Such increased input representation could mitigate perceptions of unequal representation overall.
Finally, a third competing expectation proposes that subjective evaluations of representation are higher among middle-class respondents due to parties’ incentives to mobilize electoral coalitions that include the median voter (Elkjær & Iversen, this volume). Even in PR systems, the process of forming government coalitions can move policy to a moderate compromise that is closer to the demands of the median voter. The centripetal pull during government formation could compensate for centrifugal patterns in electoral competition and bring policy closer in line with the preferences of the middle class (Blais and Bodet Reference Blais and Bodet2006).
Hence, we can formulate three competing scenarios about perceptions of representation: lacking differences in these perceptions by social class, perceptions of comparatively better representation by the middle classes, and perceptions of comparatively better representation by the upper classes. In terms of differences across institutional systems, the first scenario could be more likely to take place in PR systems due to the greater differentiation of the partisan supply and the accompanying input representation. The second scenario should be more likely in majoritarian systems, but could also emerge in PR systems due to the dynamics generated at the government formation and policymaking stages (Blais & Bodet, Reference Blais and Bodet2006).
Figure 13.1 indicates that when voters are inquired specifically about social policies – very much in line with previous research on class-biased subjective representation (Rennwald and Pontusson Reference Rennwald and Pontusson2021) – we observe a class gradient in perceptions of systemic congruence (i.e., perceived congruence between “citizens” and “politicians” overall), with these perceptions progressively improving as we move up in the social structure, from the unskilled working class, to the upper-middle class.
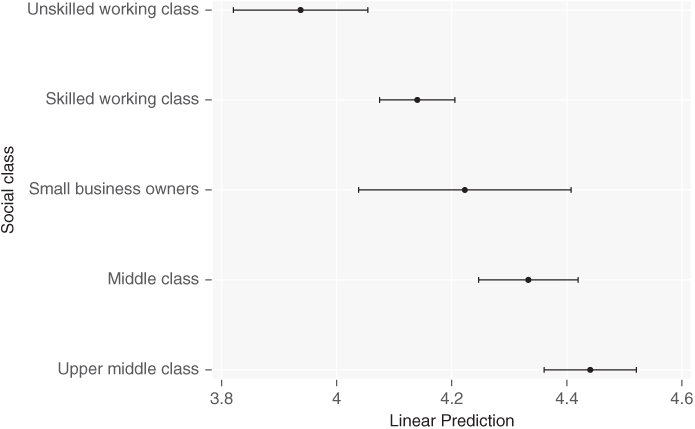
Figure 13.1 Social classes’ average predicted perceptions of systemic congruence on social policy
Notes: Class as a determinant of perceived systemic congruence. Estimates are based on linear regression models introducing controls for age, sex, trade union membership, and country-FE. The coefficients for all variables are presented in Table 13.A2 in the Appendix.
Figure 13.1 plots social classes’ average evaluation of the extent to which “political decision-makers share your (the respondent’s) views about which reforms in social policy are the most important” (as measured on a 10-point scale). This figure corroborates one of the central tenets of unequal representation studies: the upper classes are indeed more likely to perceive politicians’ (social policy) priorities as congruent with their own. The 0.5-point difference between the upper and unskilled class on this attitude amounts to approximately a fourth of the standard deviation of this variable. This class gradient in perceptions of feeling represented on welfare reform policies is comparable to the findings from Rennwald and Pontusson (Reference Rennwald and Pontusson2021).
This initial evidence of unequal systemic congruence substantiates the importance of addressing these perceptions in what concerns social policy. However, this general measure could be masking some substantial heterogeneity in perceptions of unequal welfare policy representation for two reasons. First, while this item captures voters’ perceptions of congruence on social policy generally (without referring to a specific logic or field), it could be conflating perceived policy misrepresentation with some general systemic dissatisfaction (Easton Reference Easton1975), which is usually more widespread among lower class citizens (Oesch Reference Oesch and Rennwald2008; Rydgren Reference Rydgren2007). Second, there are reasons to expect that perceptions of welfare policy congruence are likely to differ across social policy dimensions. In current welfare politics, the literature distinguishes in particular three areas of social policy reform where such class preferences and class perceptions of representation may diverge consistently and substantively: social consumption policies, social investment policies and welfare chauvinism. In these policy fields, voter preferences and party responses may well diverge in different ways.
Social consumption policies refer to those social policies that substitute income in the event of a disruption of employment (e.g., in the case of sickness, accident, unemployment, or old age). They denote the “traditional” passive income transfer policies of the welfare states that were strongly developed in continental Western Europe in the second half of the twentieth century (Esping-Andersen Reference Esping-Andersen1999). They may be more or less redistributive in their institutional design (depending on the extent to which they are universal, targeted or insurance-based), but they in general tend to equalize income streams between risk groups that relate to social class. For this reason, and because of the immediacy of redistributive effects, social consumption policies are most strongly prioritized and emphasized by working-class voters (as opposed to middle- and upper-class voters) (Garritzmann et al. Reference Garritzmann, Busemeyer and Neimanns2018; Häusermann et al. Reference Häusermann, Pinggera, Enggist and Ares2022). At the same time, the hands of political parties and elites to expand these social consumption policies significantly are rather severely tied by fiscal and political constraints. If anything, elites and governments have generally tried to consolidate (or, in some instances, even retrench) social spending in the main areas of social consumption (e.g., Hemerijck 2012). Hence, we would assume class-specific representation to be particularly biased against working-class interests in the area of social consumption.
By contrast, middle- and upper-class voters tend to attribute a decidedly higher importance to social investment policies than working-class voters (Beramendi et al. Reference Beramendi, Häusermann, Kitschelt and Kriesi2015; Bremer Reference Bremer, Julian, Häusermann and Palier2021). Rather than replacing income, social investment policies invest in human capital formation, mobilization, and preservation (Garritzmann et al. Reference Garritzmann, Häusermann and Palier2022), for example, via education policies, early childhood education and care policies, or labor-market reintegration policies. The stronger emphasis of middle- and upper-class voters – as compared to working-class voters – on social investment has been explained by different mechanisms, in particular the oftentimes regressive distributive effects of these policies (Bonoli and Liechti Reference Bonoli and Liechti2018; Pavolini and van Lancker Reference Pavolini and Van Lancker2018), differences in institutional trust (Jacobs and Matthews Reference Jacobs and Scott Matthews2017; Garritzmann et al. Reference Garritzmann, Busemeyer and Neimanns2018b), and higher levels of universalistic values among the middle class (Beramendi et al. Reference Beramendi, Häusermann, Kitschelt and Kriesi2015). However, the efforts of parties and governments to actually expand social investment policies across Western Europe have remained rather limited (Garritzmann et al. Reference Garritzmann, Häusermann and Palier2022) because of institutional legacies, fiscal and political constraints. Hence, when it comes to social investment, one might expect class-specific perceived representation to be less biased overall, or even biased more strongly against the preferences of middle- and upper-middle class voters.
Finally, middle- and working-class voters clearly differ in the extent to which they emphasize the importance of excluding migrants from welfare benefits and prioritizing the needs of natives. Policies that either lower benefit levels for migrants, or which extend existing benefits only for natives generally enjoy stronger support among the lower classes across all countries of Western Europe (Degen et al. Reference Degen, Kuhn and van der Waal2018). The mechanism driving this class divergence is supposed to be either economic (welfare competition, e.g., Manow Reference Manow2018) or value-based (communitarian as opposed to universalistic values, e.g., Enggist Reference Enggist2019). Given the saliency, electoral importance, and much lower fiscal significance of social policies addressing the needs of immigrants, we would expect parties and elites to be more responsive to the, on average, more immigration-skeptical preferences of the lower middle and working classes. Indeed, related studies have found the class bias in representation to be much weaker when it comes to immigration policies than when it comes to distributive policies (Elsässer Reference Elsässer2018). Hence, like social investment, one may expect weaker class bias or even reversed class bias in perceived representation of welfare chauvinism preferences.
Overall, we would thus expect the class bias in perceived party representation to be strongest when it comes to social consumption, because this is the area where strongly expansionist demands among citizens clash with an agenda of fiscal consolidation or even retrenchment among elites. By contrast, we would expect this bias to be weaker when it comes to social investment and welfare benefits for immigrants.
Within the paradigms of social consumption and investment, we can further differentiate different policy fields, such as pensions and unemployment benefits within social consumption, as well as (higher) education, active labor-market policies and childcare services when it comes to social investment. Regarding these fields, we would overall expect subjectively perceived representation biases to be strongest in those policies that are most salient and important to voters. Based on both the risk distribution and political importance (e.g., Rehm Reference Rehm2016; Jensen Reference Jensen2012; Enggist Reference Enggist2019), this would suggest that we expect stronger biases in the areas of pensions, education, and immigrants’ benefits than when it comes to unemployment support and childcare services.
Social Policy Congruence by Party Configuration
The observation of unequal, class-biased representation entails the question of context conditions that might mitigate or exacerbate the class bias in perceived (in)congruence. Indeed, a more varied political supply in terms of political parties would seem as one potential factor affecting the extent to which citizens perceive their preferences to be adequately represented or not, particularly at the stage of electoral competition. As previous research has indicated, at the government formation and policymaking stages, centripetal pressure to build majorities via coalitions imply that, even in PR systems, policy could be more responsive to middle-class demands (Blais and Bodet Reference Blais and Bodet2006; Elkjær and Iversen, this volume).
The role of nonmainstream parties in diversifying the political supply in terms of representation seems particularly relevant, not only because these parties tend to mobilize voters explicitly with reference to their opposition to the dominant mainstream or government parties (Mair Reference Mair2013), but also because left and right challenger parties have particular incentives to be responsive to their voters in terms of social policy. In particular, right challenger parties tend to mobilize disproportionally among voters from the working and lower middle classes (Oesch and Rennwald Reference Oesch and Rennwald2018). The electorate of left challenger parties is more heterogeneous in terms of social class, but at the same time, these parties tend to emphasize issues of social justice, egalitarianism, and distribution and should thus be particularly sensitive to representing the specific social policy preferences of their electorate.
We can thus theorize four context configurations in terms of party supply and derive expectations regarding the class bias in representation (Table 13.1).
Table 13.1 Strength of expected class bias in representation of social policy preferences, depending on challenger parties
| Presence of strong right-wing challenger | Absence of strong right-wing challenger | |
|---|---|---|
| Presence of strong left-wing challenger | Weak (moderate) class bias | Moderate class bias |
| Absence of strong left-wing challenger | Moderate class bias | Strong class bias |
We expect the strongest class bias in perceived representation in systems where challenger parties are weak, such as majoritarian electoral systems that tend to entail obstacles for challenger party mobilization. In these systems, we would expect, in particular, working-class voters to perceive elite congruence among mainstream parties and hence a larger distance between their priorities and the ones of their preferred party or the party system in general. The absence of challenger parties could deteriorate perceptions of unequal priority representation, since these parties tend to improve salience-based congruence (Giger and Lefkofridi Reference Giger and Lefkofridi2014). While we expect challenger parties on the left and right to mitigate some of the class-biased perceptions of representation, this could differ across social policy logics because of the issues these parties emphasize toward voters. Challenger parties on the right mobilize strongly in lower social classes, and they tend to do so, largely, in terms of policies related to immigration and welfare chauvinism (e.g., Hutter and Kriesi Reference Hutter, Grande and Kriesi2016; Kriesi et al. Reference Kriesi, Grande, Dolezal, Helbling, Höglinger, Hutter and Wüest2012), or of consumptive policies (Enggist and Pinggera Reference Enggist and Pinggera2021). Hence, right-wing challenger parties could particularly mitigate class biases on the logics of social consumption and benefits for migrants. Challenger parties on the left, in contrast, have typically mobilized lower-class electorates on an economic platform, have abstained from anti-immigration stances, and have also attempted to mobilize higher-grade classes on investment-oriented policies. Hence, these parties could mitigate class biases on the social consumption and investment dimensions, but not on welfare chauvinism. We expect class biases in representation to be most strongly mitigated in contexts of diversified supply, with strong challengers on both the left and right.
While these expectations are based on the types of social policy priorities typically taken by different party families (and the social groups they mobilize electorally), deviations from these expectations could arise from how the logic of party competition might affect the salience of these topics. While having a diversified supply can increase the range of policy priorities present in the party system (e.g., with a party explicitly advocating for welfare chauvinism), rising contestation and politicization of issues could also fuel perceptions of lack of representation, if not by voters’ preferred party, then by the system overall. Following the same example, having strong contestation on the issue of welfare chauvinism both from challenger parties on the left and right might bring further attention to welfare chauvinistic voters about the many parties that do not share their position. An expansion in the scope of conflict (Schattschneider Reference Schattschneider1960) can diversify the policy priorities taken by parties, but also highlight the different opinions held by other parties and voters. This is why we also propose that in highly diversified landscape, with challengers on both the left and right, the mitigation of class biases might be lower than initially expected and still be moderate. We purposely leave this expectation rather open and up for empirical investigation.
Data and Operationalization
We use original data from a survey conducted in the context of the ERC project “welfarepriorities.” Data were collected in eight Western European countries with 1,500 respondents each in Denmark, Sweden, Germany, the Netherlands, Ireland, the United Kingdom, Italy, and Spain. The questionnaire and sample design were in our hands, while the actual fieldwork was done in cooperation with a professional survey institute (Bilendi) using their online panels. The target population was a country’s adult population (>18 years). The total sample counts 12,129 completed interviews that were conducted between October 2018 and January 2019. Different measures were taken in order to increase the survey’s representativeness and to ensure high-quality answers. First, we based our sampling strategy on quotas for age, gender, and educational attainment, drawn from national census figures. Age and gender were introduced as crossed quotas, with six age groups (18–25, 26–35, 36–45, 46–55, 56–65, 66 or older) for both female and male respondents. Second, we account for remaining bias from survey response by including poststratification weights adjusting for age, gender, and educational attainment. The full dataset together with some validation tests are presented extensively in a specific working paper (Häusermann et al. Reference Häusermann, Kemmerling and Rueda2020).
Measures of Social Policy Representation
The survey includes a wide range of items capturing social policy positions and priorities, as well as a question on systemic congruence and on the respondents’ evaluation of party priorities.
There are several different items that enable us to measure social policy priorities. For this chapter, we use point distribution questions, in which respondents were asked to allocate 100 points to six policy fields, reflecting the relative importance they attribute to different strategies of welfare state expansion.Footnote 2 The six items were presented in a randomized order, so as not to prime the importance given to them. Through this type of question, we can account for the multidimensionality of welfare preferences, while at the same time we pay respect to the constraint that is inherent in the concept of priorities. At the same time, we do not force respondents to prioritize: the point-distribution question does allow for respondents attributing an equal number of points across all fields or reforms (as opposed to a mere ranking question of the different fields/reforms). Respondents were asked to allocate points to the six following social policy fields, covering social consumption, social investment, and welfare chauvinism: Old age pensions, Childcare, University education, Unemployment benefits, Labor-market reintegration services, and Services for social and labor-market integration of immigrants.
This point distribution question was asked to respondents in the first five minutes of the (roughly) twenty- five-minute survey. Most importantly, in the last third of the survey, the respondents were then again confronted with the same type of point-distribution question. However, the question was then asked with regard to their perception of party priorities. Respondents were asked in which of the above areas they think a particular party would prioritize improvements of social benefits.Footnote 3 Answer fields were identical as above and again randomized. Each respondent had to complete this task twice, once for his/her own preferred party (i.e., the party they indicated they had voted for in the last national election) and once for an additional, randomly chosen party (among the main parties in the country).Footnote 4 Since in this paper, we focus, among other aspects, on “party representation” by the respondents’ preferred party, our sample is restricted to respondents who did indicate they had chosen a party in the last national election.
Overall, and across countries and parties, respondents clearly tended to attribute most importance to the expansion of old age pensions, followed by tertiary education and childcare, followed by unemployment benefits and reintegration measures, and – lastly – integration services for immigrants. However, despite roughly similar patterns across countries, there are significant divergences from the country averages cross-sectionally across party electorates and classes (see Häusermann et al. Reference Häusermann, Pinggera, Enggist and Ares2022).
We present measures of voters’ representation by their preferred party by aggregating the rating of these six specific fields into three different dimensions: social consumption policies (aggregating expansions in the area of pensions and unemployment benefits), social investment policies (childcare, university education, and labor-market reintegration services), and benefits for migrants (services for social and labor-market integration of immigrants). Voters’ priorities on each of these dimensions take the average value of the points attributed across the corresponding fields of welfare expansion. We follow the same aggregation strategy to compute the priorities of the different parties on these three policy logics. Measures of parties’ priorities on each of these logics are based on the average of points allocated to each of these parties by all the available respondents in the sample (i.e., not only their voters). We base these measures on respondents’ average placement of parties and not on the individual placements provided by respondents to avoid risks of endogeneity stemming from voters projecting their own policy stances onto their preferred parties. It is important to notice, however, that parties’ average placement by all respondents or by their voters only is similar. To compute the measure of subjective representation by voters’ preferred party, we simply subtract the party’s placement on each dimension from respondents’ self-placement.
On top of measuring subjective representation by respondents’ preferred party, we also compute a measure of proximity to the party system in general. This measure allows us to add further detail to the question of how distant individuals perceive the party system to be on the three specific welfare policy logics: consumption, investment, and benefits for migrants. This measure captures the average proximity between a voter and all parties in the system and is calculated by first computing the distance between voters’ priorities and those of each party within the system, and second, averaging over these distance measures to arrive to a single measure of subjective system proximity. Both distances (to preferred party and to the party system) are measured on the original 0–100 scale from the point distribution task.
Using such newly developed measures requires evaluations of validity, which we have conducted. First, respondent behavior indicates that they were able and willing to engage with the task at hand: even though they could have eschewed the difficult task of indicating the relative importance for particular policies, fewer than 2 percent of respondents attributed equal point numbers across policy fields. Also, fewer than 6 percent of all respondents attributed 100 points to one field and 0 to all others. We have also conducted extensive analyses to test the internal validity of our items (Ares et al. Reference Ares, Enggist M., Häusermann and Pinggera2019). Regarding the point distribution question, we used data on people’s priorities regarding welfare retrenchment (as opposed to expansion) to test if reported preferences are consistent. Our data show that 85 to 90 percent of respondents gave consistent answers, that is, they did not simultaneously prioritize retrenchment and expansion in the same policy field. Regarding external validity, we find roughly the same “order of priorities” between policy fields as Bremer and Bürgisser (Reference Bremer and Bürgisser2020), who also study the relative importance of social policies.
Determinants of (Non)representation
Our analyses focus on differences in party and system proximity by social class. We implement a market-based definition of social class based on occupational categories. To operationalize class, we rely on a simplified version of Oesch’s (Reference Oesch2006) scheme, commonly used in current analyses of postindustrial class conflict (Ares Reference Ares2020; Häusermann and Kriesi Reference Häusermann, Kriesi, Beramendi, Häusermann, Kitschelt and Kriesi2015; Oesch and Rennwald Reference Oesch and Rennwald2018). This simplified version of the scheme distinguishes five social classes along Oesch’s vertical dimension, which captures marketable skills – that is, how the labor market stratifies life chances. In descending order, the upper-middle class aggregates professionals (including self-employed professionals) and employers with more than ten employees; the middle class is constituted of associate professionals and technicians; the skilled working class includes generally and vocationally skilled employees; the unskilled working class includes routine low and unskilled workers (in manufacturing, service, or clerical jobs); and a fifth category for small business owners aggregates self-employed individuals without a professional title and employers with fewer than ten employees. All results referring to the priorities and perceptions of small business owners must be considered with certain caution since they constitute a small group in the sample, hence reducing the precision of some estimates. Following many studies of unequal policy responsiveness, we conduct additional analyses that address unequal representation by income groups instead of class by assigning respondents to five income quintiles. While these results also report income biases in social policy representation, they are smaller than inequalities based on social class. This is in line with a growing number of studies repeatedly showing a greater explanatory value of class on redistributive and welfare policies.
The first part of the analyses starts by addressing class differences in party representation on three types of welfare policies (social consumption, social investment, and benefits for migrants) as well as by each of the policies underlying these logics separately. As explained earlier, for each of these logics and policies, proximity is measured with respect to respondents’ preferred party and to the system overall. In these models, the outcome variables are distances in points; hence, the models are estimated as linear regression models including controls for age, sex, trade union membership, and country-fixed effects. These control variables are included consistently across all models (except for the analyses by party system type, which do not include country-fixed effects).
The second part of the analyses addresses how the configuration of the partisan supply could mitigate/accentuate class inequalities in perceived congruence. Since the number of country-level observations is limited to eight, to address this question, we split the sample into four groups depending on whether challenger left- and/or right-wing alternatives had strong electoral support at the last national election. We consider electoral support as strong if either the left- or right-wing challenger block (including one or more parties) receives more than 10 percent of the vote. Following this classification decision, we observe four countries in which the left- and right-wing challenger blocks are strong: Denmark, Germany, the Netherlands, and Sweden. There are two countries in which we do not observe neither a strong left- nor right-wing challenger: Ireland and the United Kingdom. In Spain, there is a strong challenger party on the left only, while in Italy we only find a strong challenger on the right.Footnote 5 Given the reduced number of cases in some of these types of party configuration, we must be cautious in interpreting these results. The figures always indicate the countries on which the models are estimated.
To facilitate the interpretation of the results, they are presented by means of figures displaying average adjusted predictions or average marginal effects. The full models with all control variables are included in Tables 13.A2–13.A5 in the Appendix.
Results
Subjective Social Policy Representation by Preferred Party and Party System
As displayed in Figure 13.1, there are apparent class inequalities in how voters perceive politicians’ social policy priorities in relation to theirs, with working-class voters perceiving politicians as less congruent. This raises the question of whether this perception of unequal representation is also manifest when we focus on more specific welfare policies. To address this knowledge gap, the analyses discussed later model subjective representation by (a) voters’ preferred party and by (b) the party system, on respondents’ social class. Figure 13.2 presents class differences (with respect to the upper-middle class) in how distant voters are from their preferred party and the main parties in the country in terms of their prioritization of different welfare expansion logics: social consumption, social investment, and benefits for the labor-market integration of migrants. Comparing the two different measures – by preferred party and system – allows us to gain some insights about how good/bad representation by voters’ preferred party is, in comparison to the system overall. We could think of a context in which most parties in the system provided poor representation to the demands of the working class, but a specific party mobilized the priorities and electoral support of the lower-grade classes. In such a context, we would observe class gradient in terms of systemic representation, but not on party representation. This is not, however, what Figure 13.2 indicates.
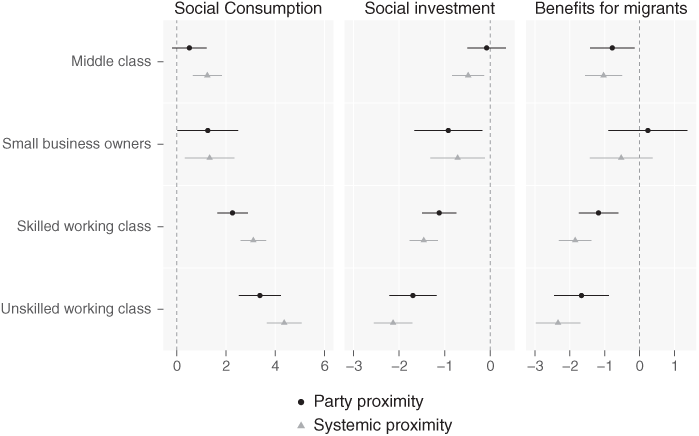
Figure 13.2 Social class differences in proximity to preferred party and party system
Notes: Class as a determinant of proximity across party systems (coefficients indicate differences to the upper-middle class). Estimates are based on linear regression models introducing controls for age, sex, trade union membership, and country-FE. The coefficients for all variables are presented in Table 13.A3 in the Appendix.
Proximity to parties is measured through points distributed to the different areas of benefit expansion, with higher values indicating support for further expansion of benefits in that particular area. Hence, positive party-voter distances indicate that the voter prioritizes expansion to a greater extent than the party (system) does. Correspondingly, negative values indicate that voters prioritize expansion in that area less than parties. In light of the evidence indicating that the working classes tend to prioritize consumption over investment policies, and our expectation that political elites will be more sensitive to investment-oriented expenditure, we should observe a class gradient in subjective proximity to parties. This is, in fact, what Figure 13.2 displays. There are two key findings to take from these analyses. First, social classes differ in how proximate they perceive their preferred party and the party system on the three dimensions of welfare expansion considered. Evaluations of party and systemic representation are better for the upper-middle and middle class than for the working class. On consumption-oriented expansion, the distance to voters’ preferred party is 3.4 points greater for the working class than for the upper-middle class. This difference increases to 4.4 points if we focus on systemic proximity instead. A difference of 3–4 points might seem little, but we should assess it relative to the in-sample range. A four-point difference amounts to about 50 percent of the standard deviation of the consumption proximity measure, this effect is larger than other class differences identified on commonly studied preference variables (like preferences on redistribution, gay rights, or environmental issues) (Häusermann et al. Reference Häusermann, Pinggera, Enggist and Ares2022).Footnote 6
The class gradient is also manifest in party and systemic representation on the expansion of investment and migrant integration but, in this case, with a negative sign. Again, the priorities of the upper-middle classes appear better represented and, in these fields, the lower-grade classes prioritize expansion to a lesser extent than their preferred party (or the party system) – this is reflected in negative measures of proximity. On social investment policies, the distance to their own party is about 1.7 points larger for the unskilled working class than for the upper-middle class. This difference increases to 2.1 when it is measured with respect to the party system. As we expected, unequal representation is larger on the social consumption dimension. The difference between the upper-middle class and the unskilled working class in the proximity to voters’ preferred party is twice as large for social consumption than for investment policies. Hence, it appears that the class bias is lower on the topics of social investment and benefits for migrants, on which the working classes prioritize expansion to a lesser extent than the parties they vote for (and in the system) do.
The second interesting finding stemming from these analyses is that the two measures of class inequalities in subjective representation display a greater similarity than we might have expected. In other words, class differences in perceptions of proximity are similar, whether gauged against respondents’ preferred party or the main parties in the system. While distances to own parties are usually smaller, they still display a class gradient, hence showing that class differences in congruence are manifest even when compared against voters’ preferred party. We take this as a sign indicating that even voters’ preferred party – in a relatively diverse party system, as in most Western European countries – do not eliminate class biases in perceptions of representation. We address to what extent the configuration of the partisan supply can compensate for some of these inequalities in further analyses discussed later.
Additional estimations (included in Table 13.A4 and Figure 13.A1 in the Appendix) address inequalities based on income quintiles instead of social classes. The results portray a similar income gradient in subjective representation. Income differences are smaller than class differences – which is in line with current research highlighting the importance of class for the type of welfare expansion prioritized (Häusermann et al. Reference Häusermann, Pinggera, Enggist and Ares2022). Moreover, there are no income differences in party or systemic representation concerning the expansion of welfare benefits for migrants, which matches the finding that it is not the poorest voters who tend to support more welfare chauvinistic policies (Bornschier and Kriesi Reference Bornschier, Kriesi and Rydgren2013).
Addressing different logics of social policy reform separately returns some interesting divergences. We can disaggregate these analyses further by addressing perceptions of proximity by specific policies. Our initial expectation was that class inequalities should be larger on those policies that are important and salient to a majority of voters – like pensions, education, or immigrants’ benefits. On other policy areas, voters’ attitudes and priorities are less likely to be strong and well defined. Figure 13.3 displays some interesting class differences across policies. The strongest class gradient appears for two social consumption policies that are largely salient across countries and strongly demanded by lower-class voters: pensions and unemployment benefits. As we could derive from the previous figure, class differences are smaller for investment policies, but, moreover, it becomes apparent that unequal distance on this dimension is mostly driven by the prioritization of the expansion of higher education by upper middle-class voters, which is more commonly shared by parties. On childcare and active labor-market policies, we find practically no difference between the distance perceived by upper- or lower-class voters. Hence, across different policies, class differences in perceived party proximity are greater on those policies that are generally more salient to voters.
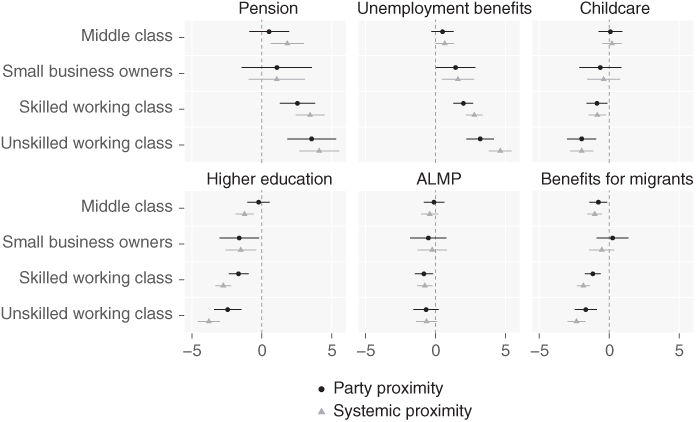
Figure 13.3 Social class differences in subjective proximity to preferred party and party system, by social policy area
Notes: Class as a determinant of proximity across party systems (coefficients indicate differences to the upper-middle class). Estimates are based on linear regression models introducing controls for age, sex, trade union membership, and country-FE. The coefficients for all variables are presented in Table 13.A5 in the Appendix.
Evaluations of Party Proximity and Systemic Proximity under Different Party System Configurations
The configuration of the partisan supply, particularly the presence (absence) of strong challenger parties on the left and right of the ideological spectrum, could mitigate (strengthen) some of the class inequalities in perceptions of proximity revealed in Figure 13.2. As shown in Table 13.A2 in the Appendix, a more varied party system could improve input representation by providing a wider range of programmatic supply to voters (e.g., radical Right parties explicitly advocating for welfare chauvinistic policies, or radical Left parties promoting consumptive policies) and, moreover, challenger parties have been more successful in mobilizing a working-class support base. This is why we expected class biases in representation to be strongest in systems without strong challenger parties and weakest in systems with left- and right-wing challengers. In systems with strong challenger parties on either the left or right, we expect these class differences to be moderate and to vary depending on the specific social policy logic under consideration.
The four panels in Figures 13.4 to 13.6 present average class differences in proximity to the preferred party and to the system by different configurations of the party system. The analyses draw on data from eight different countries, which are not uniformly distributed across the four types of partisan supply. Specifically, only Spain has a party system with a strong challenger on the left exclusively, while Italy represents the only case with a strong challenger only on the right ideological camp.
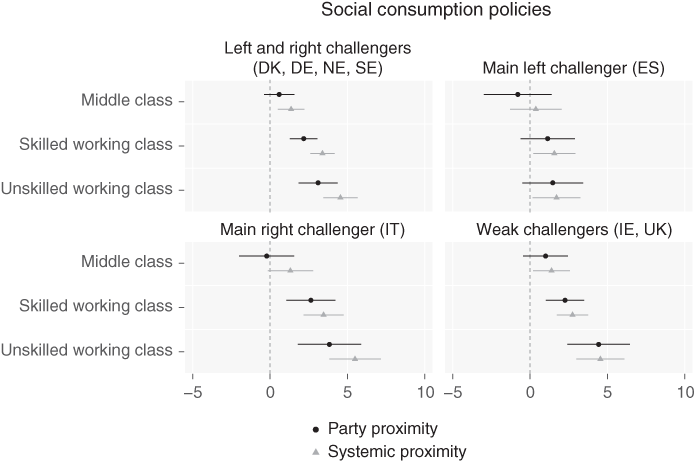
Figure 13.4 Social class differences in subjective proximity to preferred party and the party system on social consumption across different party system configurations
Notes: Class as a determinant of proximity across party systems (coefficients indicate differences to the upper-middle class). Estimates are based on linear regression models introducing controls for age, sex, and trade union membership. Average differences for small business owners are not presented because they represent a small group in the sample, with a low number of occurrences when the analyses are disaggregated by party system.
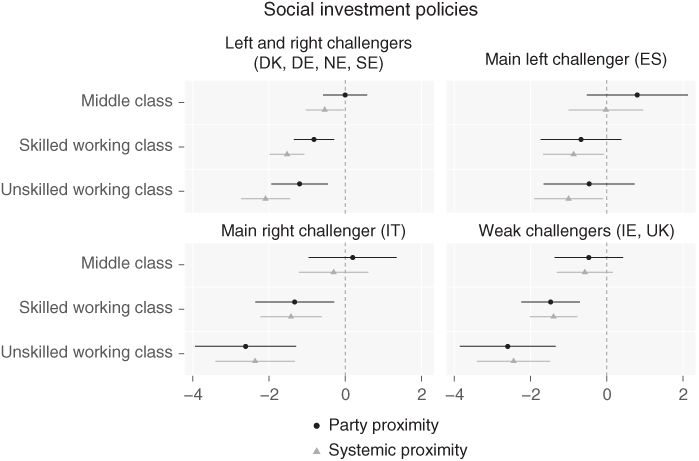
Figure 13.5 Social class differences in subjective proximity to preferred party and the party system on social investment across different party system configurations
Notes: Class as a determinant of proximity across party systems (coefficients indicate differences to the upper-middle class). Estimates are based on linear regression models introducing controls for age, sex, and trade union membership. Average differences for small business owners are not presented because they represent a small group in the sample, with a low number of occurrences when the analyses are disaggregated by party system.
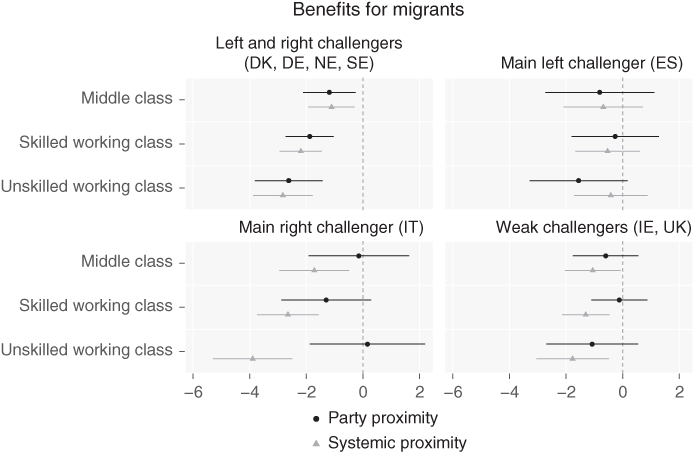
Figure 13.6 Social class differences in subjective proximity to preferred party and the party system on benefits for migrants across different party system configurations
Notes: Class as a determinant of proximity across party systems (coefficients indicate differences to the upper-middle class). Estimates are based on linear regression models introducing controls for age, sex, and trade union membership. Average differences for small business owners are not presented because they represent a small group in the sample, with a low number of occurrences when the analyses are disaggregated by party system.
The analyses summarized in Figure 13.4 return two interesting results. First, they indicate that, overall, the trends in unequal congruence identified in Figures 13.2 and 13.3 are persistent across most configurations of the partisan supply. Working-class voters perceive their own party and the system as less congruent with their consumption priorities (in comparison to the upper-middle class) in most of the countries under study. Second, there is one case for which there are no apparent class inequalities in terms of consumption priorities: Spain. In this country, in which the partisan supply is characterized by the presence of a strong left-wing challenger (Podemos), but the absence of one on the right, there are no class differences in perceptions of proximity, either by voters’ preferred party or the system overall. This could indicate that, in a country in which a strong challenger Left party has pursued a clear antiausterity agenda, working-class demands are better represented. However, if class biases were mitigated by the more diversified party supply in general, this absence of a class gradient should also be manifest in those systems in which we observe both a right- and left-wing challenger. This is not what the top left panel in the figure indicates. Moreover, the class inequalities visible under this diversified party supply are not driven by any of the four countries included in this type, but rather consistent across them. Hence, these results do not support our expectation about congruence with the lower-grade classes being improved in contexts of a more diversified partisan supply. Moreover, Figure 13.5 (addressing congruence with social investment priorities) displays a similar pattern. Class differences in perceptions of congruence are rather constant across different party systems with Spain, again, being the exception without a class gradient. Since we only observe one country with a strong challenger exclusively on the left, it is difficult to generalize these results, particularly because Podemos’ agenda strongly emphasized antiausterity economic policies – in response to earlier cutbacks on key welfare policies, including pensions, unemployment benefits, or education.
Finally, Figure 13.6 addresses priorities for the expansion of benefits for migrants. On this dimension, there is some substantive variation in the class differences in congruence manifest across different party systems. In countries with no strong right-wing challenger party (irrespective of whether there is a strong left-wing challenger or not), there are no class differences in perceptions of congruence with voters’ preferred party or with the system overall. In these contexts, parties are equally congruent with all classes. When a right-wing challenger is present in the party system, we do observe a class gradient in perceptions of proximity. Interestingly, in the case of Italy, in which we do not observe a strong contender on the left, the unskilled working class perceives the party system as more distant from their own priorities but not their preferred party. This could indicate that, presumably, radical-right voters perceive their party as congruent with their demands. We have to be cautious, however, in this interpretation, since it is based on a single country observation. In this case, the absence of a class gradient in countries without a right-wing challenger runs against our initial expectation that these parties could channel the welfare chauvinistic demands of the lower classes. However, we can also interpret this absence of class differences along the same interpretation provided for the analyses by policy fields by referring to salience. In countries like Spain, Ireland, and the United Kingdom, immigration has been a less salient topic until more recently. On policies that are less salient to voters (of different class location), it is less surprising to find no class gradient in perceptions of congruence. Overall, the different results do not lend support to the expectation that a diversified partisan supply mitigates class biases in perceived proximity, mostly because we do observe such biases in party systems with challenger parties on both the right and the left. However, the patterns observed for Spain on the logics of consumption and investment, and in Italy on welfare chauvinism seem to indicate that parties could mitigate some of these inequalities.
Conclusion
This chapter set out to address a shortcoming in existing literature which, in spite of profusely documenting the lower policy responsiveness to the interests of lower-income citizens, paid relatively little attention – with some exceptions (e.g., Rennwald and Pontusson Reference Rennwald and Pontusson2021) – to how citizens perceive opinion congruence. We did this by focusing on an area that is particularly relevant to redress material and political inequalities: welfare policy. Leveraging new data on voters’ and parties’ social policy priorities, this chapter has shown that there is a class gradient underlying voters’ perceptions of representation. Lower-grade classes generally report worse perceptions of congruence between politicians’ social policy priorities and their own. Moreover, these class differences are manifest not only when enquiring about social policy in general, but also when voters have to explicitly state parties’ and their own positioning on specific and concrete social policies. The detailed nature of the data allowed us to gauge voters’ assessment of party and systemic representation on three welfare policy logics and six policy fields. Overall, the analyses report a class gradient in the proximity that voters’ report to their own party and to the party system in general. Upper-middle class voters perceive parties’ priorities as closer to their own.
The analyses also revealed some interesting differentiation in the size of class inequalities across welfare policies. Representation (by own party and the system) is more class-biased on those policies that the literature has identified as more salient to voters and to the working class in particular. We find a stronger class gradient in proximity on social consumption policies, in comparison to social investment or welfare chauvinism. Class differences are particularly strong for the expansion of pensions, unemployment benefits, and tertiary education, while they are negligible for childcare and active labor-market policies.
As discussed by Bartels in this volume, by focusing on average differences in the placement of different social classes and political parties on social policy, our analyses do not explore the dispersion of preferences within social classes. In other words, lower average representation of the working classes’ preferences could mask different levels of representation within this class, if variance in preferences among workers is high. In additional analyses (not shown), we study, precisely, the dispersion of social policy preferences by social class. Our results indicate that there are no substantive differences in the variance of these preferences across groups: on consumption, investment, and welfare chauvinistic policies, the difference in variance between the upper and lower class is of 2 points at most.
These results indicate that it might be hard to redress some of these inequalities in congruence. The lower-grade classes prioritize further expansion in those policy areas that represent a bigger portion of social spending (most notably, pensions). It appears very unlikely that parties’ policy platforms will adopt a strongly expansionary pension agenda, moving the system’s position closer to the working class demands. Moreover, voters’ own preferred parties do not seem to fully mitigate perceptions of unequal representation either. Even if distance to preferred party is usually smaller than to the system, it still displays a class gradient. Our expectations about the lower classes possibly being better represented on the issue of investment and, especially, welfare chauvinism are also partly disconfirmed by the analyses. We expected the upper classes to be less well represented on these logics because these groups desire further expansion on investment, which parties could be limited in delivering due to tight budget constraints and because parties might have been more responsive to welfare chauvinistic trends. However, also on these two logics, the higher-grade classes perceive better representation, even if to a lower extent than on the consumption logic. Faced with important demographic and socioeconomic transformations, worse perceptions of congruence might hinder the possibilities for governments to introduce welfare reforms. Responsiveness plays an important role in building a “reservoir of goodwill” on which governments can capitalize to survive difficult periods of more “responsible” but less-responsive decisions (Linde and Peters Reference Linde and Peters2020). The absence of such a reservoir might undermine the capability for parties to make hard choices.
While our analyses allow us to focus, in depth, on a specific and relevant area – social policy – conclusions about the implications of this unequal representation for satisfaction with government and democracy more generally would require a more encompassing focus that also includes other policy areas. Voters could prioritize minimizing distance to parties on other issues not included in our analyses, which would indicate that they perceived these other issues as more salient for the vote choice. In such a case, when voters do not choose the party that is closest to them on the question of welfare reform (or when minimizing this distance is not the only consideration), we might expect class differences in incongruences with one’s preferred party to be less consequential. Additional analyses suggest that voters indeed tend to elect parties that are close to them on social policies, but also that this is not the only consideration, since some of them do vote for parties that are not minimizing distances on this issue. For about 25 percent of respondents, there would indeed be another party (different to the one they voted for) significantly closer to them (10 or more points closer on the 100-point scale). However, there are no apparent class differences in whether voters select the party that is closest to them on social policy.
In a last step of the analyses, we took into consideration whether the configuration of the partisan supply could moderate some of the class inequalities identified in the first step of the analyses. While we expected the class gradient to be mitigated under an expanded political supply with challenger parties on the left and right of the ideological spectrum, this is not what the evidence indicates. In fact, class biases in representation are rather robust across contexts, especially in what concerns consumption and investment policies. The only manifest exception is the Spanish case, for which we do not find class differences in perceived representation. We are, however, cautious to attribute this merely to the presence of a strong radical left challenger because class biases are also apparent in countries in which both left and right challengers exist. Moreover, the Spanish case alone, with a left-wing challenger characterized by emphasizing a strong anti-austerity agenda, may be quite particular. Welfare chauvinism is the only logic for which we observe stronger variation across party configurations. These differences, however, point to issue salience as a potentially conditioning factor. Class biases on welfare chauvinism appear to be smaller in countries in which the salience of the immigration issue is lower. The class gradient is also more moderate on social policies that are typically less salient to the public, like childcare or active labor-market policies. Hence, while strong challenger parties mitigate class biases in some cases (in Spain, or on benefits for migrants in Italy), the relative salience of different issues – affected by an expansion of conflict with the presence of strong challengers on both ends of the ideological spectrum – in turn, rather seems to heighten class biases. Further analyses might attempt to adjudicate between these factors by addressing cases that vary on the two dimensions. Despite the complex context-effects conditioning class biases, however, the main finding of our analysis is the consistent existence of class biases in representation across different areas of the welfare state and social policy.


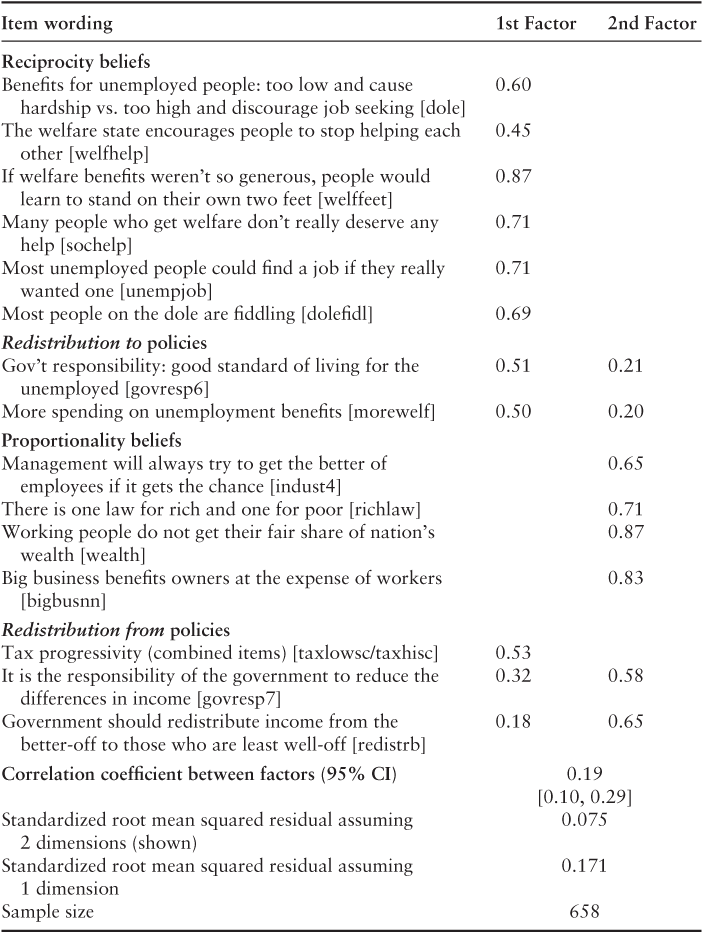
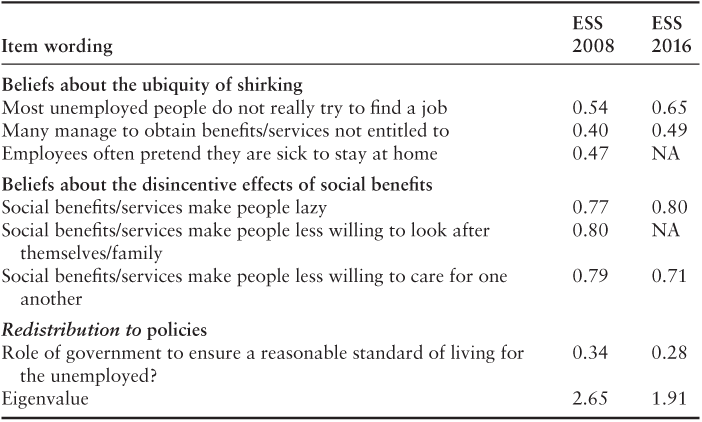
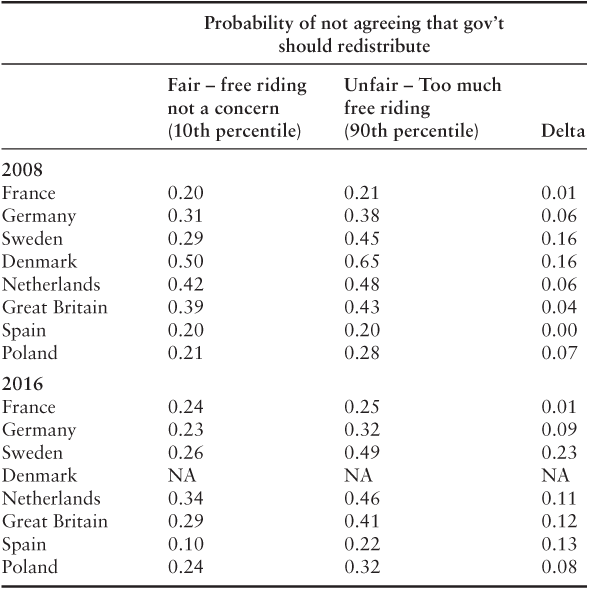
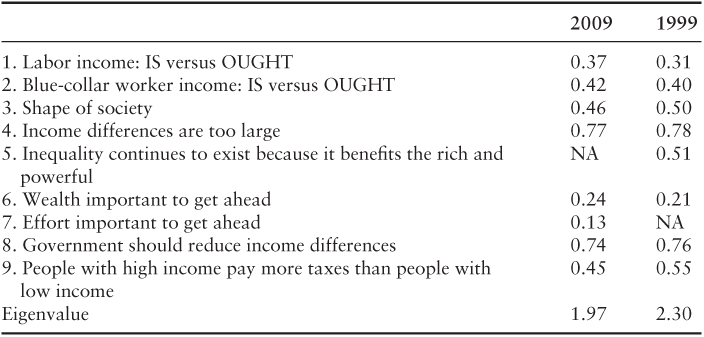


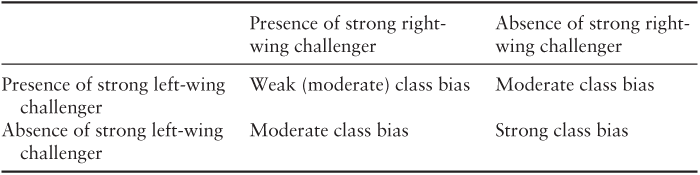


 Open access