


Nomenclature
Abbreviations
- ASTM
-
American Society for Testing and Materials
- BVID
-
barely visible impact damage
- CFRP
-
carbon fibre reinforced polymer
- CZM
-
cohesive zone method
- DoF
-
degree of freedom
- EFF
-
global material response
- FE
-
finite element
- FF
-
fibre failure
- IFF
-
inter-fibre failure
- VCCT
-
virtual crack closure technique
- WWFE
-
World-Wide Failure Exercise
Symbols
- e f , e c
-
fibre tensile and compressive modes
- e m , e d
-
matrix tensile and compressive modes
- E
-
Young’s modulus
- Eff
-
stress effort
- f
-
mixed-mode fracture criterion
- G
-
shear modulus
- G Ic
-
Mode I energy release rate
- G IIc
-
Mode II energy release rate
- G c
-
fracture toughness
- I
-
invariant
- K
-
interface stiffness
- l e
-
mesh size
- l cz
-
cohesive zone length
- m
-
interaction exponent
- N e
-
number of elements
-
 $p_{ \bot \bot }^ - $
-
slope of the (σ n , τnt) fracture envelope for σ n ≤ 0 at σ n = 0
- T
-
normal peak load
- X t , X c
-
fibre longitudinal tensile and compressive strengths
- Y t , Y c
-
matrix transverse tensile and compressive strengths
- S 12, S 13, S 23
-
shear in-plane, transverse, and out-of-plane transverse strengths
-
${\rm{R\;}}_ \bot ^{{\rm{ + A}}}$
-
fracture resistance of the action plane against its fracture due to transverse tensile stress
-
${\rm{R}}_{ \bot \parallel }^{\rm{A}}$
-
fracture resistance of the stress action plane against its fracture due to transverse/parallel shear stress
-
$\bar R$
-
mean strength
-
$\bar R_\parallel ^{\rm{t}}$
,
$\bar R_\parallel ^{\rm{c}}$
-
fibre longitudinal tensile and compressive strengths (X t , X c )
-
$\bar R_ \bot ^{\rm{t}}$
,
$\bar R_ \bot ^{\rm{c}}$
-
matrix transverse tensile and compressive strengths (Y t , Y c )
-
$\bar R_{ \bot \parallel }$
-
shear strength of a UD lamina transverse/parallel to the fibre direction (S)
-
$\beta$
-
shear stress weighing factor
-
$\delta$
0
-
softening strain
-
$\delta$
F
-
softening strain
-
$\epsilon$
-
strain
- v
-
Poisson’s ratio
-
$\rho$
-
density
- σ
-
in-plane stress
- σ n
-
normal stress acting on the potential fracture plane
- σ 0
-
maximum interface strength
- τ
-
shear stress
- τnt
-
normal/transverse shear stress acting on the potential fracture plane


1.0 Introduction
Carbon fibre reinforced polymers (CFRP) are known for their unique combination of material properties that include high specific stiffness, strength, toughness and improved fatigue performance in the absence of plastic deformation. CFRP is made up of individual plies that are stacked up with different fibre orientation. This results in three different structural entities, ply, laminate and the component made from CFRP. The structural response of composite materials can vary between static and dynamic loading conditions. It is associated with intra- and inter-laminar failures. Intra-laminar failure includes both tensile and compressive fibre and matrix damage, whereas inter-laminar failure is primarily associated with delamination of the plies and/or sub-laminate [Reference Shah, Bayandor, Abdi and Najafi1–Reference Llorca, González, Molina-Aldareguía and Lópes7].
Composite laminates are known for their exceptional strength-to-weight and stiffness-to-weight ratios depending on the application and loadings for which they are intended. However, in any given case they are prone to sudden impacts, either during manufacturing, service or maintenance stage [Reference Cesari, Dal re, Minak and Zucchelli8]. These impacts can be characterised by low to high velocity impacts depending on the type of induced damage. Particular concerns arise in the cases of low velocity impacts where barely visible impact damage (BVID) can occur which tends to be difficult to notice. BVID may not always cause intra-laminar damage but rather inter-laminar damage including delamination, fibre failure and matric cracks [Reference James and Giurgiutiu9]. Therefore, thorough testing and understanding of the different failure modes of composites is essential to their successful integration in growing industries such as aerospace and automobile.
Impact testing on composite laminates dates back to 1970s [Reference James and Giurgiutiu9]. Traditional low velocity and energy impact tests include drop mass impacts conforming to the American Society for Testing and Materials (ASTM) standards such as ASTM D7136 [10] and ASTM D5628-10 [11]. Many researchers use quasi-static and dynamic impact tests to study the structural response of a laminate in detail. These low velocity and energy impacts usually result in indentation, matrix damage and delamination [Reference Cesari, Dal re, Minak and Zucchelli8, Reference James and Giurgiutiu9, Reference Ramakrishnan, Corn, Le moigne, Ienny and Slangen12–Reference Zhang19]. Delamination is of key concern due to being one of the most common failure modes in composites. This prompts the need for dedicated attention to study the onset of damage in laminated composites in order to characterise the initial stages of delamination and intra-laminar failure properly.
Recent advancement in computational methods, primarily finite elements (FE) analysis, have enabled prediction of damage in composites. FE analysis is now used extensively by many researchers and the industry to model composite damage under various loading conditions [Reference Shah, Bayandor, Abdi and Najafi1, Reference Bayandor, Johnson, Thomson and Joosten2, Reference Orifici, Thomson, Degenhardt and Bayandor4, Reference Cesari, Dal re, Minak and Zucchelli8, Reference González, Maimí, Camanho, Turon and Mayugo17, Reference Raza, Garcia, Carpenter, Pärnänen, Jokinen, Kanerva and Bayandor20–Reference Bayandor, Thomson, Scott, Nguyen and Elder30]. However, there are difficulties associated with accurately modelling and predicting some of the failure modes, including delamination. Furthermore, there exist several different composite material damage criteria in the literature that have been implemented in commercial FE codes. They include a number of strategies to model inter-laminar bonding, such as the virtual crack closure technique (VCCT), cohesive zone model (CZM) and surface-based contact interactions [Reference Shah, Bayandor, Abdi and Najafi1, Reference Bayandor, Johnson, Thomson and Joosten2, Reference Basso, Chishti, Bayandor, Thomson and Bisagni5, Reference Horton and Bayandor6].
The present study focuses on investigating some of the analysis capabilities within Abaqus and LS-Dyna, two commercially available FE software, for composite damage modelling methodologies and their comparisons. Modelling in Abaqus [31] includes the use of three most applied failure criteria referenced in World-Wide Failure Exercise (WWFE) [Reference Hinton, Soden and Kaddour32], whereas modelling in LS-Dyna [Reference Hallquist33] focuses on its enhanced composite damage material model [Reference Chang and Kuo-yen34, Reference Wade, Feraboli, Osborne and Rassaian35]. These implementations aim to complement different modelling tools for the analysis of complex failure mechanisms that occur during low-velocity impacts. In addition, delamination initiation is modelled using different techniques offered by Abaqus and LS-Dyna.
2.0 Experimental set-up
2.1 Materials and laminate
The CFRP material selected for conducting the tests is AS4/3501-6 UD (Hexcel) unidirectional prepreg. It is stacked to form a quasi-isotropic laminate with a lay-up of [0/45/-45/90]S and a thickness of 1.12mm. Each lamina has a square shape of 58.1
 ${\rm{ \times }}$
58.1mm2. Figure 1 visualises the dimensions of the specimen and the impactor.
${\rm{ \times }}$
58.1mm2. Figure 1 visualises the dimensions of the specimen and the impactor.

Figure 1. Dimensions of specimen, impactor head, and support fixture.
2.2 Test methods
Reference data for further modelling and calibration is collected by means of a quasi-static indentation test. The target force is 83N (weight of the indenter) that induces an elastic response by the laminate specimens. The fixture for the specimen has a circular test area with a diameter of 38.1mm. Collecting and analysing deformation data is made possible through using digital image correlation (DIC). Two Photron SA-X2 high-speed cameras are used for recording the data, as shown in Fig. 2. DIC provides two-dimensional (2D) fields of strain and displacement at the bottom surface ply of the laminate specimen.
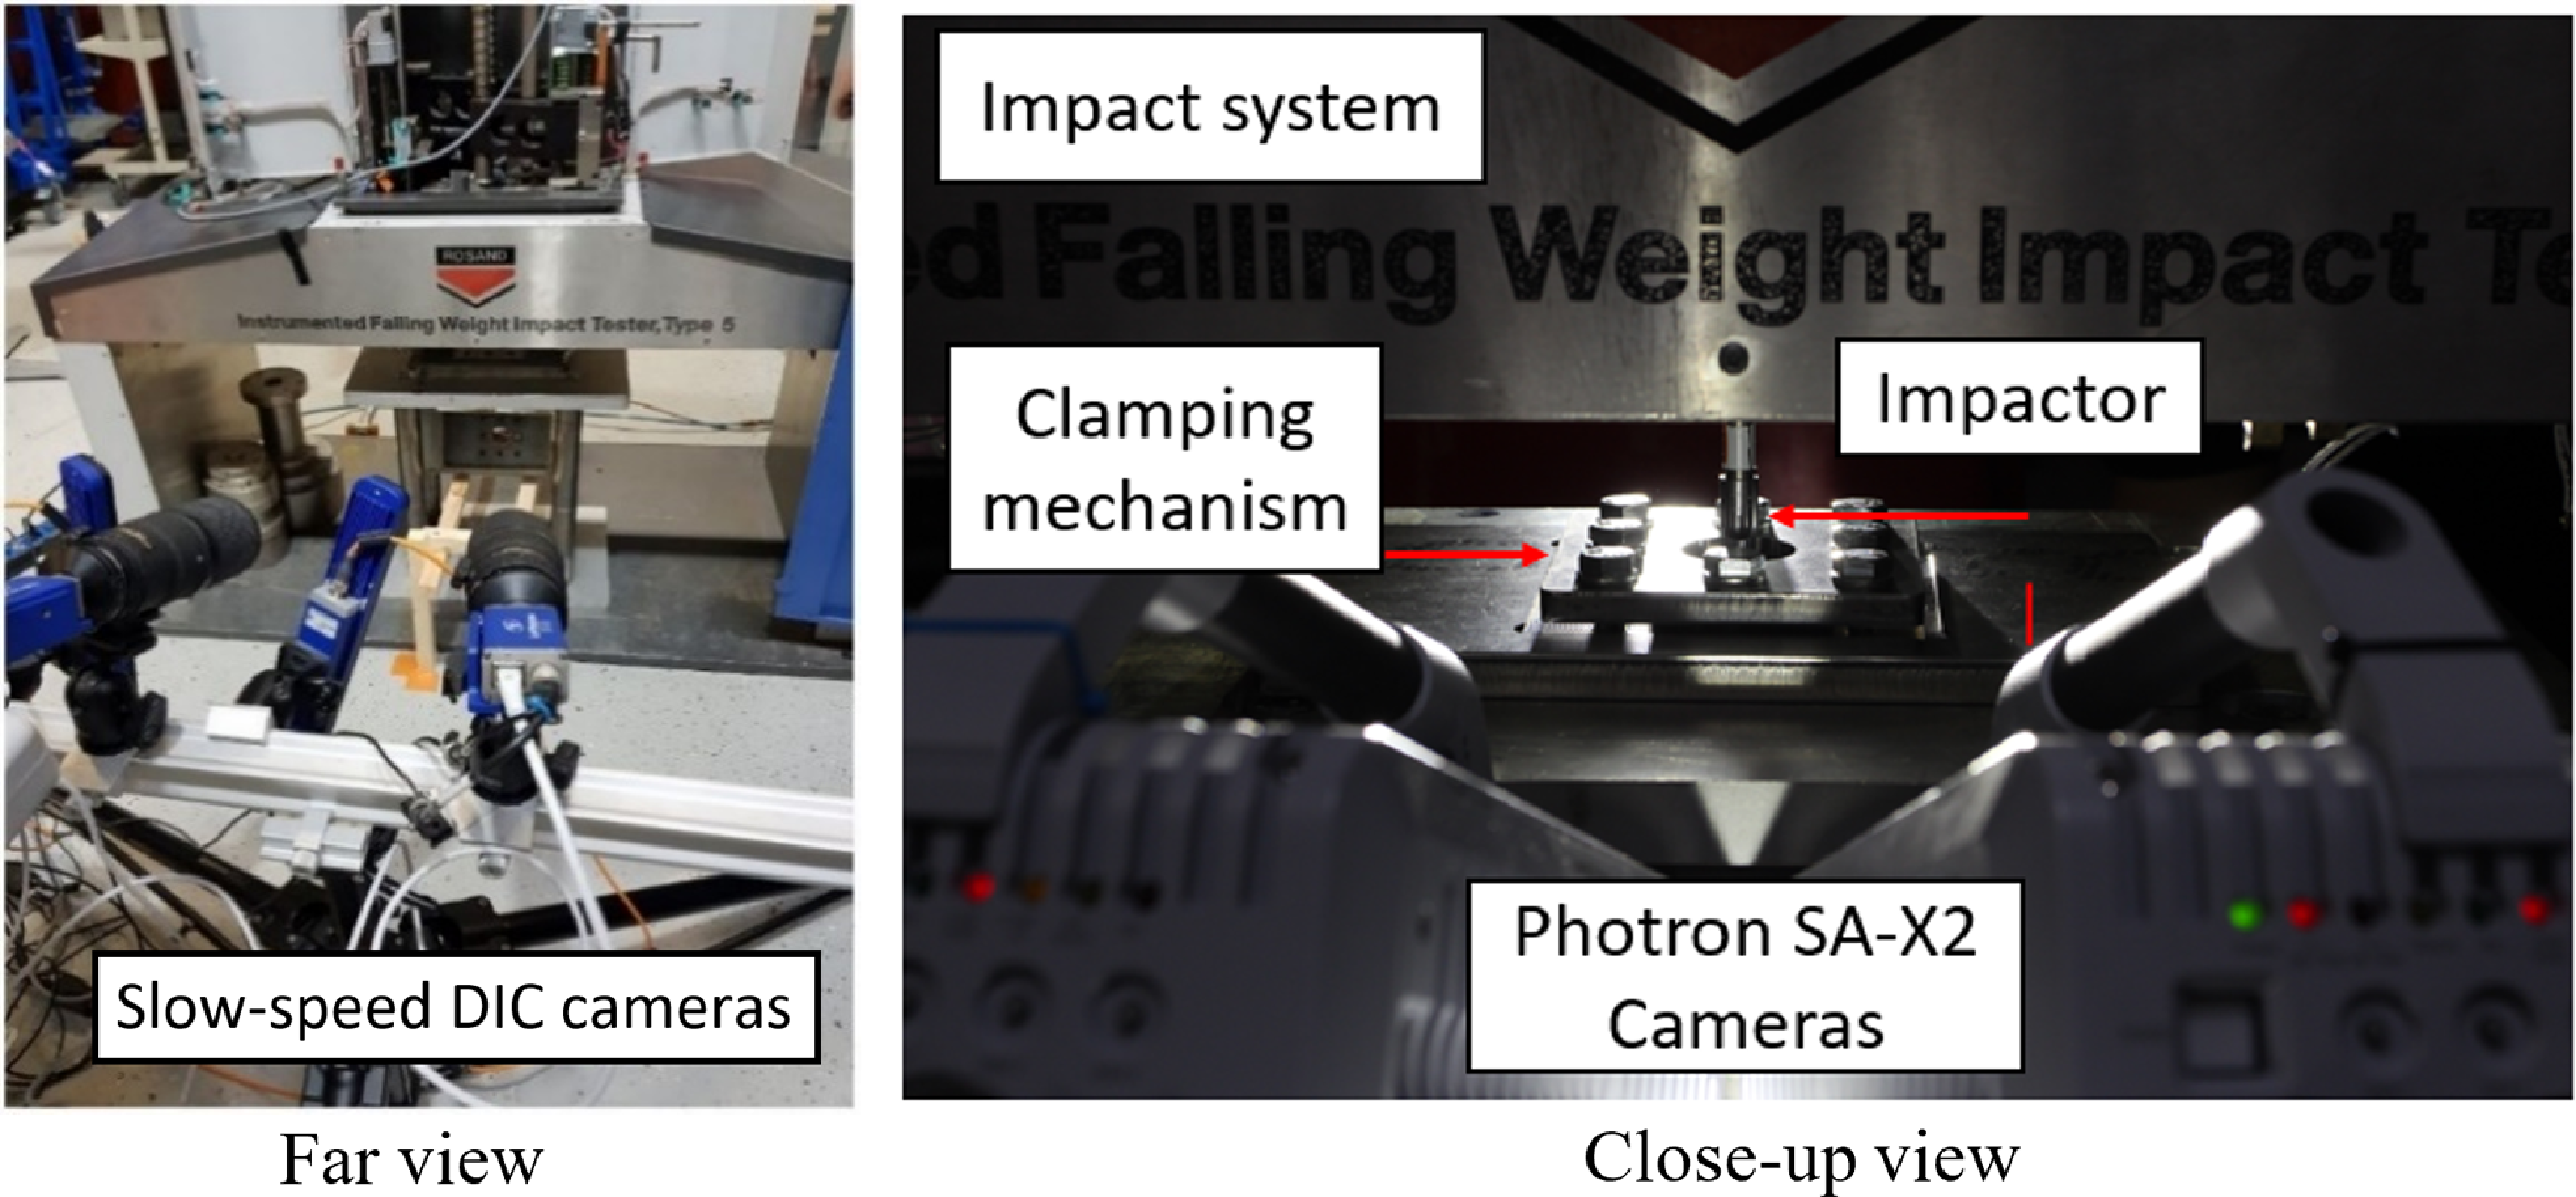
Figure 2. DIC cameras arranged for monitoring specimen during impact testing. Slow-speed DIC and high-speed cameras are shown with impact tester.
The impact tests are conducted in compliance with the ASTM D5628-10 standard [11]. An impact mass (comprising impactor and carriage) is set at a height corresponding to the impact energy of 5J. The impactor has a hemispherical head with a diameter of 12.7mm, made of steel (42CrMo4-QT). The total mass of the impactor and carriage is 2.87kg.
The standard ASTM D7136 [10] is widely used to characterise composite materials under low velocity impact. The test is often followed by compressive testing (termed CAI). The standard ASTM D5628 [11] is widely used for all types of polymeric materials to characterise them under low velocity impact. The essential difference in these standards is the fixture for holding the test specimen (sample). For ASTM D7136, the fixture is easy to use and allows for fast switch of specimens when performing large experimentation campaigns. However, the fixture is mechanically undetermined. The clamp mechanisms, by the standard, do not have load cells and the support loads in the four-arm mechanism cannot be determined precisely. For ASTM D5628, several specimen fixtures are available. For this study, the test fixture to affix the specimen included upper and lower supports (steel fixtures) with a 38.1mm diameter circular test area. For a fibre-reinforce plastic specimen, using hard-clamped fixtures is challenging due to precise positioning that must be considered to account for ply alignments within the laminates. After accurate placement of the specimen, the clamp boundary condition can be clearly defined, which in turn can prevent the specimen from moving during the impact.
In the present work, the target of the testing is to find precise experimental data on specific specimens that can then be thoroughly modelled. The outputs of the tests must be clearly defined to be able to be compared with those of the FE simulations. In addition, when applying full-field methods such DIC, any movements of the specimen under and outside the boundary conditions must be prevented. Especially, for quasi-isotropic specimens, the correct selection of the clamps is imperative to avoid any movements outside of the test area. The objective of this study is primarily to investigate accurate modelling challenges to study delamination/crack initiation and the comparison of intra- and inter-laminar damage models between Abaqus and LS-Dyna, Therefore, the ASTM D5628-10 standard was selected for the specimen testing in this study as the continuous boundary condition around the impact region allowed for a unified and straightforward selection of the boundary in the models that is accurately representative of the experimental setup.
2.3 Ultrasonic delamination detection
Delamination detection by ultrasonic inspection is used for fibre-metal laminates in addition to pure fibrous composites [Reference Aymerich and Meili36, Reference Pärnänen, Alderliesten, Rans, Brander and Saarela37]. Ultrasonic detection can search for internal delamination damage and its extent from the impact point. A tabletop device (USM 100, Krautkrämer, Waygate) was used with small probes to detect damage with high spatial resolution. Two probes, namely 113-234-680 (5MHz) and SEB10 KF3 (10MHz) Waygate (provided by General Electric in Finland), were utilised. They were moved manually from the intact edge of the laminate specimen toward the impact point. In A-scan, changes in the pulse echo, from the depths less than the thickness of the specimen, were considered. Based on the probe size and hole diameter, four lines of detection were run from each corner of the specimen towards the impact point. Figure 3 shows the ultrasonic scanning method used to study internal failure. A similar laminate was used as a reference to compare the readings without any impact damage.
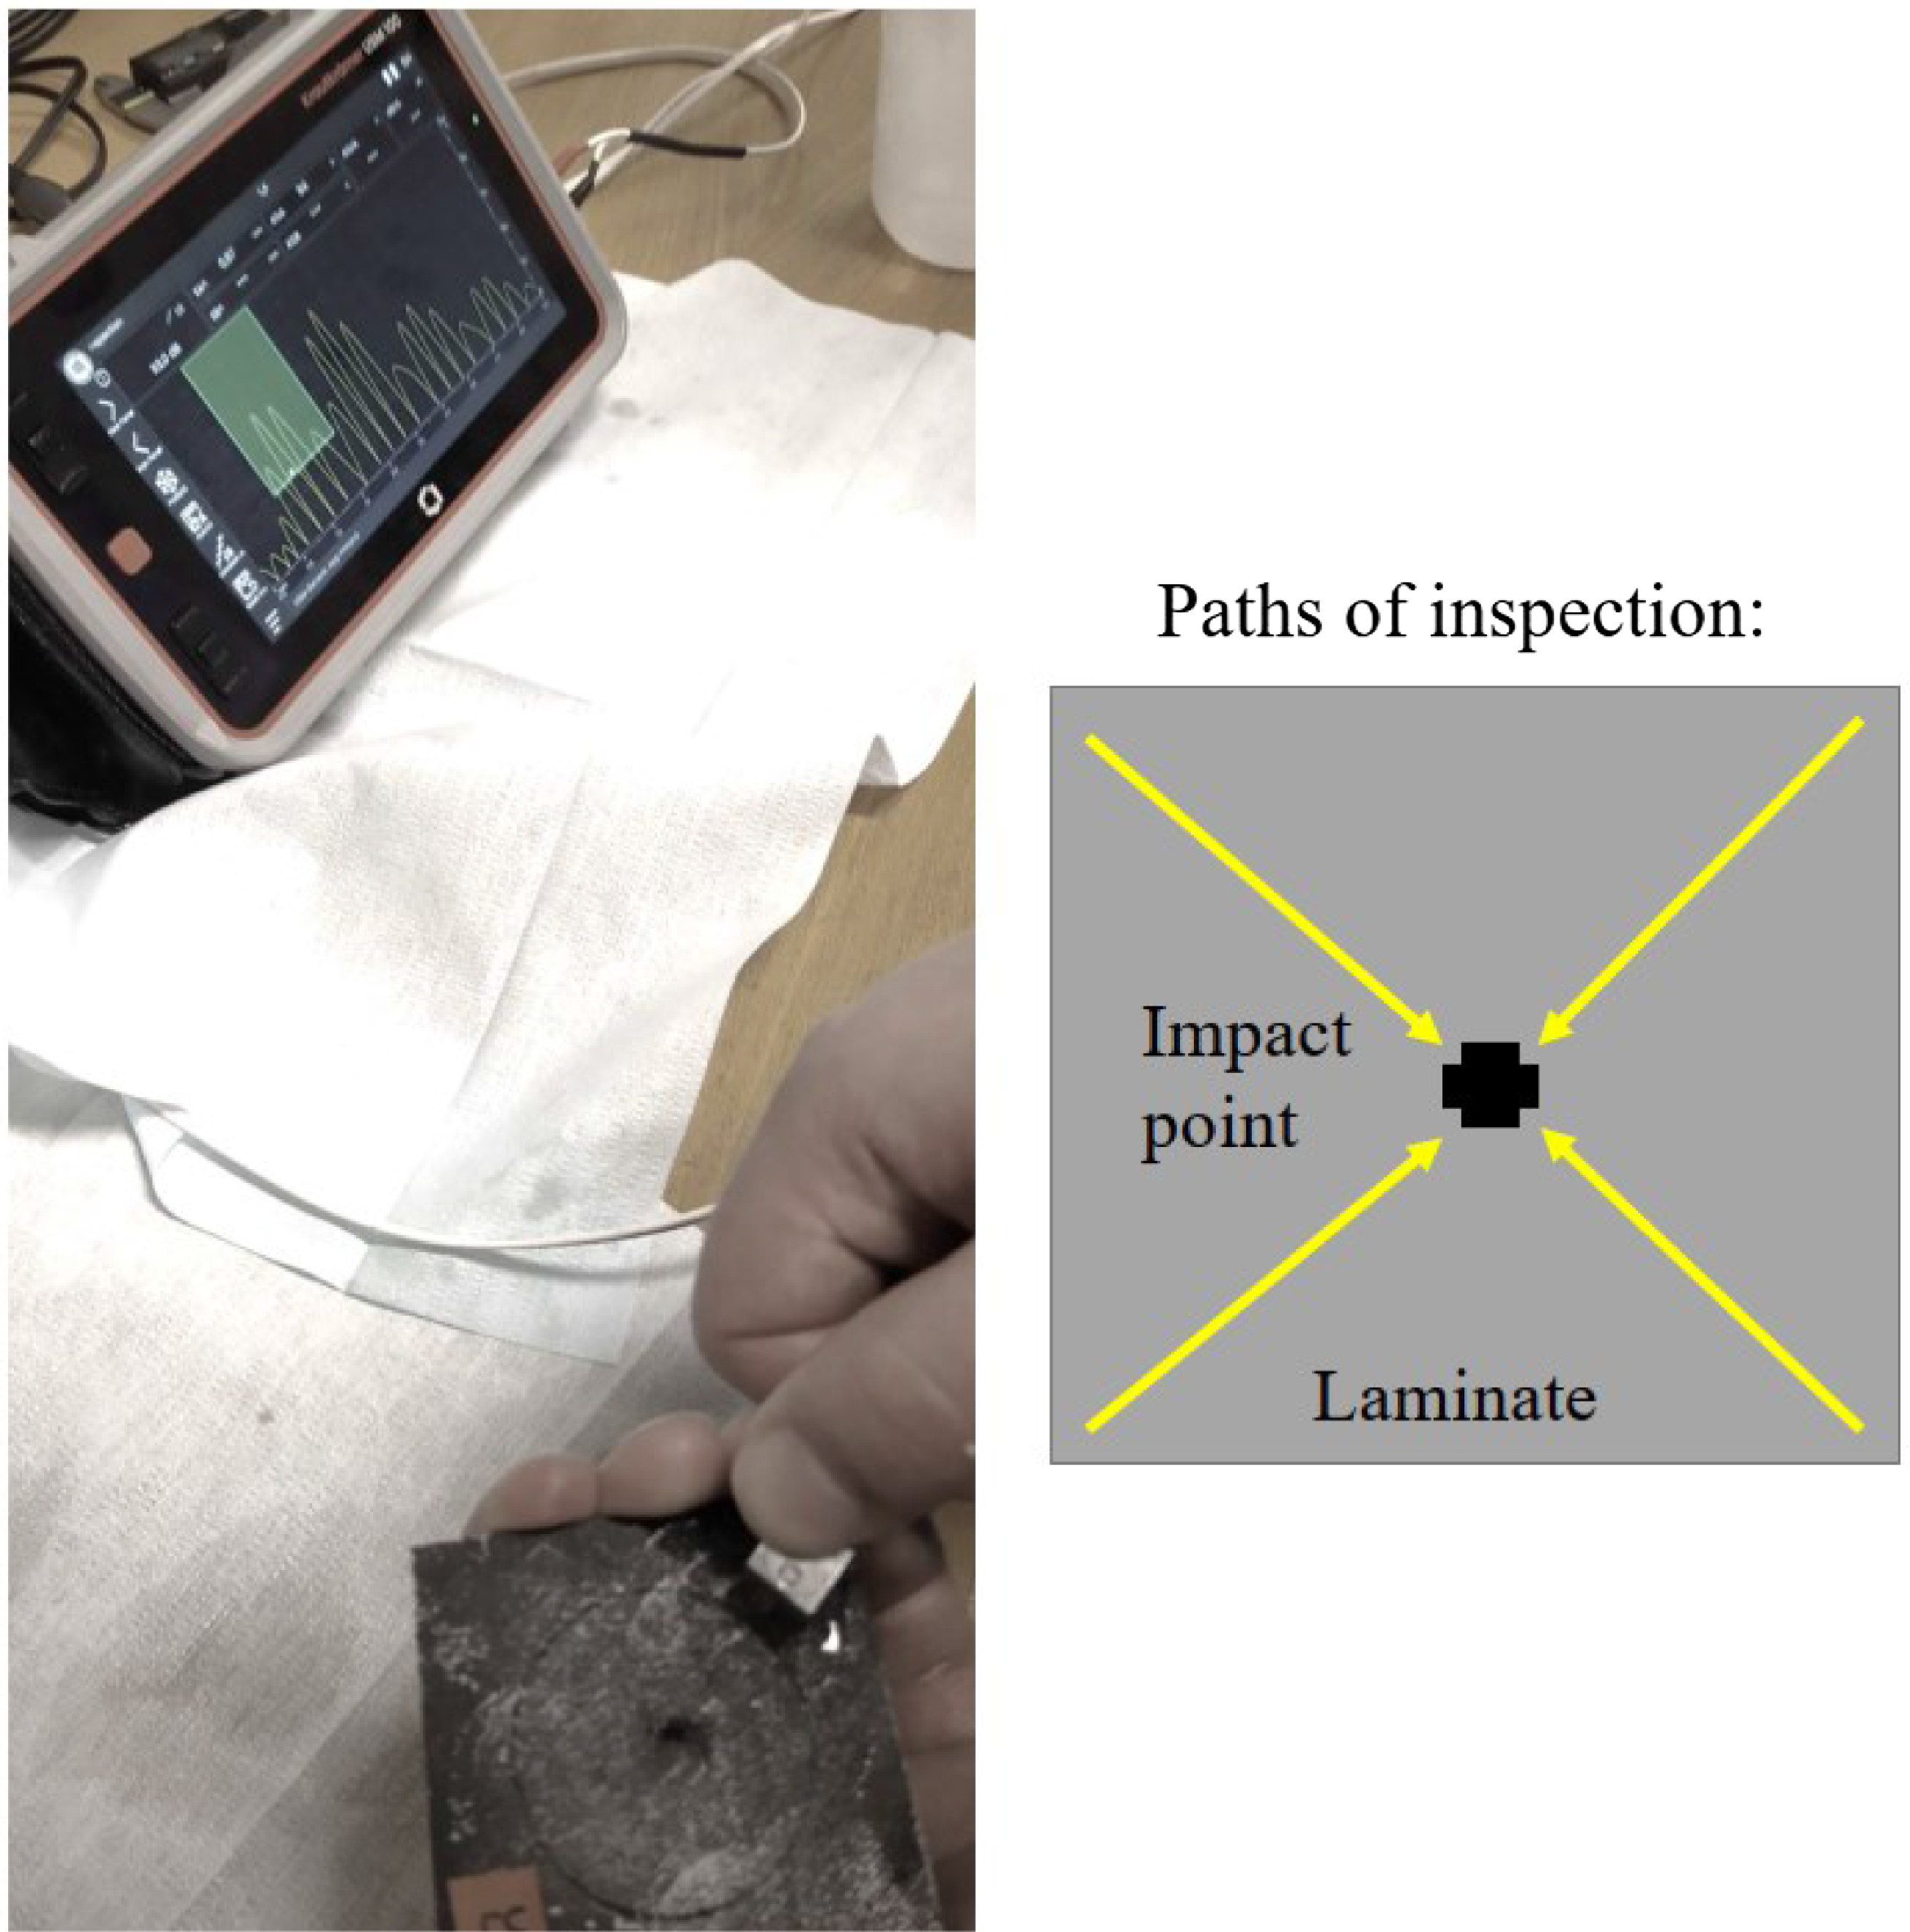
Figure 3. Ultrasonic scanning method to study internal (delamination) failure.
Water was used as a coupling medium, with the backwall echo of the reference specimen considered as the baseline ultrasonic signature. The edge of the delamination was determined to begin from the backwall as the echo signatures vanished. The difference between the backwall echoes from the reference specimen and the impacted one were notable, however no signal correction was deemed necessary due to the difference not being large and the small material depth. The likely reason for this difference is that a thin paint layer was present on the impact specimen which improved the surface roughness and resulted in enhancing its coupling with the ultrasonic probe.
3.0 Modelling methodology
3.1 Quasi-static and dynamic FE model
The modelling of the quasi-static and dynamic experimental tests was carried out using FE methods. The performance of Abaqus/Standard (quasi-static), Abaqus/Explicit (dynamics) and LS-Dyna software were compared via the analysis of their respective models replicating the impact tests. The FE models in each platform were set up to reproduce both indentation (static) and impact (dynamic) test results. The size of the FE laminate model was 58.1
 ${\rm{ \times }}$
58.1mm2 with a thickness of 1.12mm, as shown in Fig. 4. The laminate mesh was defined with three-dimensional (3D) hexahedral continuum solid elements with eight nodes and reduced integration (C3D8R).
${\rm{ \times }}$
58.1mm2 with a thickness of 1.12mm, as shown in Fig. 4. The laminate mesh was defined with three-dimensional (3D) hexahedral continuum solid elements with eight nodes and reduced integration (C3D8R).
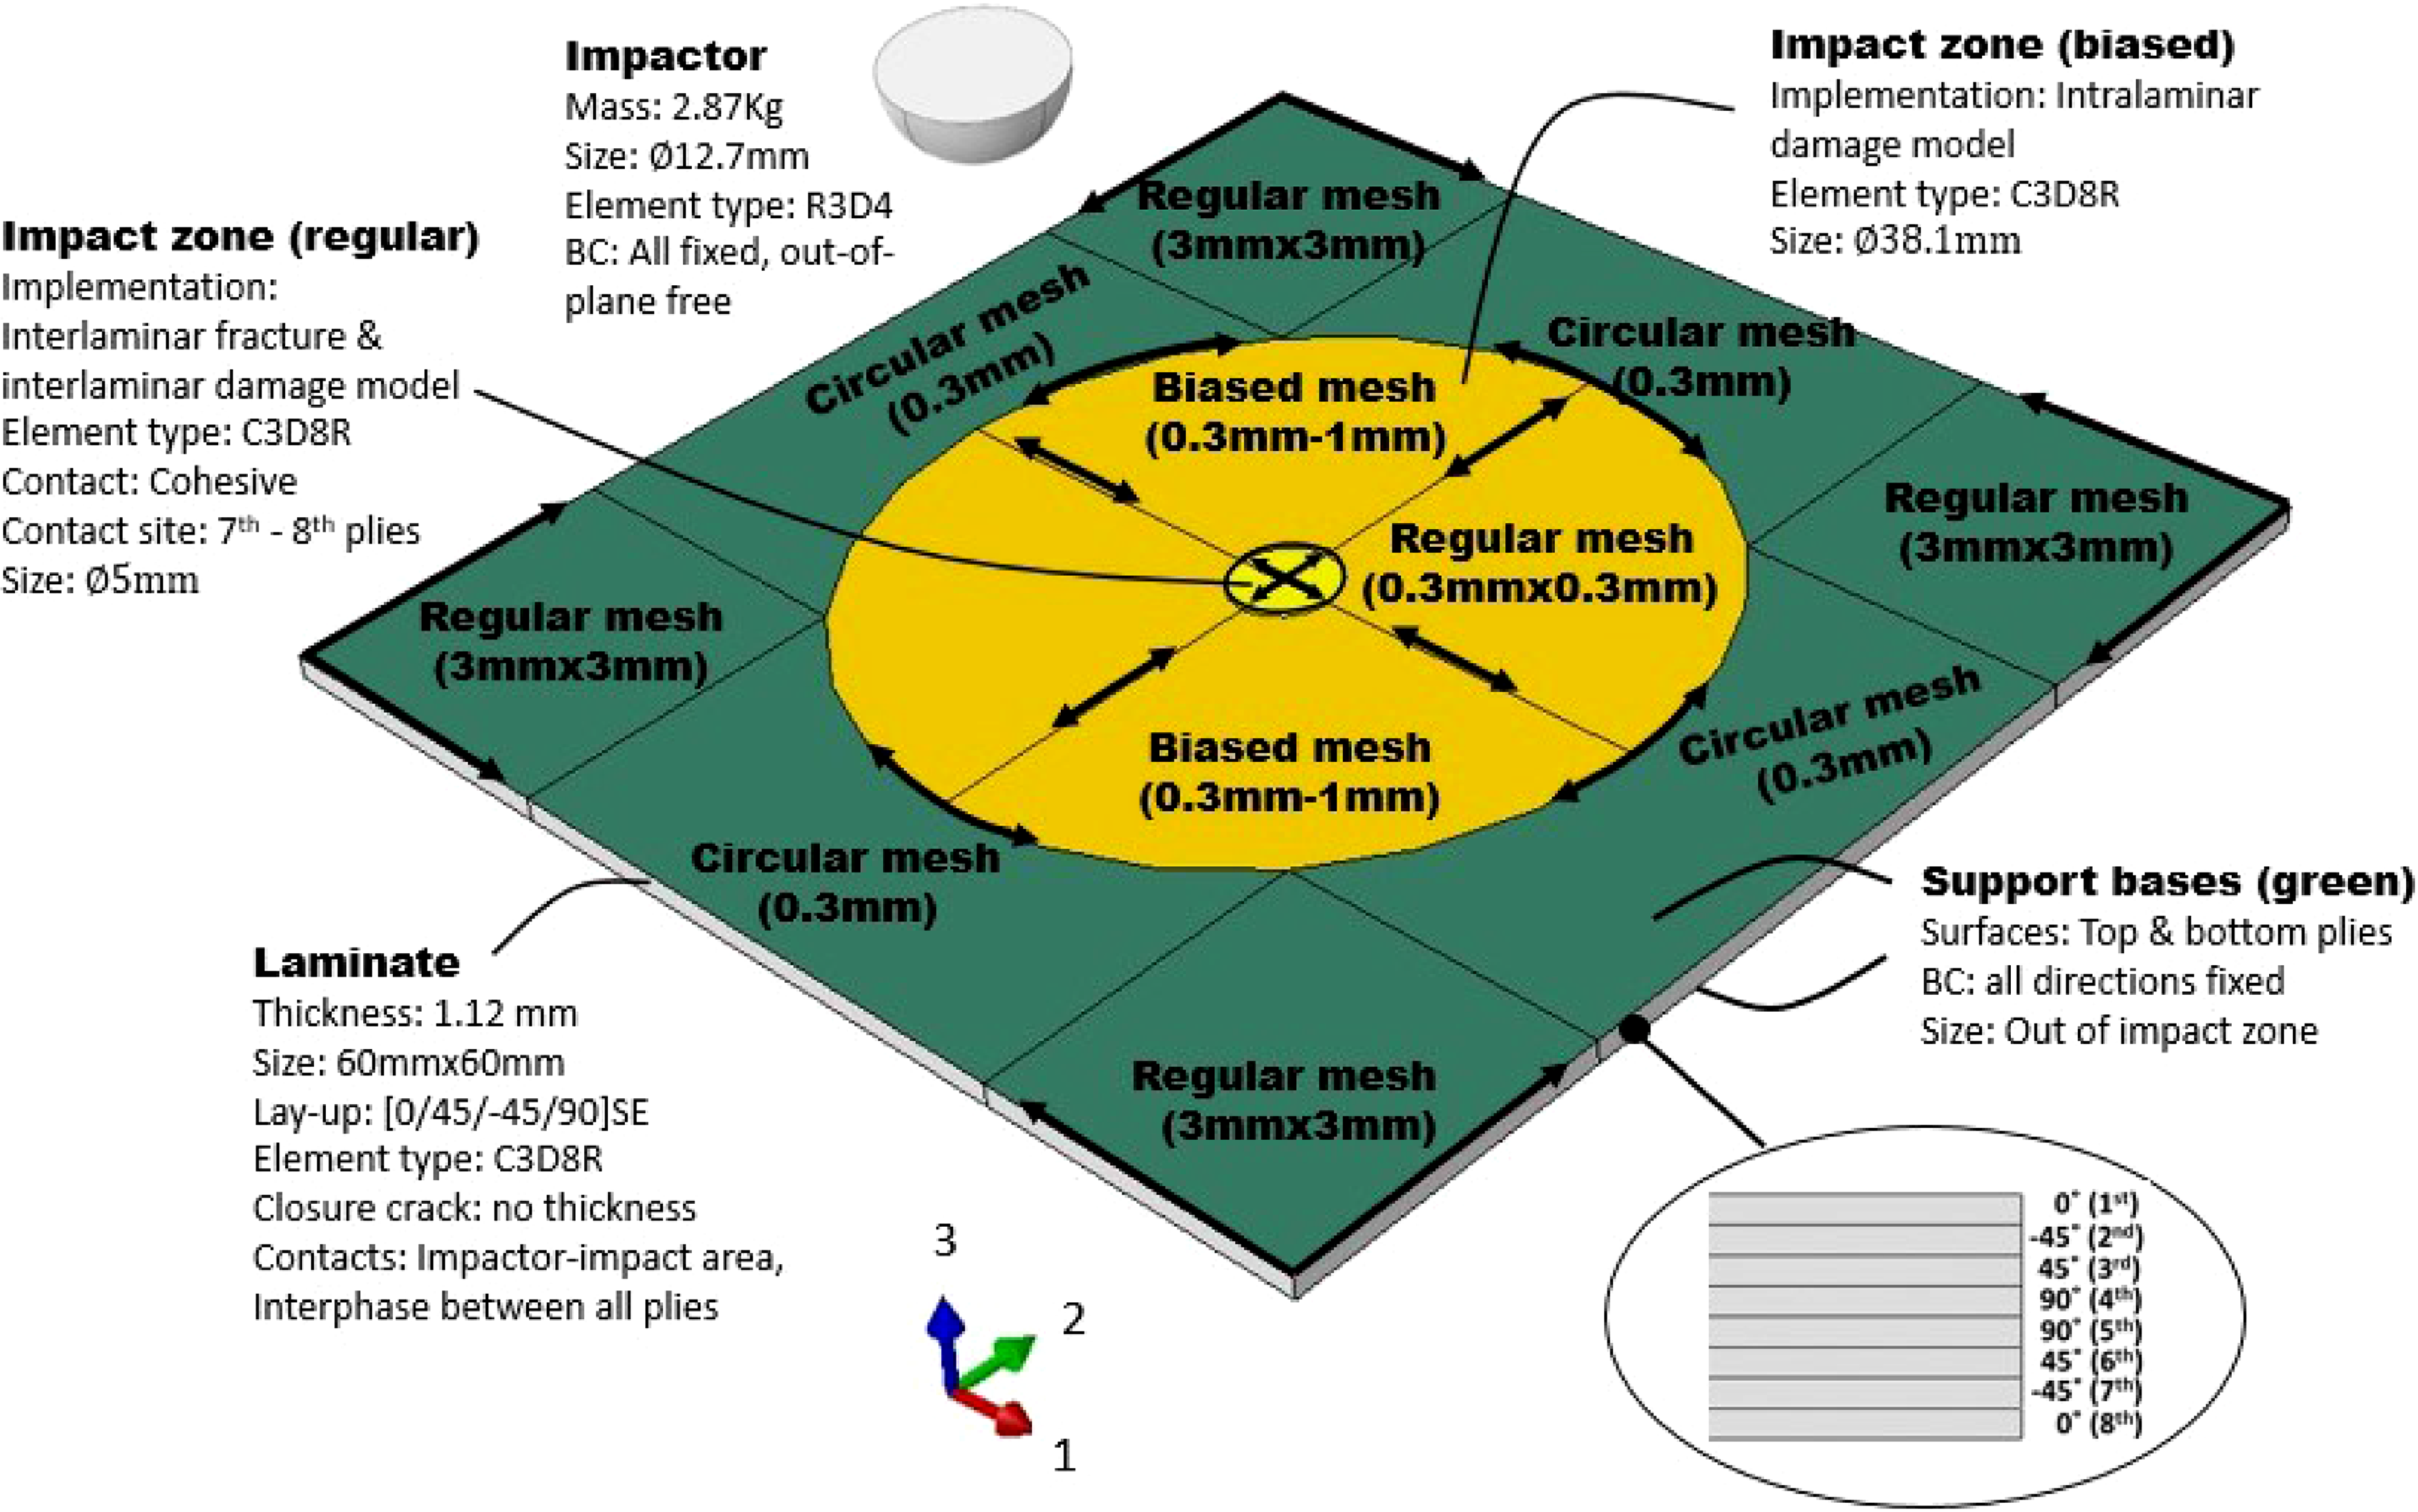
Figure 4. FE model of specimen and in-plane mesh both for Abaqus (Standard and Explicit) and LS-Dyna implementations.
A 3mm mesh at the edge of the plate was defined to obtain a uniform shape at the areas outside of the impact zone. The impact zone (i.e., test area) was constructed with element sizes varying from 1mm (the outer circle) to 0.3mm (the inner circle). The central zone of the model presented a refined regular mesh size of 0.3 × 0.3mm, which underlines the size of an intended pre-crack for delamination analysis.
The implementations carried out by both FE models were set to analyse and predict the impact response at the initial stages of delamination and damage within the plies. They showed that in low energy deformation scenarios delamination initiated between the seventh and eighth plies near the bottom of the laminate. The specimen used in the study had symmetric plies (through thickness), so the majority of the initial delamination occurred at the bottom part of the laminate first (between the seventh and eighth ply in this case) [Reference González, Maimí, Camanho, Lopes and Blanco16, Reference Bayandor, Thomson, Scott, Nguyen and Elder30]. Therefore, the damage initiation investigations were focused mostly on the seventh and eighth ply interface, where the delamination was also modelled within the FE platform. This served to reduce the computational time significantly, while having little effect on the overall delamination initiation results.
For delamination modelling, the Abaqus/Explicit model uses the VCCT method for detection of crack initiation. VCCT is a fracture mechanics method and requires modelling a pre-existing crack. Figure 5 shows the schematic of the layup of the plies and where the premature crack is modelled in Abaqus using VCCT. The LS-Dyna model employs two approaches for modelling delamination between the seventh and eighth plies, namely CZM and tiebreak contacts (refer to Section 3.4.2).

Figure 5. Schematic of premature crack modelled in Abaqus/Explicit model.
The impactor and indenter are modelled as a rigid body using 3D rigid elements (R3D4) with the mass centre and the radius of the actual instrumented impactor used in the experiment. Contact during the impact occurs between the impactor and the first ply of the laminate. The impact is governed by normal and tangential contacts established with a friction coefficient of 0.3 (steel-composite) in the tangential direction. The motion of the impactor and the boundary conditions are applied at reference points. All the degrees of freedom (DoF) are fixed, except the out-of-plane direction. For the modelled specimen, the displacements are fixed at the area outside of the test region and at both sides of the laminate to simulate the pressure applied by the fixture.
3.2 Material properties and parameters
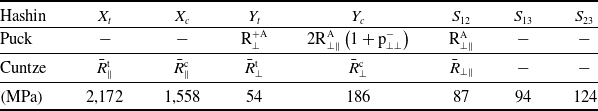
The density and elastic constants for the ply are shown in Table 1. The ply strengths are provided in Table 2. The properties related to the fibre direction are also given due to the stress effort variable of the Cuntze criterion.
Table 1. Elastic constants for AS4/3501-6 UD laminate ply [38]

Table 2. Strength properties and parameters correlation for each failure criterion in AS4/3501-6 UD ply [Reference Skytta, Saarela and Wallin39]
3.3 Impact modelling in Abaqus/Explicit
The FE modelling for simulating the indentation test is based on a transversally elastic constitutive model with the elastic constants at the ply level. The simulation is run by using the user subroutine VUMAT, where different failure criteria are implemented (Hashin, Puck, and Cuntze) in the impact model. The process for assessing the onset of damage considers two failure paths, ply level failure and delamination occurring between the plies. VCCT is used by means of contact interactions. The analysis is then carried out in the linear-elastic regime with activation (value
 $ \geqslant 1$
) of the yielding functions of the criteria as well as the delamination up to its initiation point. Transversally elastic constitutive models are hence implemented in this analysis. Special interest is given to the analysis of the failure at the ply level in the presence of delamination.
$ \geqslant 1$
) of the yielding functions of the criteria as well as the delamination up to its initiation point. Transversally elastic constitutive models are hence implemented in this analysis. Special interest is given to the analysis of the failure at the ply level in the presence of delamination.
3.3.1 Intra-laminar failure
The criteria used in Abaqus/Explicit are strength-based failure methods, which define activation functions for each of the failure models involved, including fibre, matrix, and loading directions. No dissipation of energy is caused by these criteria. Instead, the functions account for the activation of the yielding functions (>1) describing the failure ‘density’ based on the effective (undamaged) stress field. These predictions are set to reproduce the impact test up to the onset of damage at a pre-existing crack embedded within the seventh specimen interface.
The Hashin, Puck, and Cuntze criteria are used for the analysis of the intra-laminar failure [Reference Hinton, Soden and Kaddour32]. These criteria allow for predicting the failure mechanisms caused by two main modes: Fibre Failure (FF) and Inter-Fibre Failure (IFF). They have been continuously developed since 1980 when Hashin established the first approach [Reference Puck and Schürmann40]. The criteria by Puck [Reference Puck and Schürmann40] and Cuntze [Reference Cuntze and Freund41] are more recent, in which efforts have been made to improve the IFF mode. IFF is important for the current study as it typically appears as part of bending events [Reference Cuntze and Freund41], caused by the impact. The Hashin criterion is based on the modifications of the Mohr/Coulomb theory through the quadratic functions. Equations (1) and (2) show the formulation for the two inter-fibres modes in tension (referred to as
 ${{IF}}{{{F}}_{{ + }}}$
) and compression (referred to as
${{IF}}{{{F}}_{{ + }}}$
) and compression (referred to as
 ${{IF}}{{{F}}_{{ - }}}$
), respectively.
${{IF}}{{{F}}_{{ - }}}$
), respectively.
 \begin{align}IF{F_ + } = \frac{{{{\left( {{\sigma _{22}} + {\sigma _{33}}} \right)}^2}}}{{Y_t^2}} + \frac{{\left( {\sigma _{23}^2 - {\sigma _{22}}{\sigma _{33}}} \right)}}{{S_{23}^2}} + \frac{{\left( {\sigma _{12}^2 + \sigma _{13}^2} \right)}}{{S_{12}^2}}{\rm{\;\;\;\;\;}}for\left( {{\sigma _{22}} + {\sigma _{33}}} \right) \geqslant 0\end{align}
 \begin{align}IF{F_ - } & = \frac{1}{{{Y_c}}}\left[ {\left( {\frac{{{Y_c}}}{{2{S_{23}}}}} \right) - 1} \right]\left( {{\sigma _{22}} + {\sigma _{33}}} \right) + \frac{{{{\left( {{\sigma _{22}} + {\sigma _{33}}} \right)}^2}}}{{4S_{23}^2}} + \frac{{\left( {\sigma _{23}^2 - {\sigma _{22}}{\sigma _{33}}} \right)}}{{S_{23}^2}} \nonumber \\[5pt] & \quad + \frac{{\left( {\sigma _{12}^2+ \sigma _{13}^2} \right)}}{{S_{12}^2}}{\rm{\;\;\;\;\;}}for\left( {{\sigma _{22}} + {\sigma _{33}}} \right) \lt 0\end{align}
The Puck criterion improves the IFF mode by calculating it as a function of, the so-called, action plane stresses (
 ${\sigma _n},\;{\tau _{nt}},\;{\tau _{nl}}$
). The common action plane defines the angle of the fracture,
${\sigma _n},\;{\tau _{nt}},\;{\tau _{nl}}$
). The common action plane defines the angle of the fracture,
 ${\rm{\theta }}$
, where the plane stresses act. Unlike Hashin criterion, Puck is not defined with a fixed angle. The fracture angle is calculated by means of an iterative process related to the IFF functions between −90
${\rm{\theta }}$
, where the plane stresses act. Unlike Hashin criterion, Puck is not defined with a fixed angle. The fracture angle is calculated by means of an iterative process related to the IFF functions between −90
 $^{\circ}$
and 90
$^{\circ}$
and 90
 $^{\circ}$
that maximises the IFF mode [Reference Puck and Schürmann40]. The IFF mode, as a function of the fracture angle in tensile loading is named
$^{\circ}$
that maximises the IFF mode [Reference Puck and Schürmann40]. The IFF mode, as a function of the fracture angle in tensile loading is named
 ${{IF}}{{{F}}_{{ + }}}\left( {{\theta }} \right)$
, and in compressive loading
${{IF}}{{{F}}_{{ + }}}\left( {{\theta }} \right)$
, and in compressive loading
 ${{IF}}{{{F}}_{{ - }}}\left( {\rm{\theta }} \right)$
for the Puck criterion, derivations for which can be found in Ref. (Reference Puck and Schürmann40). The action plane stresses used in the Puck criterion are calculated using Equations (3), (4) and (5) [Reference Puck and Schürmann40].
${{IF}}{{{F}}_{{ - }}}\left( {\rm{\theta }} \right)$
for the Puck criterion, derivations for which can be found in Ref. (Reference Puck and Schürmann40). The action plane stresses used in the Puck criterion are calculated using Equations (3), (4) and (5) [Reference Puck and Schürmann40].
 \begin{align}{\sigma _n}\left( \theta \right) = {\sigma _{22}}{\cos ^2}\theta + {\sigma _{33}}{\rm{si}}{{\rm{n}}^2}\theta + 2{\sigma _{23}}{\rm{sin}}\theta {\rm{cos}}\theta \end{align}
 \begin{align}{\tau _{nt}}\left( \theta \right) = \left( {{\sigma _{33}} - {\sigma _{22}}} \right){\rm{sin}}\theta {\rm{cos}}\theta + {\sigma _{23}}\left( {{\rm{co}}{{\rm{s}}^2}\theta - {\rm{si}}{{\rm{n}}^2}\theta } \right)\end{align}
 \begin{align}{\tau _{nl}}\left( \theta \right) = {\sigma _{31}}\sin \theta + {\sigma _{21}}{\rm{cos}}\theta \end{align}
The Cuntze criterion is based on the definition of five different failure mechanisms [Reference Cuntze and Freund41, Reference Rezasefat, Gonzalez-jimenez, Giglio and Manes42]. Two of them are related to the fibres, one for tension failure (FF1) and one for compression failure (FF2), with the remaining three associated with the inter-fibre failure, corresponding to the matrix rupture. These include tensile matrix failure (IFF1), compressive matrix failure (IFF2), and matrix shear failure (IFF3). The Cuntze criterion considers the interaction of these modes by using a global failure criterion (
 ${{Ef{f}}}{^m}$
), where each failure mode represents a portion of the load-carrying capacity of the material. These capacities quantify the ‘risk’ of fracture in their respective directions, as well as the risk of the global failure, which is calculated using Equation (6) [Reference Cuntze and Freund41].
${{Ef{f}}}{^m}$
), where each failure mode represents a portion of the load-carrying capacity of the material. These capacities quantify the ‘risk’ of fracture in their respective directions, as well as the risk of the global failure, which is calculated using Equation (6) [Reference Cuntze and Freund41].
 \begin{align}Ef{f^m} = {\left( {Ef{f^{\parallel \sigma }}} \right)^m} + {\left( {Ef{f^{\parallel \tau }}} \right)^m} + {\left( {Ef{f^{ \bot \sigma }}} \right)^m} + {\left( {Ef{f^{ \bot \tau }}} \right)^m} + {\left( {Ef{f^{ \bot \parallel }}} \right)^m}\end{align}
The variable
 ${\rm{m}}$
here is the interaction exponent obtained by curve fitting (for CFRP, the recommended range is 2.5<
${\rm{m}}$
here is the interaction exponent obtained by curve fitting (for CFRP, the recommended range is 2.5<
 ${\rm{m}}$
<3.5). The interaction between FF and IFF modes is defined using stress effort, which sums up the contribution of each model. Therefore, the Cuntze’s criterion was defined for the IFF depending on the loading direction as
${\rm{m}}$
<3.5). The interaction between FF and IFF modes is defined using stress effort, which sums up the contribution of each model. Therefore, the Cuntze’s criterion was defined for the IFF depending on the loading direction as
 ${{IF}}{{{F}}_{{ + }}}$
and
${{IF}}{{{F}}_{{ + }}}$
and
 ${{IF}}{{{F}}_{{ - }}}$
, and with a shear stress influence as
${{IF}}{{{F}}_{{ - }}}$
, and with a shear stress influence as
 ${{IF}}{{{F}}_{{{shear}}}}$
. A more detailed description and derivation of Cuntze’s functions can be found in Ref. (Reference Cuntze and Freund41).
${{IF}}{{{F}}_{{{shear}}}}$
. A more detailed description and derivation of Cuntze’s functions can be found in Ref. (Reference Cuntze and Freund41).
In the current study, the same failure modes in the fibre direction (tension and compression) were assumed for the Puck and Cuntze criteria, as shown in Equations (7) and (8).
 \begin{align}FF1 = \frac{{{\sigma _{11}}}}{{{X_t}}}\end{align}
 \begin{align}FF2 = \frac{{ - {\sigma _{11}}}}{{{X_c}}}\end{align}
The Hashin criterion uses similar failure mode in compression as denoted in Equation (8) above. The tensile fibre mode is different, and is shown in Equation (9):
 \begin{align}FF1 = {\left( {\frac{{{\sigma _{11}}}}{{{X_t}}}} \right)^2} + \frac{{{\sigma _{12}}^2 + {\sigma _{13}}^2}}{{{S_{12}}^2}}\end{align}
3.3.2 Inter-laminar failure
VCCT is an efficient method for delamination analysis. The theoretical background of the model is based on the work done by Rybicki and Kanninen [Reference Rybicki and Kanninen43]. The method has been implemented in several software codes, including Abaqus/Explicit. VCCT evaluates the energy release rate (
 $G$
) for each fracture mode at the delamination edge (crack-tip) by using nodal displacements and forces. The criticality of the delamination initiation is defined with the mixed-mode fracture criterion. The mixed-mode fracture criterion is employed in the current work as Equation (10):
$G$
) for each fracture mode at the delamination edge (crack-tip) by using nodal displacements and forces. The criticality of the delamination initiation is defined with the mixed-mode fracture criterion. The mixed-mode fracture criterion is employed in the current work as Equation (10):
 \begin{align}f = {\left( {{G_{\rm{I}}}/{G_{{\rm{Ic}}}}} \right)^{\rm{\alpha }}} + {\left( {{G_{{\rm{II}}}}/{G_{{\rm{IIc}}}}} \right)^{\rm{\beta }}}\end{align}
Based on previous investigations with the same material [Reference Hintikka, Wallin and Saarela44], the fracture toughness was defined for Mode I,
 ${{{G}}_{{{Ic}}}}$
, as 72J/
${{{G}}_{{{Ic}}}}$
, as 72J/
 ${{\rm{m}}^{\rm{2}}}$
and Mode II,
${{\rm{m}}^{\rm{2}}}$
and Mode II,
 ${{{G}}_{{{IIc}}}}{{,}}$
as 779J/
${{{G}}_{{{IIc}}}}{{,}}$
as 779J/
 ${{\rm{m}}^{\rm{2}}}$
. The power values for Mode I (
${{\rm{m}}^{\rm{2}}}$
. The power values for Mode I (
 ${\rm{\alpha }}$
) and II (
${\rm{\alpha }}$
) and II (
 ${\rm{\beta }}$
) were defined as 0.75 and 0.69, respectively. A high value for G
IIIC (10,000J/m2) is used in analysis to remove the effects of fracture Mode III. VCCT is modelled between the bottom two plies, seventh and eighth. A pre-crack is defined for the interface plane.
${\rm{\beta }}$
) were defined as 0.75 and 0.69, respectively. A high value for G
IIIC (10,000J/m2) is used in analysis to remove the effects of fracture Mode III. VCCT is modelled between the bottom two plies, seventh and eighth. A pre-crack is defined for the interface plane.
3.4 Impact modelling in LS-Dyna
The constitutive model for simulating the indentation in LS-Dyna is the same as those used in Abaqus/Explicit: an elastic material model with ply and stiffness properties from Tables 1 and 2. The impact test in LS-Dyna is modelled using an enhanced composite damage material model with incorporated damage evolution [Reference Hallquist33, Reference Chang and Kuo-yen34]. Delamination is modelled using two different methods, cohesive zone model with decohesion elements and the tiebreak contact algorithm with contact interaction. The performance of both methods is separately determined using the full model. Special attention is given to the analysis of the ply failure when delamination exists within the laminate.
3.4.1 Intra-laminar failure
In LS-Dyna, MAT54 material model is used to model the unidirectional laminate. The stress-strain behaviour of the material in the elastic region is assessed by Equations (11)–(13) [Reference Wade, Feraboli, Osborne and Rassaian35]:
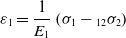 \begin{align}{\varepsilon _1} = \frac{1}{{{E_1}}}\left( {{\sigma _1} - {_{12}}{\sigma _2}} \right)\end{align}
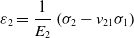 \begin{align}{\varepsilon _2} = \frac{1}{{{E_2}}}\left( {{\sigma _2} - {v_{21}}{\sigma _1}} \right)\end{align}
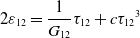 \begin{align}2{\varepsilon _{12}} = \frac{1}{{{G_{12}}}}{\tau _{12}} + c{\tau _{12}}^3\end{align}
where direction-1 indicates the fibre axial direction, direction-2 indicates the matrix transverse direction, and direction-12 indicates the shear direction. Here,
 $c$
is an input parameter accounting for the nonlinear shear stress term, which must be calibrated whenever shear is present.
$c$
is an input parameter accounting for the nonlinear shear stress term, which must be calibrated whenever shear is present.
The Chang-Chang composite damage model [Reference Chang and Kuo-yen34] is used within MAT54 beyond the elastic region. It is an updated form of Hashin comprehensive composite damage model [Reference Hashin45]. The model assumes that unidirectional CFRP behaves transversely isotropic in the fibre direction. It includes a mixed mode term, known as the shear stress weighing factor,
 ${\rm{\beta }}$
, which allows interaction between shear and normal failure modes. Setting
${\rm{\beta }}$
, which allows interaction between shear and normal failure modes. Setting
 ${\rm{\beta }}$
to 0 initiates the Hashin failure criterion, whereas setting it to 1 executes maximum stress failure criteria [Reference Wade, Feraboli, Osborne and Rassaian35]. This damage model analytically computes the stresses and damage progression of the fibre and matrix separately to determine the condition of an individual ply. The Chang-Chang failure mode is described by Equations (14)–(17) where the tensile fibre mode is as follows:
${\rm{\beta }}$
to 0 initiates the Hashin failure criterion, whereas setting it to 1 executes maximum stress failure criteria [Reference Wade, Feraboli, Osborne and Rassaian35]. This damage model analytically computes the stresses and damage progression of the fibre and matrix separately to determine the condition of an individual ply. The Chang-Chang failure mode is described by Equations (14)–(17) where the tensile fibre mode is as follows:
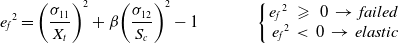 \begin{align}{e_f}^2 = {\left( {\frac{{{\sigma _{11}}}}{{{X_t}}}} \right)^2} + \beta {\left( {\frac{{{\sigma _{12}}}}{{{S_c}}}} \right)^2} - 1{\rm{\;\;\;\;\;\;\;\;\;\;\;\;\;\;\;\;\;}}\left\{ {\begin{array}{*{20}{c}}{{e_f}^2\;\; \geqslant \;\;0\; \to \;failed\;}\\{{e_f}^2\; \lt \;0\; \to \;elastic}\end{array}} \right.\end{align}
The compressive fibre mode is defined as:
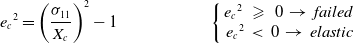 \begin{align}{\rm{\;\;\;\;\;\;\;\;\;\;\;\;\;\;\;\;\;\;\;\;\;\;\;\;\;\;\;}}{e_c}^2 = {\left( {\frac{{{\sigma _{11}}}}{{{X_c}}}} \right)^2} - 1{\rm{\;\;\;\;\;\;\;\;\;\;\;\;\;\;\;\;\;\;\;\;\;\;\;\;\;\;\;\;}}\left\{ {\begin{array}{*{20}{c}}{{e_c}^2\;\; \geqslant \;\;0\; \to \;failed\;}\\{{e_c}^2\; \lt \;0\; \to \;elastic}\end{array}} \right.\end{align}
where
 ${{{X}}_{{t}}}$
and
${{{X}}_{{t}}}$
and
 ${{{X}}_{{c}}}$
are the fibre longitudinal tensile and compressive strengths, respectively, and
${{{X}}_{{c}}}$
are the fibre longitudinal tensile and compressive strengths, respectively, and
 ${{{e}}_{{f}}}$
as well as
${{{e}}_{{f}}}$
as well as
 ${{{e}}_{{c}}}$
are the fibre failure parameter.
${{{e}}_{{c}}}$
are the fibre failure parameter.
 ${{\rm{\sigma }}_{{\rm{11}}}}$
represents the longitudinal stress and
${{\rm{\sigma }}_{{\rm{11}}}}$
represents the longitudinal stress and
 ${{\rm{\sigma }}_{{\rm{12}}}}$
the shear stress of each layer. S
c
denotes the matrix shear strength [Reference Hallquist33, Reference Brandon46]. The tensile matrix mode is defined as:
${{\rm{\sigma }}_{{\rm{12}}}}$
the shear stress of each layer. S
c
denotes the matrix shear strength [Reference Hallquist33, Reference Brandon46]. The tensile matrix mode is defined as:
 \begin{align}{\rm{\;\;\;\;\;\;\;\;\;\;}}{e_m}^2 = {\left( {\frac{{{\sigma _{22}}}}{{{Y_t}}}} \right)^2} + {\left( {\frac{{{\sigma _{12}}}}{{{S_c}}}} \right)^2} - 1{\rm{\;\;\;\;\;\;\;\;\;\;\;\;\;\;\;\;\;\;}}\left\{ {\begin{array}{*{20}{c}}{{e_m}^2\;\; \geqslant \;\;0\; \to \;failed\;}\\{{e_m}^2\; \lt \;0\; \to \;elastic}\end{array}} \right.\end{align}
And the compressive matrix mode is as follows:
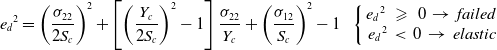 \begin{align}{e_d}^2 = {\left( {\frac{{{\sigma _{22}}}}{{2{S_c}}}} \right)^2} + \left[ {{{\left( {\frac{{{Y_c}}}{{2{S_c}}}} \right)}^2} - 1} \right]\frac{{{\sigma _{22}}}}{{{Y_c}}} + {\left( {\frac{{{\sigma _{12}}}}{{{S_c}}}} \right)^2} - 1{\rm{\;\;\;}}\left\{ {\begin{array}{*{20}{c}}{{e_d}^2\;\; \geqslant \;\;0\; \to \;failed\;}\\{{e_d}^2\; \lt \;0\; \to \;elastic}\end{array}} \right.\end{align}
where
 ${{{Y}}_{{t}}}$
and
${{{Y}}_{{t}}}$
and
 ${{{Y}}_{{c}}}$
are the transverse tensile and compressive strength of the matrix.
${{{Y}}_{{c}}}$
are the transverse tensile and compressive strength of the matrix.
 ${{{e}}_{{m}}}$
and
${{{e}}_{{m}}}$
and
 ${{{e}}_{{d}}}$
are the matrix failure parameter that determines matrix cracking [Reference Hallquist33–Reference Wade, Feraboli, Osborne and Rassaian35].
${{{e}}_{{d}}}$
are the matrix failure parameter that determines matrix cracking [Reference Hallquist33–Reference Wade, Feraboli, Osborne and Rassaian35].
The Chang-Chang composite damage criteria within MAT54 material model in LS-Dyna assumes a linear elastic ply level response until failure, without pre- or post-peak softening. It contains a set of non-physical input parameters which determines the element failure and can be divided into three categories: erosion, crashfront softening factors and parameters describing the material behaviour after failure initiation [Reference Aleksandr, Montesano and Butcher47]. For solid elements, an element is deleted when its single integration point has met the failure criteria. Elements with shared nodes with deleted element become crashfront elements which can have their strengths reduced by varying the non-physical SOFT input parameters. Failed ply can still carry a significant amount of stress and energy, and only once it reaches failure using one of the non-physical input parameters or an effective failure strain, the stresses are reduced to zero and the element is deleted [Reference Hallquist33]. For this study, the built-in default YCFAC strength reduction factor for compressive fibre strength after matrix failure is used to degrade the fibre strengths of the plies if compressive matrix failure would take place [Reference Hallquist33]. This parameter simulates damage caused to the fibres from failed matrix [Reference Wade, Feraboli, Osborne and Rassaian35]. Additionally, the built-in default SOFT material strength reduction parameter is used to reduce the strengths of the elements ahead of the crashfront [Reference Hallquist33]. It is used to degrade the strengths of the surrounding elements to simulate the damage propagation from the crashfront [Reference Wade, Feraboli, Osborne and Rassaian35]. The failure stress and strain inputs were not defined within the composite damage model to ensure an elastic response of the plies during the impact.
3.4.2 Inter-laminar failure
3.4.2.1 Cohesive zone method
CZM is based on the fracture model originally proposed by Dugdale [Reference Dugdale48] and Barenblatt [Reference Barenblatt49]. An alternative to the VCCT, it is one of the most widely used approaches to investigate interface bonding failure [Reference Siddens and Bayandor22–Reference Bayandor, Thomson and Callus24, Reference Brandon46]. It assumes a cohesive damage zone that develops near the crack tip and uses strain energy release rates,
 ${{G}}$
, during the formation of fracture to predict delamination [Reference Siddens and Bayandor22]. Hence, CZM is governed by the properties of the material, crack initiation condition and a crack evolution function, where it relates the surface loads in normal and shear direction,
${{G}}$
, during the formation of fracture to predict delamination [Reference Siddens and Bayandor22]. Hence, CZM is governed by the properties of the material, crack initiation condition and a crack evolution function, where it relates the surface loads in normal and shear direction,
 ${\rm{\sigma }}$
, to the displacement. Crack initiation takes place when the model reaches maximum interface strength,
${\rm{\sigma }}$
, to the displacement. Crack initiation takes place when the model reaches maximum interface strength,
 ${{\rm{\sigma }}^{\rm{0}}}$
, that is the maximum load on stress-displacement relation [Reference Siddens and Bayandor22, Reference Turon, Davila, Camanho and Costa50].
${{\rm{\sigma }}^{\rm{0}}}$
, that is the maximum load on stress-displacement relation [Reference Siddens and Bayandor22, Reference Turon, Davila, Camanho and Costa50].
Several linear and non-linear constitutive failure damage formulations exist for defining the cohesive law. The law used in this study is governed by a bilinear stress-displacement relation as well as mixed-mode to represent the interactions of Mode I, Mode II, and Mode III separation. Figure 6 shows the bilinear stress-displacement relation used in this study [Reference Siddens and Bayandor22, Reference Bak, Sarrado, Turon and Costa51]. The area under the stress-displacement relation is equal to the energy release rate,
 ${{G}}$
, or the fracture toughness
${{G}}$
, or the fracture toughness
 ${{{G}}_{{c}}}$
, that is the critical value of
${{{G}}_{{c}}}$
, that is the critical value of
 ${{G}}$
for delamination growth [Reference Bayandor, Thomson and Callus24, 52]. In LS-Dyna, energy release rates are assigned for both Mode I and Mode II. Mode III is assumed to be nearly identical to Mode II separation. This allows the cohesive model to utilise mixed mode capability which combines the energy release rate. This is used in conjunction with a damage formulation (progressive softening) where mixed-mode displacement for total failure is computed using either Power law or Benzeggagh-Kenane (B-K) law [Reference Benzeggagh and Kenane53]. The interface bond softening happens when the separation and sliding between the plies exceeds the softening strain,
${{G}}$
for delamination growth [Reference Bayandor, Thomson and Callus24, 52]. In LS-Dyna, energy release rates are assigned for both Mode I and Mode II. Mode III is assumed to be nearly identical to Mode II separation. This allows the cohesive model to utilise mixed mode capability which combines the energy release rate. This is used in conjunction with a damage formulation (progressive softening) where mixed-mode displacement for total failure is computed using either Power law or Benzeggagh-Kenane (B-K) law [Reference Benzeggagh and Kenane53]. The interface bond softening happens when the separation and sliding between the plies exceeds the softening strain,
 ${{\rm{\delta }}^{\rm{0}}}{\rm{.\;}}$
Once the failure strain,
${{\rm{\delta }}^{\rm{0}}}{\rm{.\;}}$
Once the failure strain,
 ${{\rm{\delta }}^{\rm{F}}}$
, is reached, the interface bond fails and delamination occurs [Reference Siddens and Bayandor22]. The formulation for Power and B-K law implemented in LS-Dyna can be found in Ref. (Reference Hallquist33).
${{\rm{\delta }}^{\rm{F}}}$
, is reached, the interface bond fails and delamination occurs [Reference Siddens and Bayandor22]. The formulation for Power and B-K law implemented in LS-Dyna can be found in Ref. (Reference Hallquist33).

Figure 6. Bilinear traction-displacement relationships [Reference Siddens and Bayandor22, Reference Hallquist33].
The slope of the bilinear stress-displacement before damage initiation, K, is known as the interface stiffness or penalty stiffness as it is referred to in LS-Dyna. Turon et al. [Reference Turon, Davila, Camanho and Costa50] formulated that the effective elastic properties of the composite laminate are not affected by the cohesive surface properties whenever
 ${{{E}}_{{3}}} \ll {{\;Kt}}$
, refer to Equation (18).
${{{E}}_{{3}}} \ll {{\;Kt}}$
, refer to Equation (18).
 \begin{align}K = \frac{{\alpha {E_3}}}{t}\end{align}
where
 ${{{E}}_{{3}}}$
is the through-thickness Young’s modulus of the material, which for a transversely isotropic material is
${{{E}}_{{3}}}$
is the through-thickness Young’s modulus of the material, which for a transversely isotropic material is
 ${{{E}}_{{3}}}{{ = \;}}{{{E}}_{{2}}}$
and
${{{E}}_{{3}}}{{ = \;}}{{{E}}_{{2}}}$
and
 $t$
is the sub-laminate thickness.
$t$
is the sub-laminate thickness.
 ${\rm{\alpha }}$
is a parameter that is recommended to be much larger than 1. Values of
${\rm{\alpha }}$
is a parameter that is recommended to be much larger than 1. Values of
 $\alpha $
are recommended to be greater than 50 [Reference Turon, Davila, Camanho and Costa50].
$\alpha $
are recommended to be greater than 50 [Reference Turon, Davila, Camanho and Costa50].
The crack propagates when the energy release rates reach their critical values
 ${{{G}}_{{c}}}$
, that is their fracture toughness [Reference Turon, Davila, Camanho and Costa50]. The distance from the crack tip to the point where the maximum stress (cohesive traction) is achieved is referred to as the length of the cohesive zone,
${{{G}}_{{c}}}$
, that is their fracture toughness [Reference Turon, Davila, Camanho and Costa50]. The distance from the crack tip to the point where the maximum stress (cohesive traction) is achieved is referred to as the length of the cohesive zone,
 ${{{l}}_{{{cz}}}}$
. Several different models have been proposed to estimate the cohesive zone length [Reference Dugdale48, Reference Barenblatt49, Reference Irwin54–Reference Song, Dávila and Rose59]. All of these proposed models have the form as shown in Equation (19).
${{{l}}_{{{cz}}}}$
. Several different models have been proposed to estimate the cohesive zone length [Reference Dugdale48, Reference Barenblatt49, Reference Irwin54–Reference Song, Dávila and Rose59]. All of these proposed models have the form as shown in Equation (19).
 \begin{align}{l_{cz}} = ME\frac{{{G_c}}}{{{{\left( {{\sigma ^0}} \right)}^2}}}\end{align}
where
 ${{E}}$
is the Young’s modulus of the laminate and
${{E}}$
is the Young’s modulus of the laminate and
 ${{M}}$
is a parameter that depends on the different cohesive zone length models. This study uses the Rice [Reference Rice56] and Falk et al. [Reference Falk, Needleman and Rice57] recommended parameter defining the cohesive zone length. In terms of LS-Dyna parameters, the cohesive zone lengths can be defined for both Mode I and Mode II as shown in Equation (20), where i represents either Mode I or Mode II, and X represents either T (the normal peak load input value) for Mode I, or S (the shear peak load input value) for Mode II.
${{M}}$
is a parameter that depends on the different cohesive zone length models. This study uses the Rice [Reference Rice56] and Falk et al. [Reference Falk, Needleman and Rice57] recommended parameter defining the cohesive zone length. In terms of LS-Dyna parameters, the cohesive zone lengths can be defined for both Mode I and Mode II as shown in Equation (20), where i represents either Mode I or Mode II, and X represents either T (the normal peak load input value) for Mode I, or S (the shear peak load input value) for Mode II.
 \begin{align}{l_{cz,i}} = ME\frac{{{G_{Ic}}}}{{{{\left( X \right)}^2}}}\end{align}
For mixed-mode, the cohesive zone length must satisfy the following conditions shown in Equation (21).
 \begin{align}{l_e} \le \frac{{{l_{cz,i}}}}{{{N_e}}}\end{align}
where
 ${{{N}}_{{e}}}$
is the number of elements in the cohesive zone and
${{{N}}_{{e}}}$
is the number of elements in the cohesive zone and
 ${{{l}}_{{e}}}$
is the mesh size used in the direction of crack propagation [Reference Turon, Davila, Camanho and Costa50, Reference Song, Dávila and Rose59]. If the cohesive zone is not discretised by enough elements, then the distribution of load ahead of the crack is not represented correctly in FEM. Therefore, Turon et al. [Reference Turon, Davila, Camanho and Costa50] suggest using a minimum of three elements in the cohesive zone to predict the propagation of delamination. However, such fine mesh requirements can make structural analysis computationally expensive and therefore not feasible for some studies [Reference Song, Dávila and Rose59]. It can be seen from Equation (21) that the cohesive zone length is inversely proportional to the square of the interface peak loads. The length of the cohesive zone can therefore be theoretically lengthened to ensure that they span enough elements of the given size. Using this methodology, we can obtain the required normal and shear peak loads that would allow us to use an appropriate cohesive zone length without making the mesh overly fine [Reference Turon, Davila, Camanho and Costa50, Reference Song, Dávila and Rose59]:
${{{l}}_{{e}}}$
is the mesh size used in the direction of crack propagation [Reference Turon, Davila, Camanho and Costa50, Reference Song, Dávila and Rose59]. If the cohesive zone is not discretised by enough elements, then the distribution of load ahead of the crack is not represented correctly in FEM. Therefore, Turon et al. [Reference Turon, Davila, Camanho and Costa50] suggest using a minimum of three elements in the cohesive zone to predict the propagation of delamination. However, such fine mesh requirements can make structural analysis computationally expensive and therefore not feasible for some studies [Reference Song, Dávila and Rose59]. It can be seen from Equation (21) that the cohesive zone length is inversely proportional to the square of the interface peak loads. The length of the cohesive zone can therefore be theoretically lengthened to ensure that they span enough elements of the given size. Using this methodology, we can obtain the required normal and shear peak loads that would allow us to use an appropriate cohesive zone length without making the mesh overly fine [Reference Turon, Davila, Camanho and Costa50, Reference Song, Dávila and Rose59]:
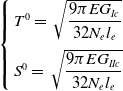 \begin{align}\left\{ {\begin{array}{*{20}{c}}{{T^0} = \;\sqrt {\dfrac{{9\pi E{G_{Ic}}}}{{32{N_e}{l_e}}}} }\\[11pt] {{S^0} = \;\sqrt {\dfrac{{9\pi E{G_{IIc}}}}{{32{N_e}{l_e}}}} }\end{array}} \right.\end{align}
and the normal and shear peak loads to be used in the model can be selected based on the criteria:
 \begin{align}\left\{ {\begin{array}{*{20}{c}}{\bar T = Min\left\{ {{T^0},T} \right\}}\\{\bar S = Min\left\{ {{S^0},S} \right\}}\end{array}} \right.\end{align}
3.4.2.2 Tiebreak contact
An alternative to the cohesive zone model technique is the tiebreak contact algorithm in LS-Dyna that uses a segment-based approach to model cohesive interaction between the plies or laminates. By implementing the Dycoss Discrete Crack Method [Reference Lemmen and Meijer60] within the tiebreak contact, a bilinear stress-displacement relation can be used similar to the cohesive zone method. LS-Dyna defines tiebreak contacts as penalty-based with the added feature of including a failure criterion [Reference Hallquist33]. The tiebreak contact works in a similar way as regular contacts under compressive load. The separation phenomenon between surfaces is defined by a strength-based failure criterion [Reference Xiao, Botkin and Johnson61]. For that, it requires definition of a normal failure stress parameter, NFLS, and a shear failure stress parameter, SFLS [Reference Hallquist33, Reference Brandon46].
Tiebreak contact essentially models a theoretical interlaminar bonding based on the normal and shear peak stress. This allows the delamination to propagate from the initiation zone based on mixed-mode, which combines the crack opening damage (mode I) and in-plane shear damage (mode II). This is used in conjunction with a damage formulation where mixed-mode displacement for total failure is computed using either Power Law or Benzeggagh-Kenane’s [Reference Benzeggagh and Kenane53]. An advantage of using tiebreak contact is that it does not require any additional layer of elements to be modelled or defined at the interface as it uses a segment-based approach, where the faces of the ply elements are bonded. Figure 7 shows a comparison between the cohesive zone model and tiebreak contact.
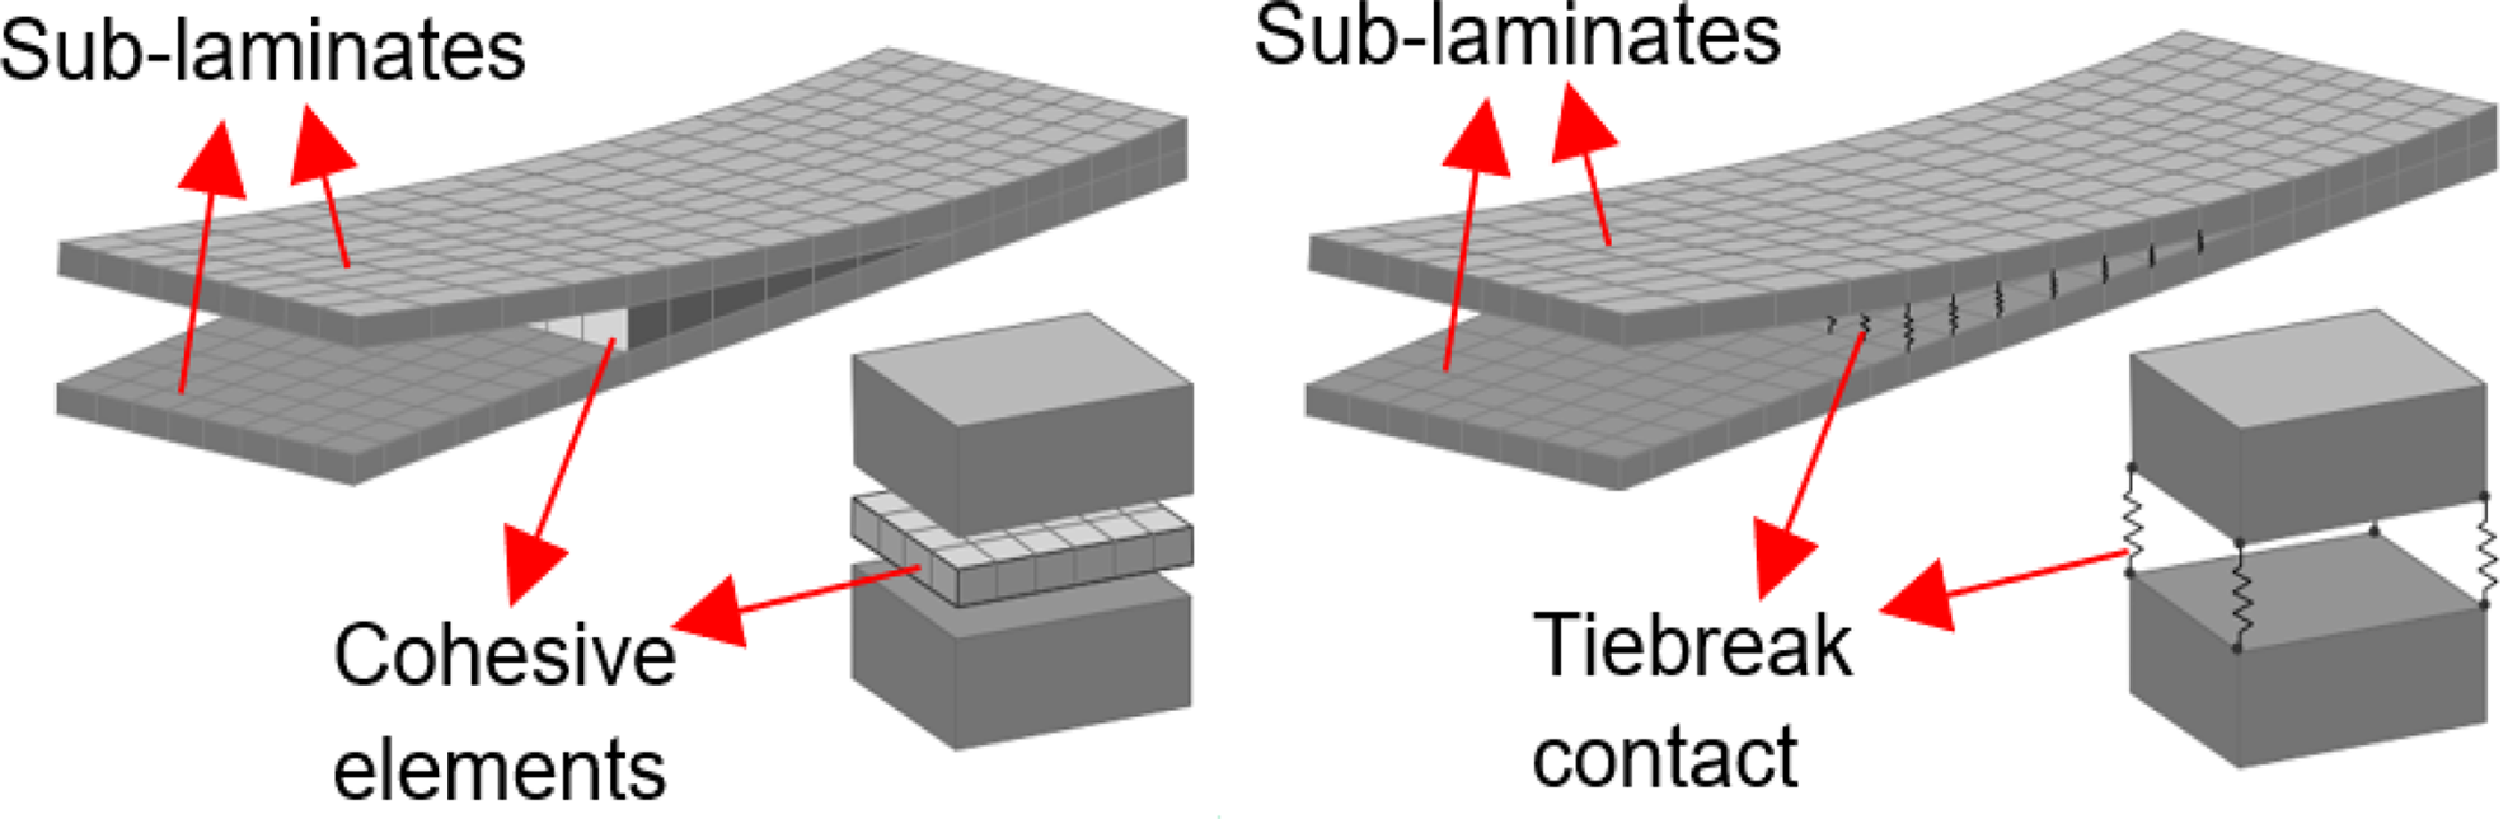
Figure 7. Comparison of cohesive elements and tiebreak contact [Reference Mohammed, Paiva and Mayer62].
4.0 Results
4.1 Quasi-static indentation test
Quasi-static indentation test results are used for the calibration of constitutive response of the two FE models (Abaqus/Standard and LS-Dyna). The results obtained from DIC are compared with the FE results from both FE models. The displacement field is shown in Fig. 8, while the strain field is depicted in Fig. 9, both at the bottom ply (eighth ply) of the laminate. DIC outputs a displacement field based on a stepped distribution with its maximum value at the central region of the bottom ply. The results are in close agreement with the experimental finding. The displacement field follows the general trend where maximum displacement is found near the test area. The displacement in the ply radiates outwards as expected and seen from the experimental measurements. The magnitude of the displacement decreases as we move further away from the central impact region. FE results indicate values in the negative z-direction, which represents the direction in which the load is applied. Using both Abaqus/Standard and LS-Dyna, the maximum displacement is found to be at the centre of the impact region, where it reaches a value of 0.25mm, consistent with the DIC results.

Figure 8. Displacement fields – DIC data compared to FE simulations.

Figure 9. Strain fields – DIC data compared to FE simulations.
The DIC-based strain field is compared for the three in-plane directions at the bottom ply of the laminate, namely, longitudinal, transverse, and shear axes. FE results show a similar trend for all three in-plane directions. For longitudinal strain,
 ${\varepsilon _{xx}}$
, maximum value is found to be at the centre where it reaches 0.0035m/m (for both constitutive models). The minimum is seen at the outermost region of the impact area where values range from 0.0001 to -0.001m/m. For the transverse strain,
${\varepsilon _{xx}}$
, maximum value is found to be at the centre where it reaches 0.0035m/m (for both constitutive models). The minimum is seen at the outermost region of the impact area where values range from 0.0001 to -0.001m/m. For the transverse strain,
 ${\varepsilon _{yy}}$
, the maximum strain value is found to be at the centre of the impact region where the value rises to 0.0095, whereas the minimum value is around the outer region where it reaches -0.001. Shear strain,
${\varepsilon _{yy}}$
, the maximum strain value is found to be at the centre of the impact region where the value rises to 0.0095, whereas the minimum value is around the outer region where it reaches -0.001. Shear strain,
 ${\varepsilon _{xy}}$
, results are found to be close to the experimental results, however, they vary slightly between the two constitutive models, with Abaqus results being slightly stiffer. Nonetheless, the results are in the acceptable range where maximum strain of around 0.0016 occurs at the outer regions of the impact area and minimum strain of around -0.0014 at the centre region.
${\varepsilon _{xy}}$
, results are found to be close to the experimental results, however, they vary slightly between the two constitutive models, with Abaqus results being slightly stiffer. Nonetheless, the results are in the acceptable range where maximum strain of around 0.0016 occurs at the outer regions of the impact area and minimum strain of around -0.0014 at the centre region.
Figure 10 shows the overall deflection in the xz (a) and yz (b) planes. The results obtained using the constitutive model of Abaqus/Standard and LS-Dyna match well with experimental data in fibre direction (0
 $^{\circ}$
ply). The FE results obtained for the xz direction are close to the experimental data in terms of both the values and curve shape, however for the yz direction, only in terms of the curve shapes. This could be due to the fact that the DIC data for the yz plane have a smaller regression error (
$^{\circ}$
ply). The FE results obtained for the xz direction are close to the experimental data in terms of both the values and curve shape, however for the yz direction, only in terms of the curve shapes. This could be due to the fact that the DIC data for the yz plane have a smaller regression error (
 ${{\rm{R}}^{\rm{2}}}$
= 0.97) than that of the xz plane. Such deviation might be a consequence of non-centric impact or asymmetry of the laminate.
${{\rm{R}}^{\rm{2}}}$
= 0.97) than that of the xz plane. Such deviation might be a consequence of non-centric impact or asymmetry of the laminate.
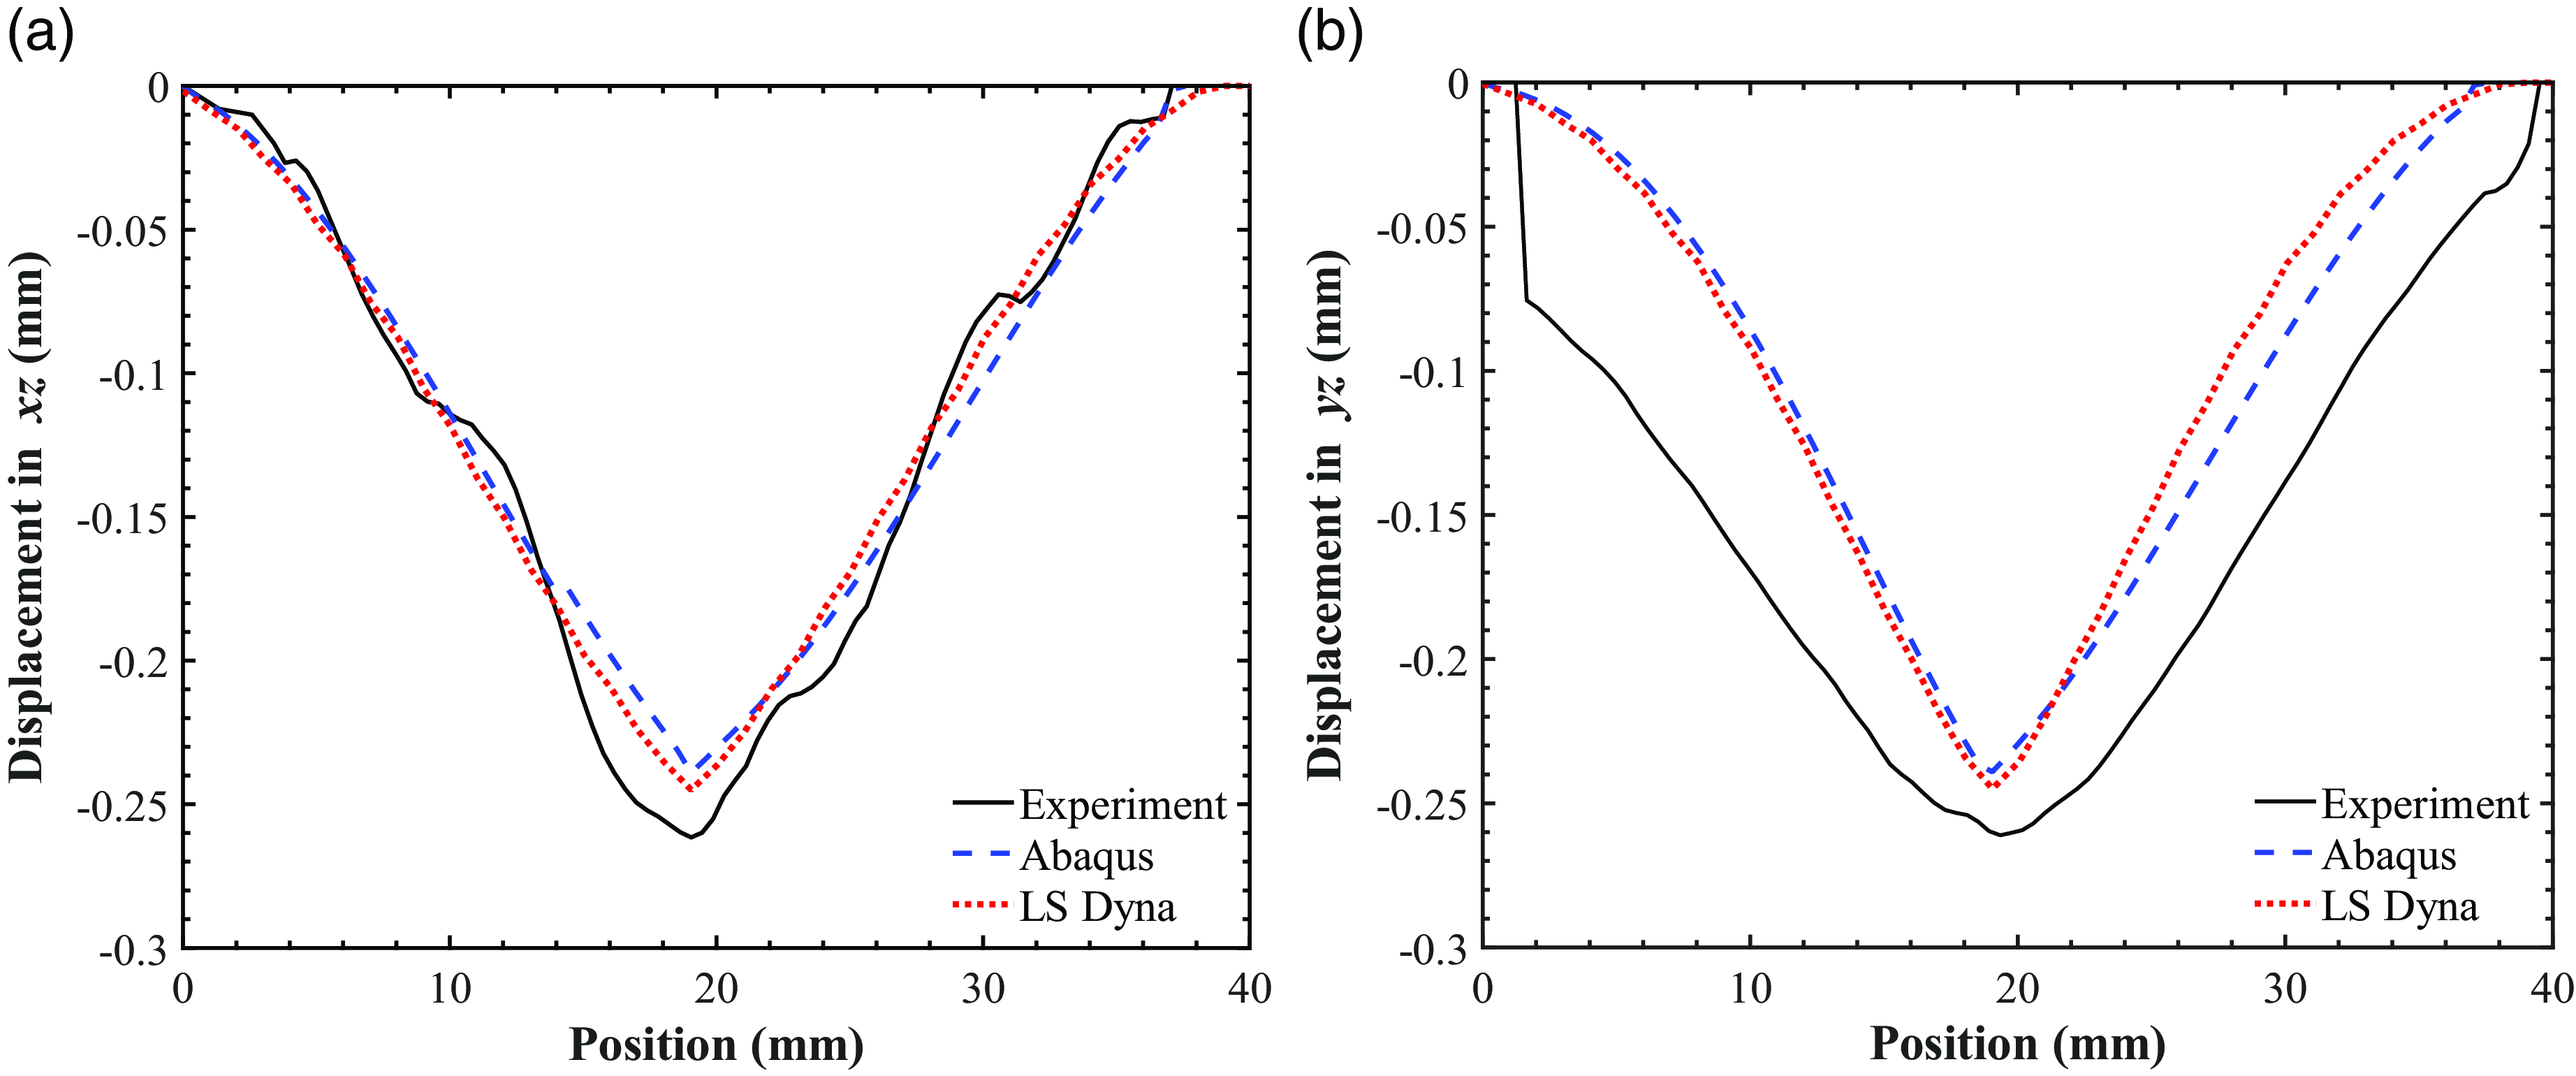
Figure 10. Comparison of xz (a) and yz (b) deflections for laminate.
Overall, both constitutive models capture the deflection well in xz and yz planes. Table 3 provides the maximum displacements of the experimental and modelling results. The maximum displacements from the experiment are approximately 0.26 mm in both xz and yz planes. Comparing the FE results, both models offer equivalent performance with less than 9% error. Their results are consistent with the fact that depending on the mesh size FE models tend to provide stiffer responses.
Table 3. Maximum displacement comparison
4.2 Dynamic impact test
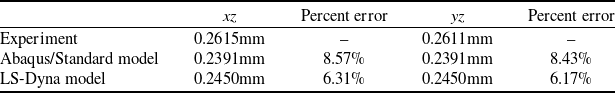
The results of the dynamic 5J impact test are presented in this section along with the comparison with both FE constitutive models. Figure 11 shows the impacted sample after the 5 J impact test. Impact damage was measured to be on the order of 10 mm from the test, which is in line with similar low energy impact tests [Reference James and Giurgiutiu9, Reference Ramakrishnan, Corn, Le moigne, Ienny and Slangen12].
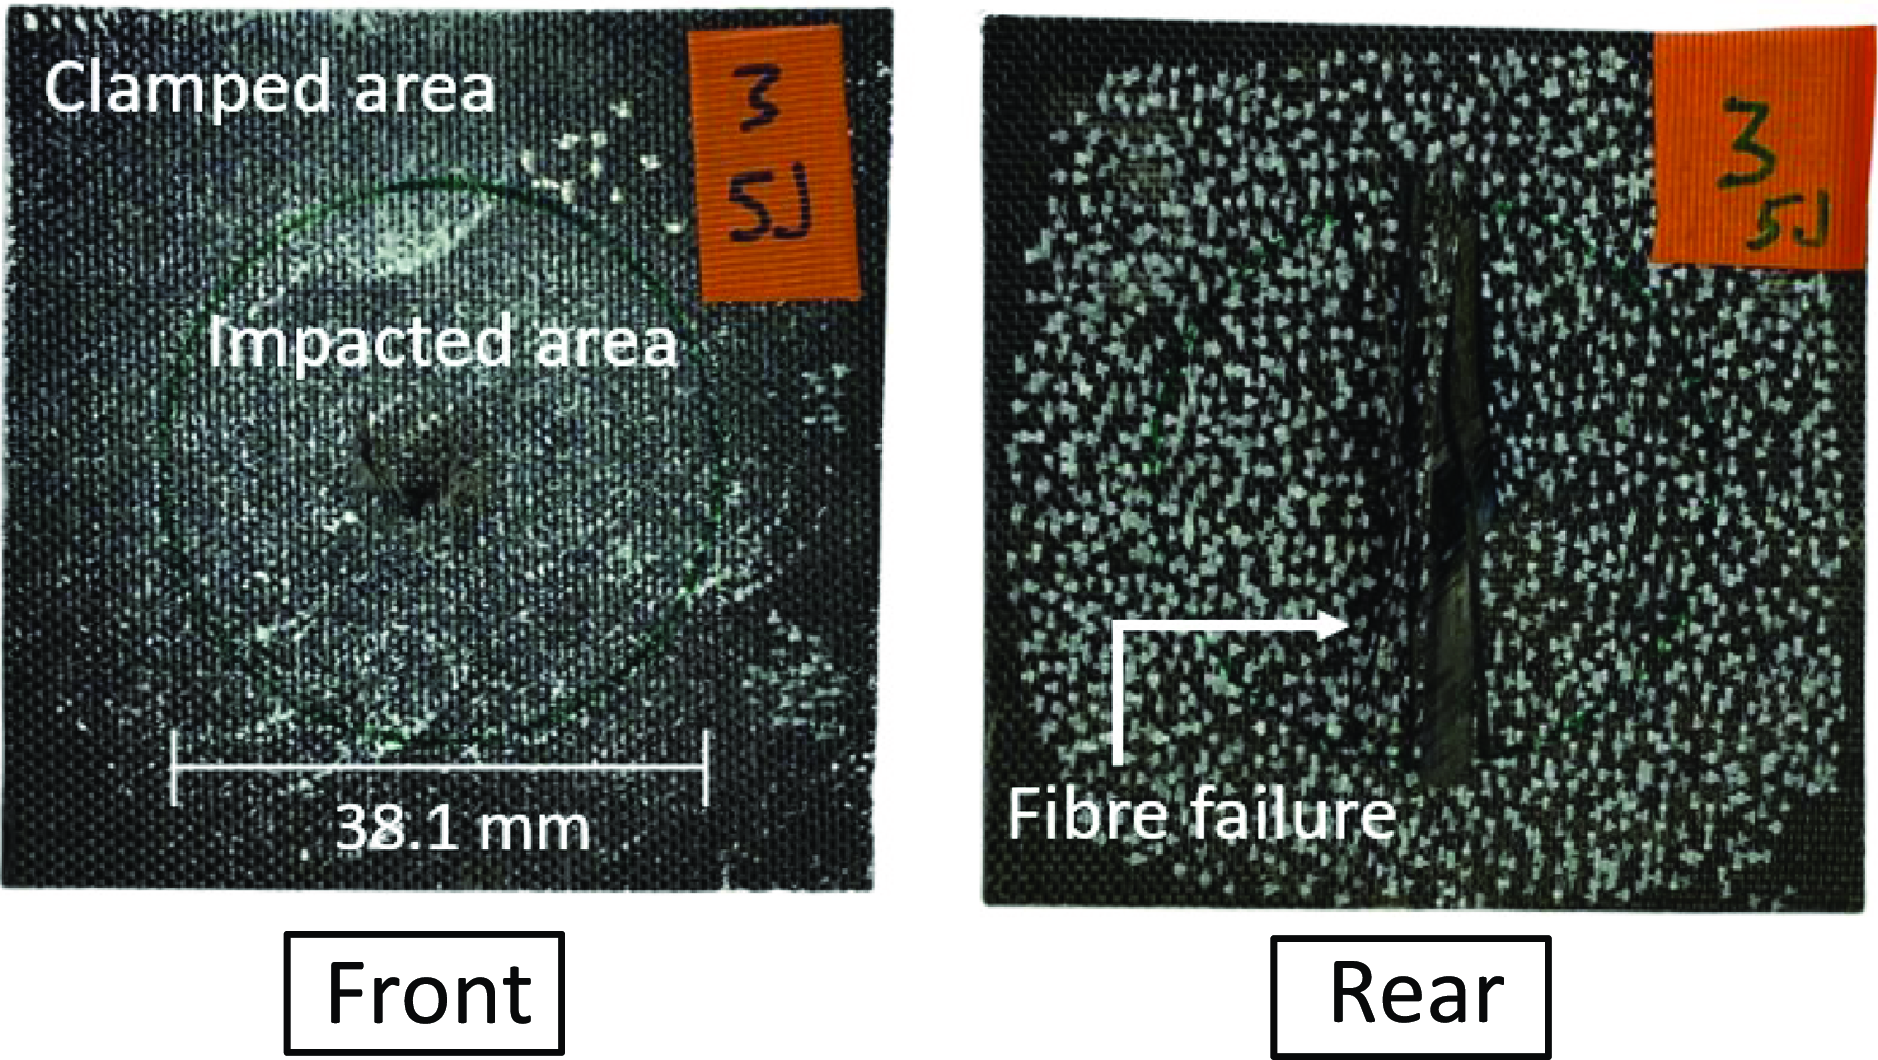
Figure 11. Front and rear view of test sample subject to 5J impact.
Figure 12 shows the recorded force-time history data from the 5 J impact test. The maximum force from the impact was recorded to be 1,232 N at 2 ms. The implementations carried out by both FE models are set to analyse and predict the impact response at the initial stages of delamination and damage within the plies. Therefore, the results from the FE analyses only shown up to the onset of damage (region of interest is highlighted in red) as this is the focus of the study.

Figure 12. Recorded force-time history from 5J impact test, highlighting the onset of impact damage as region of interest.
Figure 13 shows the force-time and force-displacement history up to the onset of damage for the two FE models compared with the experiment data. Results show good prediction of the impact force by the linear damage model implemented in Abaqus/Explicit with VCCT and the Chang-Chang composite damage model in LS-Dyna with CZM for delamination modelling.
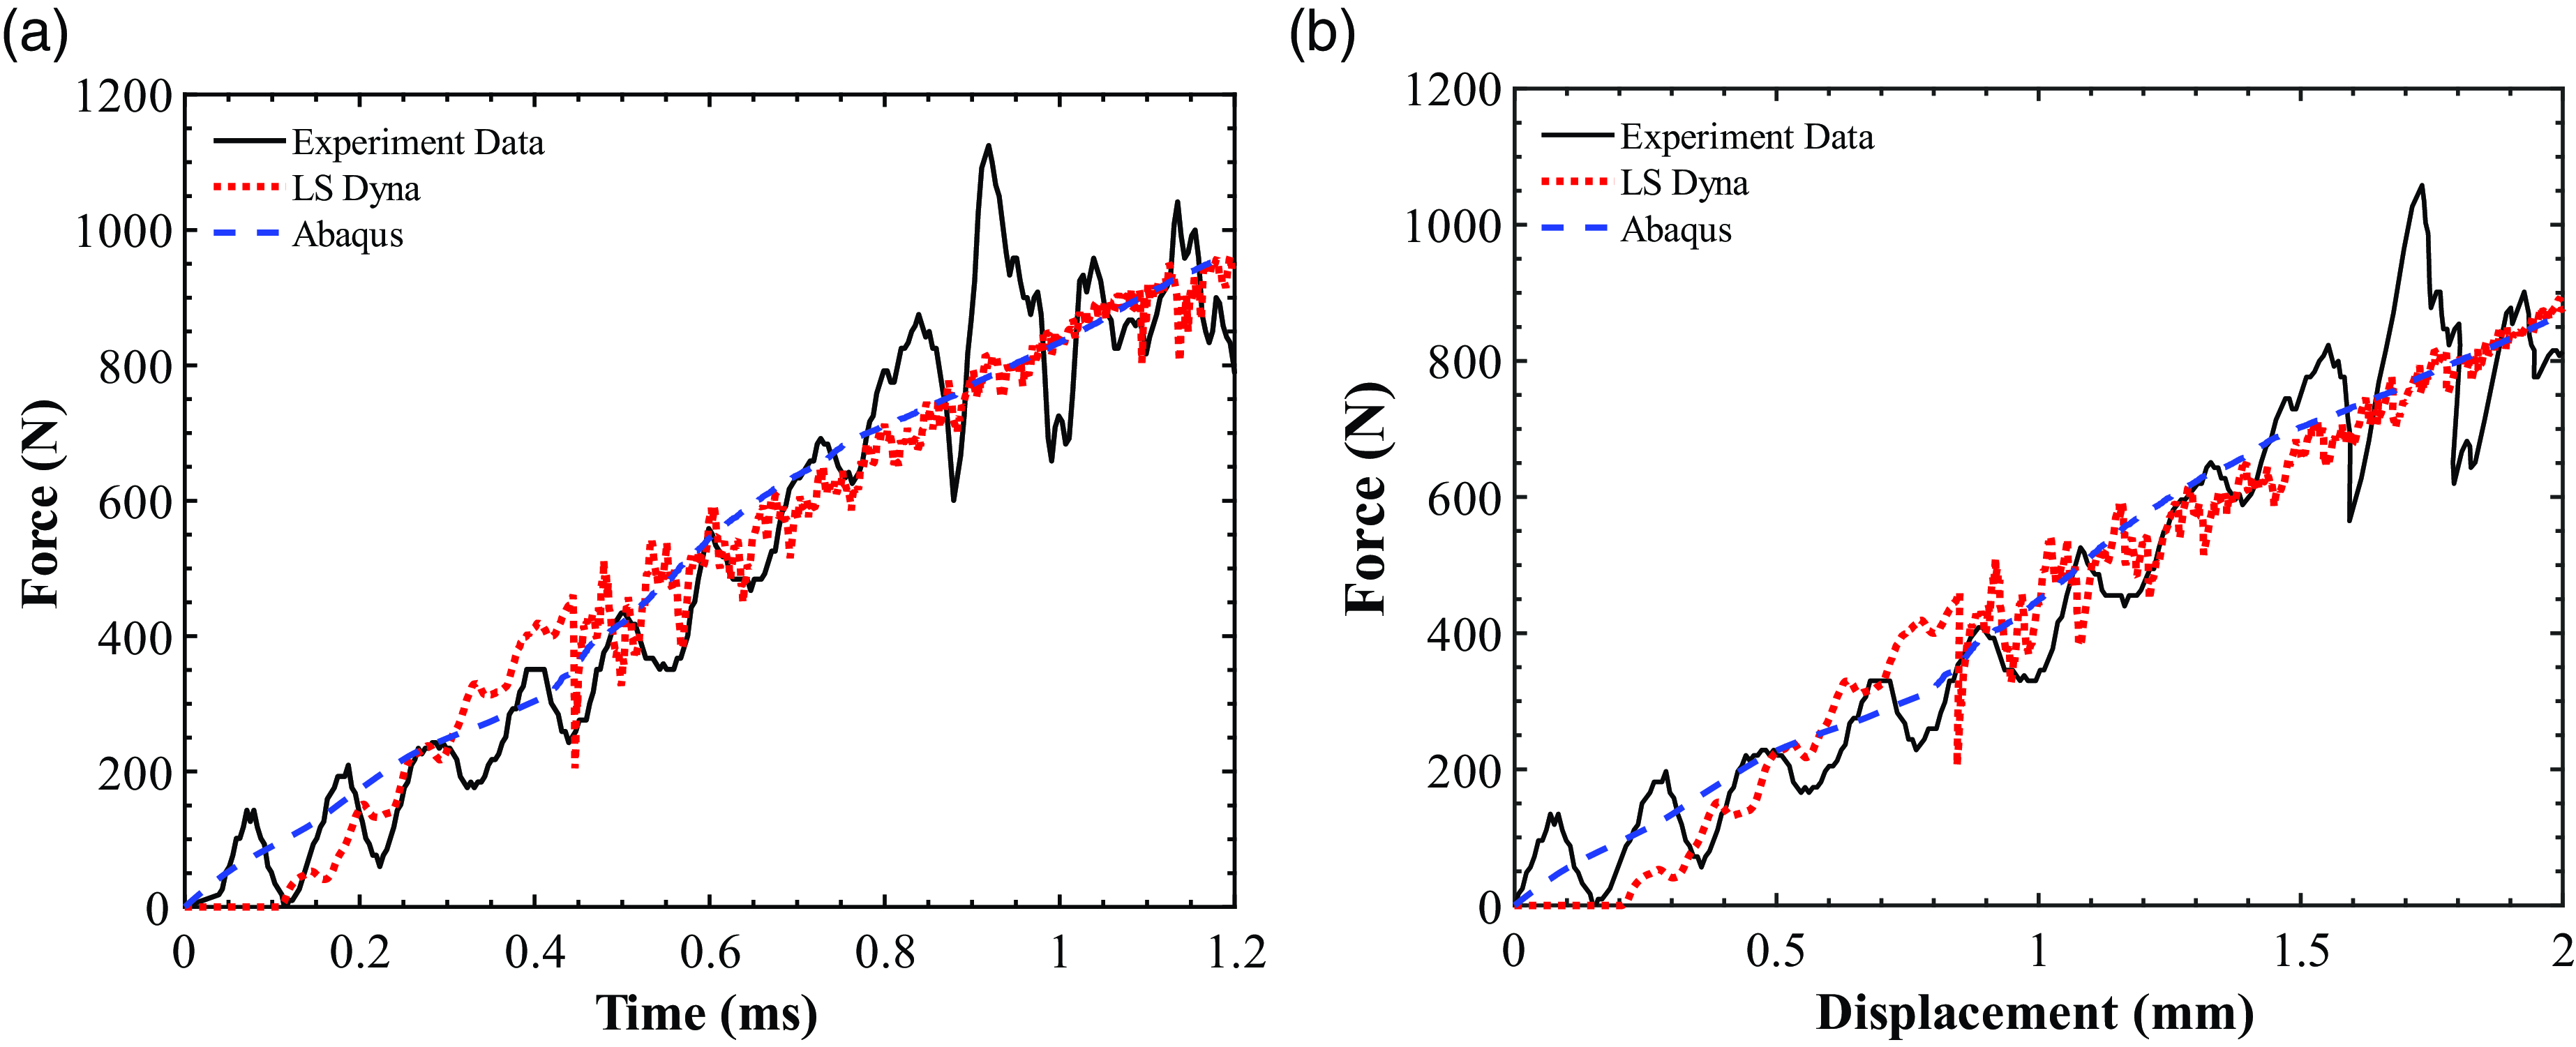
Figure 13. (a) Force-time history and (b) force-displacement comparison up to the onset of damage.
Figure 14 shows the energy-time history for the impacted sample and compares with the results from the two FE models up to the onset of damage. The absorbed energy from the impact by the specimen compares well between the two FE models and the experiment data up to the onset of damage. Energy absorbed by the impact specimen is seen to increase over time as the impact progresses, a typical phenomenon observed in impact tests [Reference Cesari, Dal re, Minak and Zucchelli8, Reference Ramakrishnan, Corn, Le moigne, Ienny and Slangen12, Reference Xie, Fang, Li, Wan, Wu and Yu14, Reference González, Maimí, Camanho, Turon and Mayugo17, Reference Davies and Zhang18].
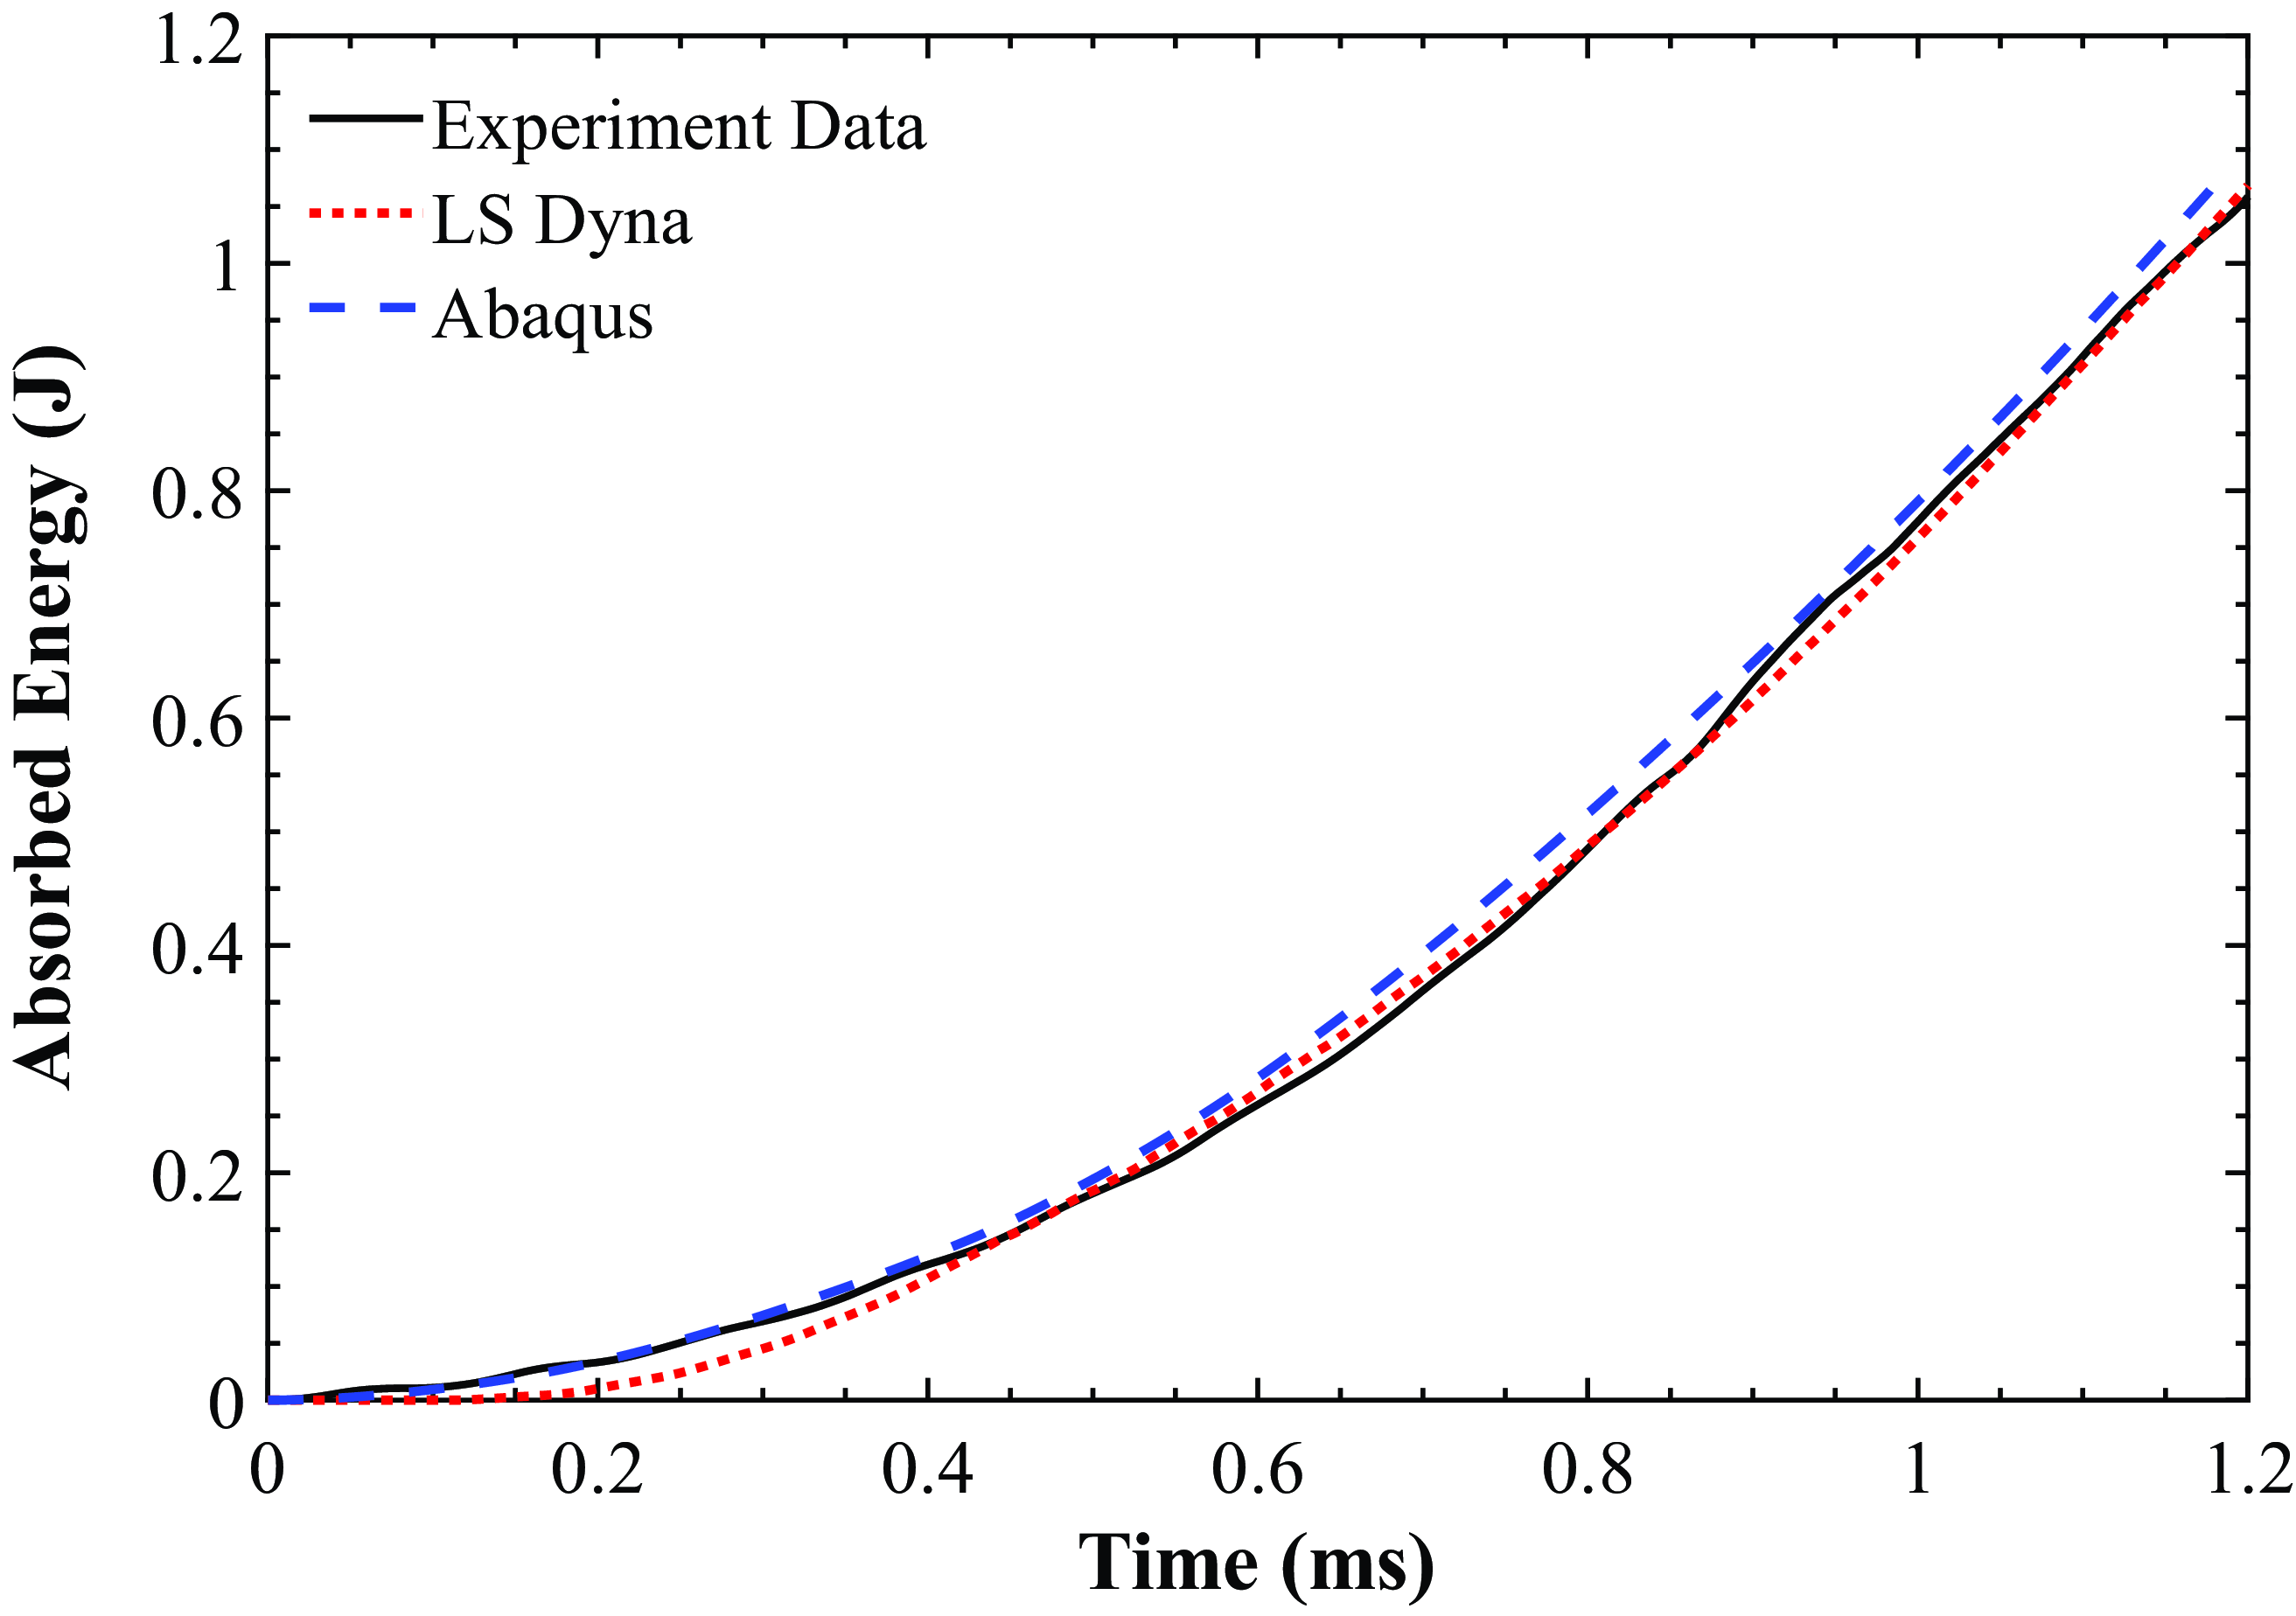
Figure 14. Energy-time history comparison for impacted specimen up to the onset of damage.
Figure 15 compares the impactor moment and velocity results for the FE models with the experiment data up to the onset of damage. Results show a good agreement between the experiment data and the results of the two constitutive FE models. The momentum and velocity of the impactor decreases as the impact progresses. This is expected due to the impactor being in contact with the composite specimen resulting in the generation of reaction forces on the impactor. These forces act in the opposite direction to the impact, and consequently reduce the downward momentum and velocity of the impactor.
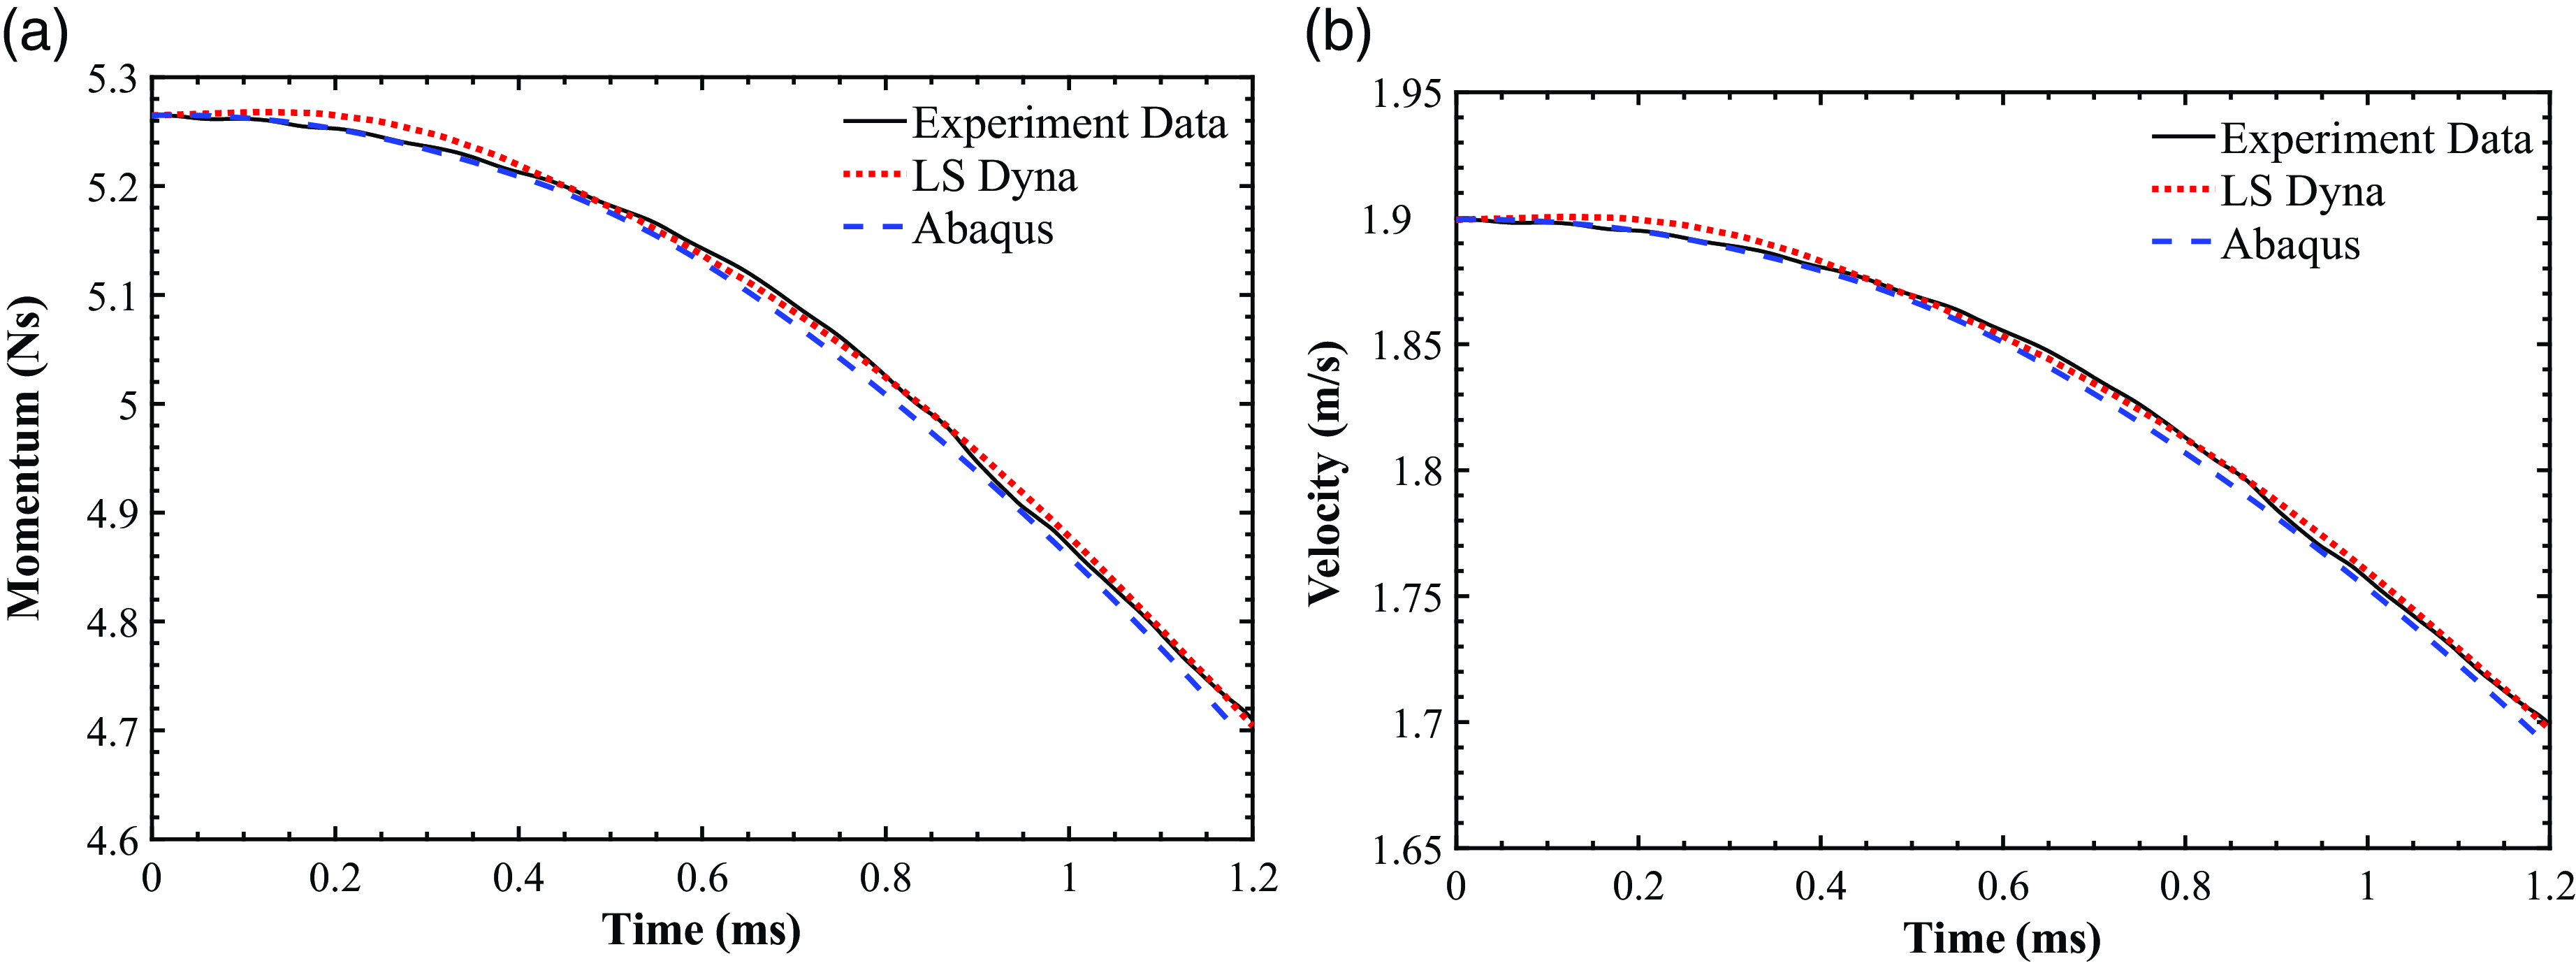
Figure 15. Comparison of (a) momentum and (b) velocity of impactor up to the onset of damage.
4.2.1 Delamination detection
Ultrasonic detection pointed out at a major change in the pulse echo after reaching the boundary condition (the metal clamp) during testing. The location of the change in the observed pulse echo, indicative of the delaminated region, was marked. A circular delamination pattern was identified based on the recorded data. The radius of the delaminated region was measured with the accuracy of ±5mm, as 12.3 ±5mm. Figure 16 shows the specimen with the location of the pulse echo inflection point highlighted.
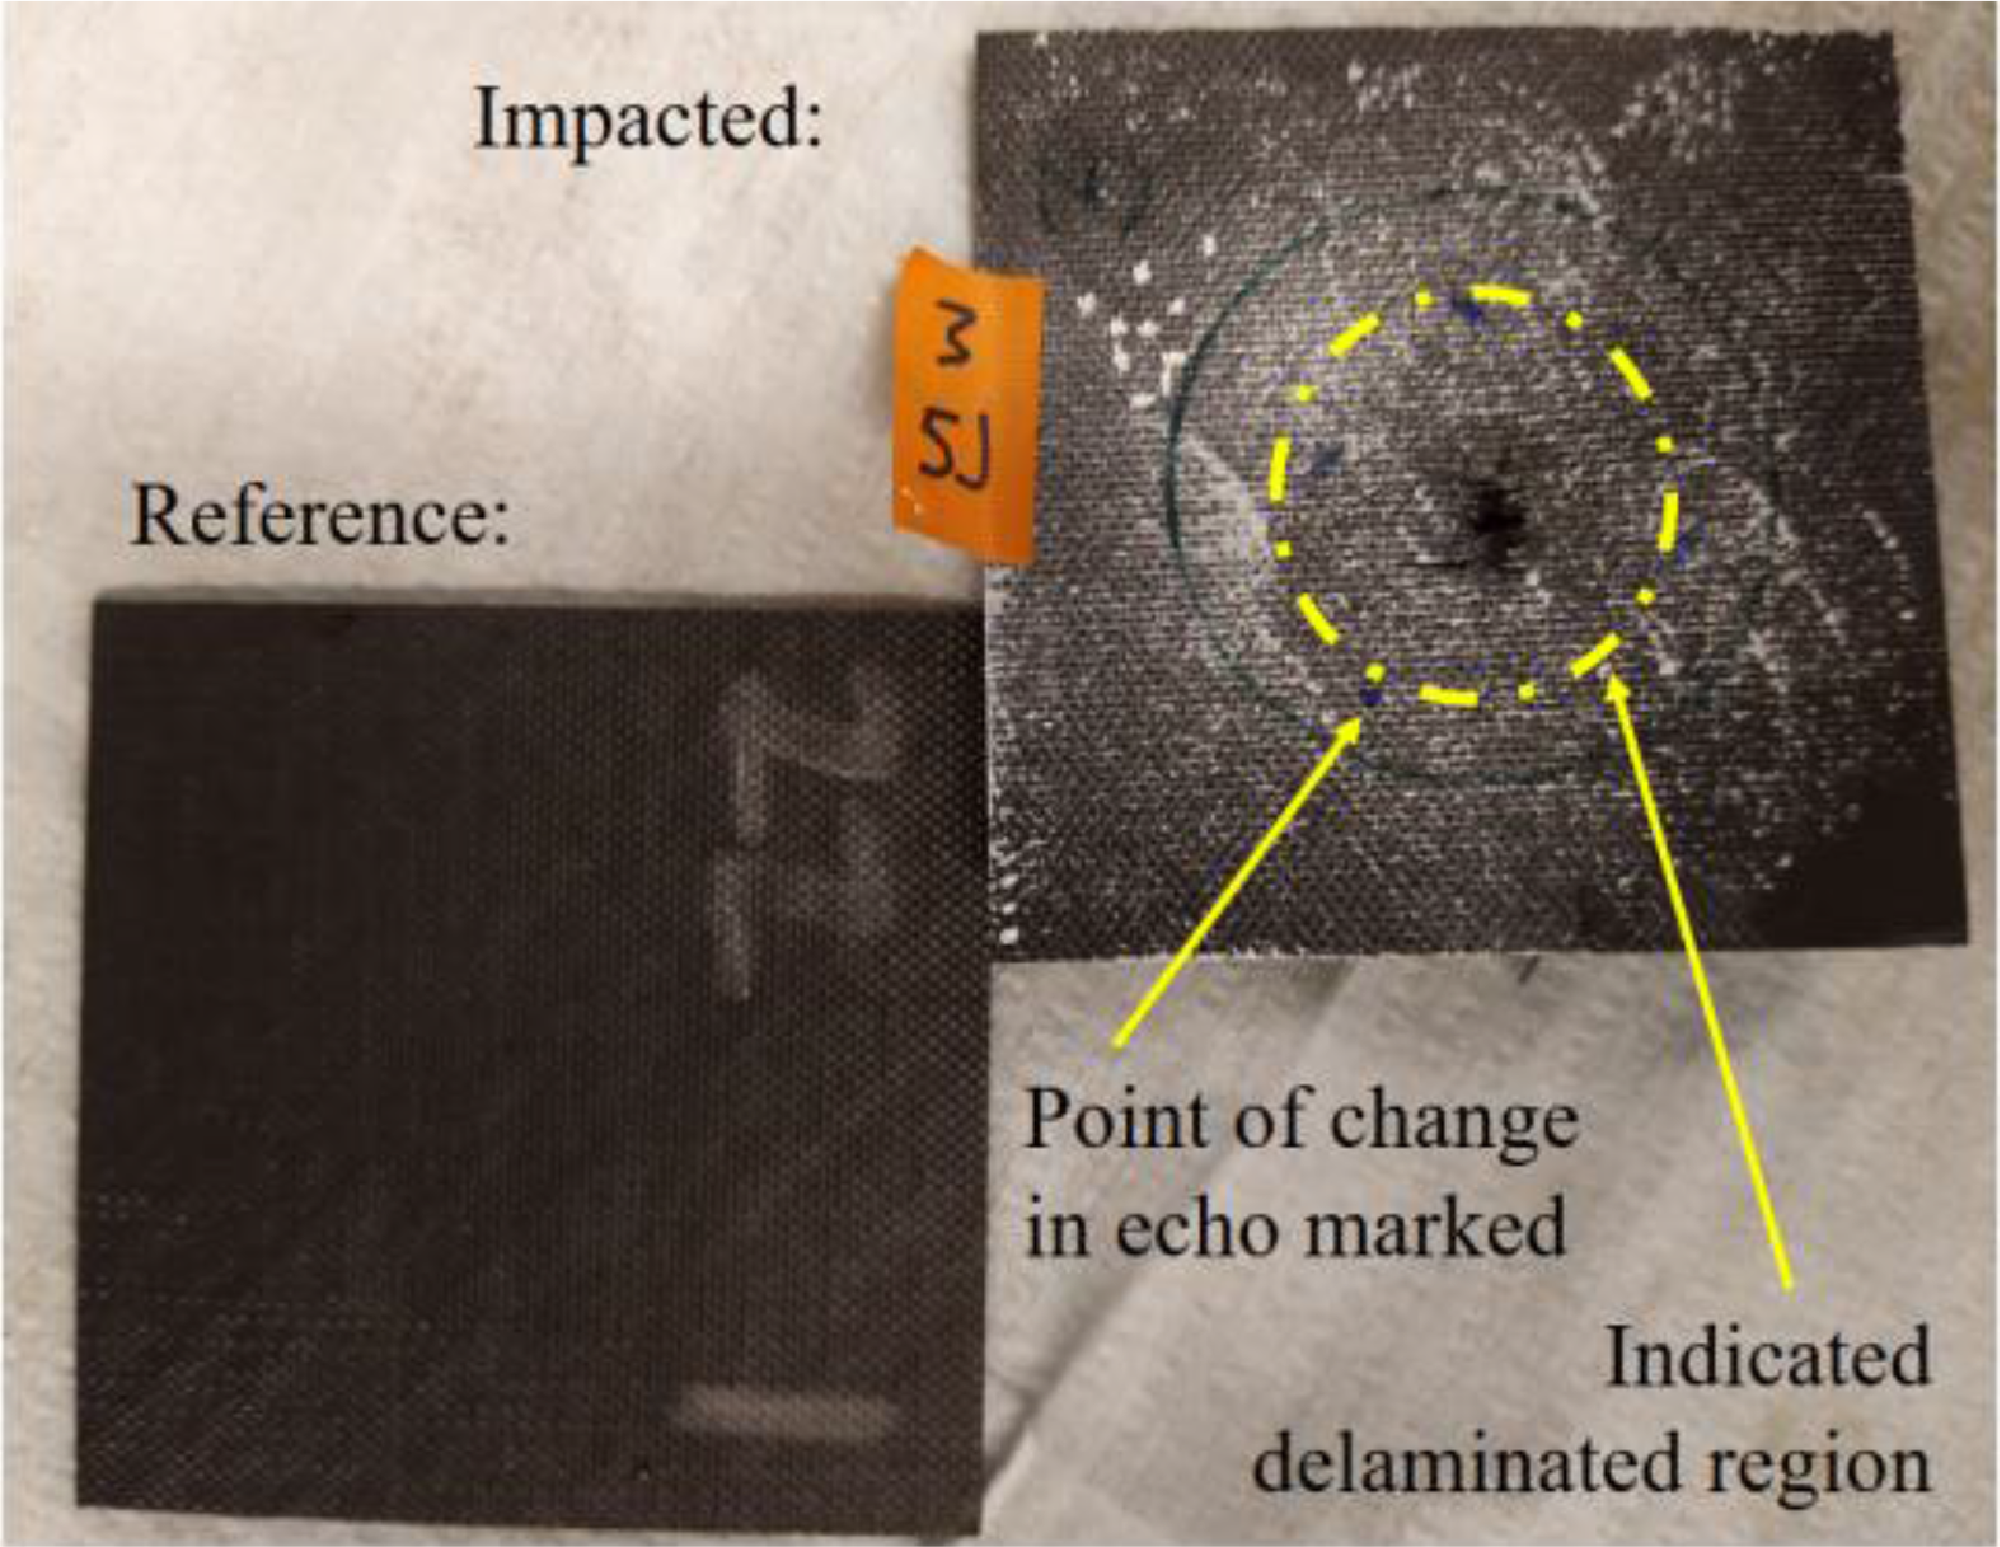
Figure 16. Inflection point of observed pulse echo identifying delaminated region using 5MHz probe.
4.2.2 Abaqus/Explicit impact model
For the dynamic impact test analysis in Abaqus/Explicit, the initiation of delamination is modelled at the seventh ply interface, where a pre-crack is defined. Figure 17 shows the von Mises stresses through the thickness when delamination starts to evolve. Figure 18 shows the von Mises stress field across the surface of the seventh ply as well as the VCCT results at the seventh ply interface. Results indicate peak stresses near the centre region as expected, where the impactor comes into contact with the plies. The von Mises stresses are presented since they offer a reasonable overall behaviour of the impacted specimen. However, the in-plane stresses (x, y, and z-directions) from the impact simulations are also shown in Fig. 19. The failure initiation occurs in the fibre-matrix planes, so that the in-plane stresses in x- and y-directions are more critical. Results show that the x-plane stresses are the largest.

Figure 17. von Mises stress through thickness when delamination starts to evolve at seventh ply interface.

Figure 18. von Mises stress and VCCT results when delamination starts to evolve at seventh ply interface.
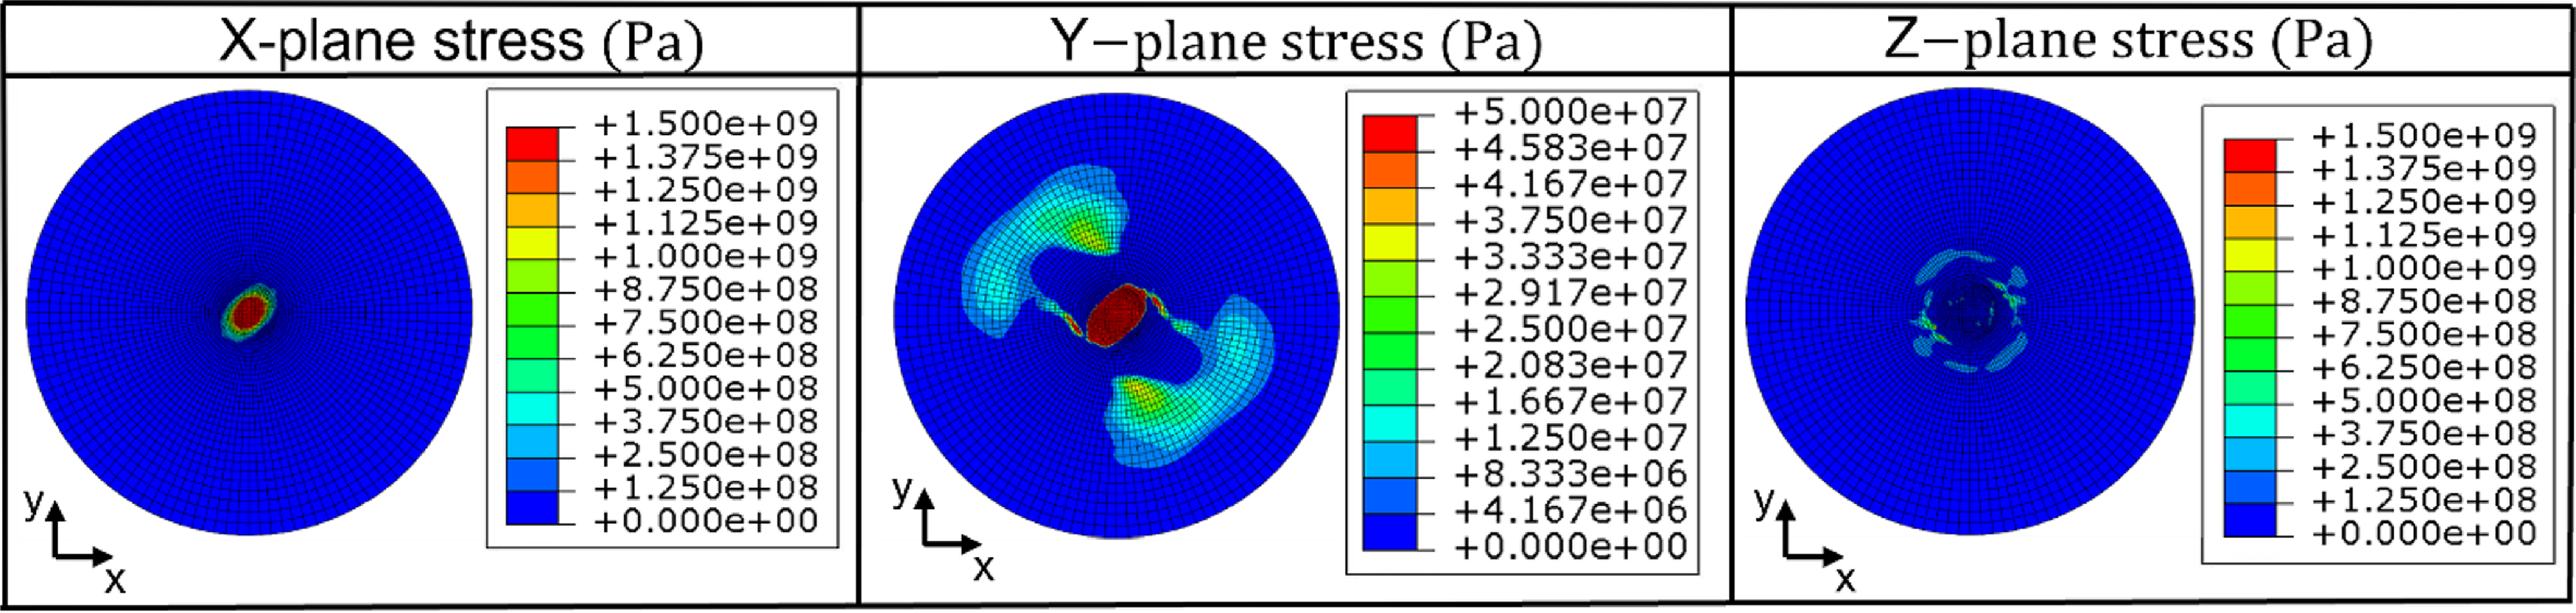
Figure 19. In-plane stresses from VCCT simulation when delamination starts to evolve at seventh ply interface.
Figure 20 shows the activation functions (IFF mode) of the three failure criteria through the thickness and with the pre-crack at the seventh ply interface. The tensile (membrane) response acts at the lower part and compression at the upper part of the laminate due to bending. Figure 21 highlights the failure status (inter- and intra-laminar) of the lower part of the seventh ply. Results are depicted when delamination starts to evolve and include the IFF mode values at the ply. For better comparison, results are normalised to a fixed range from 0 to 1, where 0 denotes “intact” elements and 1 indicates elements that have reached “failure”.
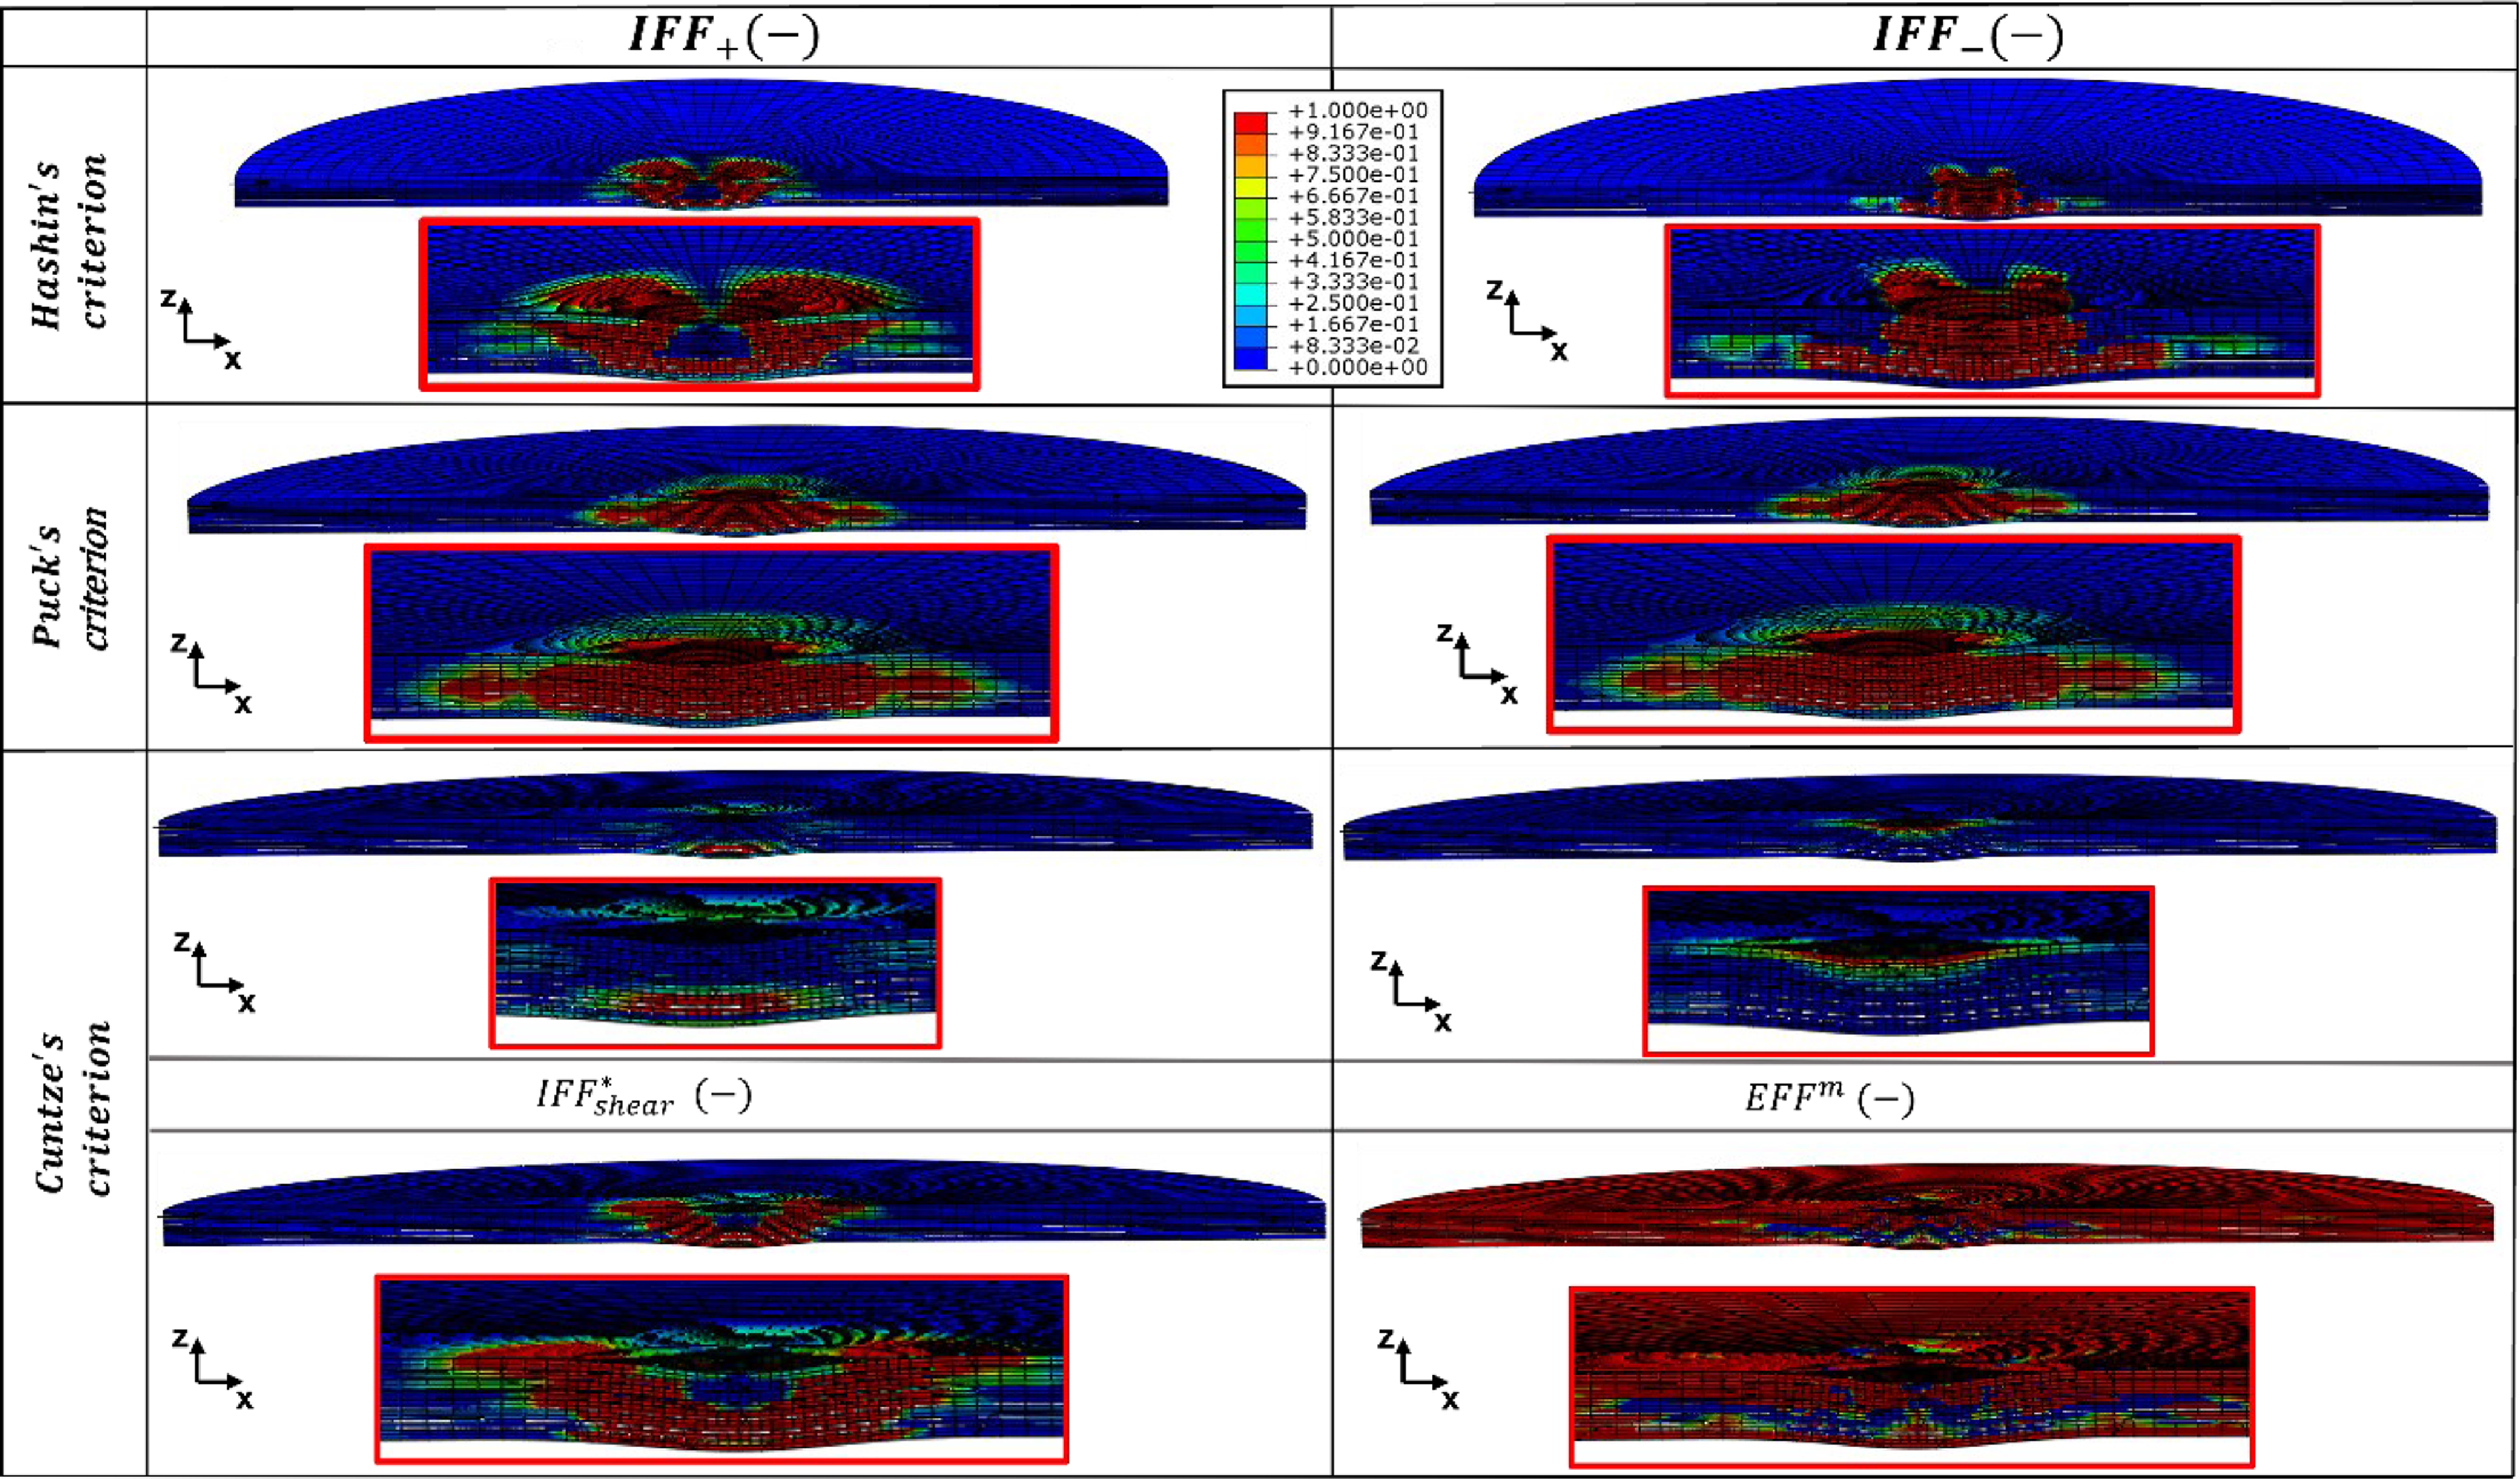
Figure 20. Stress and activation functions status through cross-section of laminate.
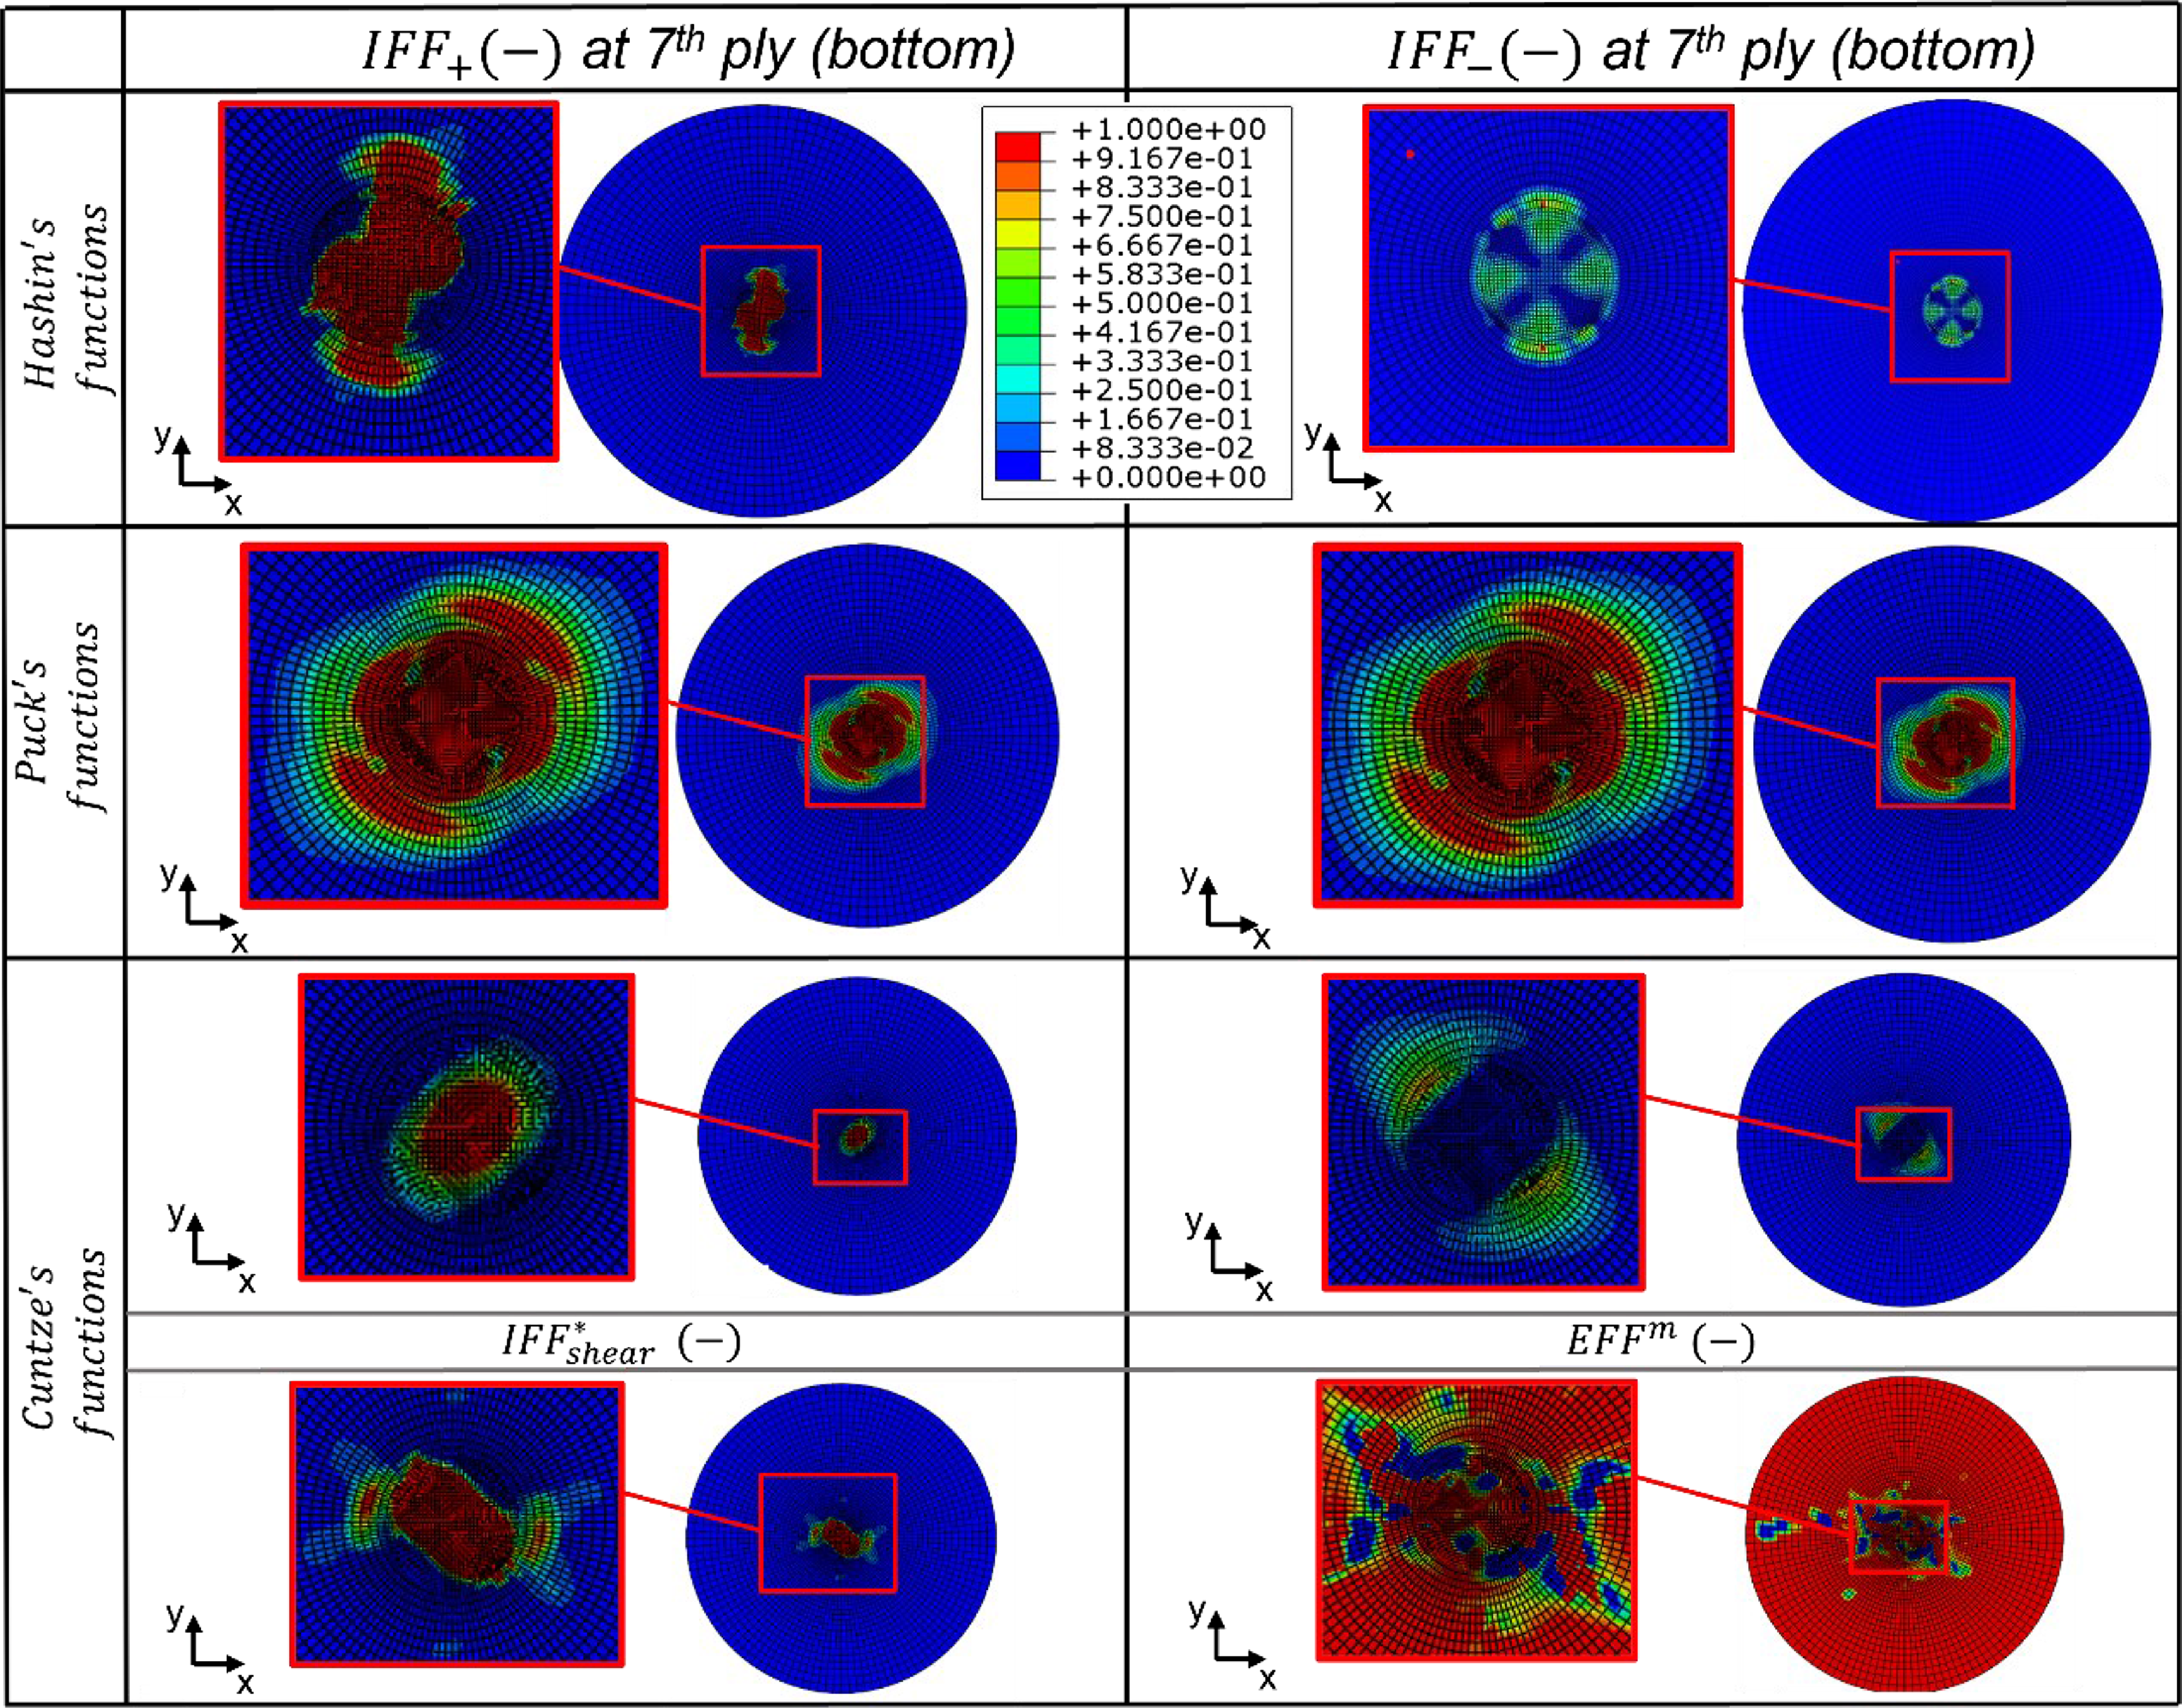
Figure 21. Comparison of failure prediction when delamination starts to evolve at seventh ply interface.
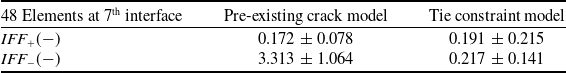
In terms of the stress and failure values, the simulated prediction is highlighted by the 48 elements (refer to Fig. 18) which are used for reporting the performances, as provided in Table 4 through Table 8. The simulation is also conducted without the pre-crack (no VCCT) at the interface between seventh and eighth plies using the tie constraint model, results of which are included in the same tables for comparison. The Hashin criterion, shown in Table 5, presents the highest value for the compressive mode, making it the most conservative with respect to the two other criteria. This is due to the definition of the fracture plane at a ‘pre-fixed’ angle (0
 $^{\circ}$
wrt. thickness direction), on which transverse stresses act. The simulation without pre-crack shows a slight increase in the probability of tensile failure, as well as an abrupt decrease in the compressive failure due to the stress field reduction (-66.1%).
$^{\circ}$
wrt. thickness direction), on which transverse stresses act. The simulation without pre-crack shows a slight increase in the probability of tensile failure, as well as an abrupt decrease in the compressive failure due to the stress field reduction (-66.1%).
Table 4. Averaged values of von Mises stresses of highlighted elements at seventh ply interface

Table 5. Hashin criterion, averaged values of IFF mode of marked elements
In the marked elements (refer to Fig. 18), Puck criterion on average results in the formation of a fracture plane at 55.52
 $^{\circ}$
(wrt. thickness direction). The results with a pre-existing crack for the compressive mode are found to be lower than Hashin criterion with pre-crack, whereas the results with pre-crack for the tensile mode are found to be higher than Hashin criterion with one (see Table 6). However, without the pre-crack, the IFF values are found to be higher. This solution represents a clear difference in comparison to Hashin criterion.
$^{\circ}$
(wrt. thickness direction). The results with a pre-existing crack for the compressive mode are found to be lower than Hashin criterion with pre-crack, whereas the results with pre-crack for the tensile mode are found to be higher than Hashin criterion with one (see Table 6). However, without the pre-crack, the IFF values are found to be higher. This solution represents a clear difference in comparison to Hashin criterion.
Table 6. Puck criterion, averaged values of IFF mode of marked elements with calculated fracture angle
 $\theta_{frac} = 55.622^{\circ}$

The global response (EFF) of Cuntze criterion offers a higher predicted failure value for the case without a pre-crack (see Table 7). The local response of this criterion, unlike Puck, is defined with ‘fixed’ fracture angles based on the experimental results [Reference Cuntze and Freund41]. The IFF1 value is generated by a fracture plane parallel to the fibres (0
 $^{\circ}$
wrt. thickness direction) and it reports a slightly higher value in the simulation without a pre-crack. The IFF3 mode is defined by a fracture plane of 53
$^{\circ}$
wrt. thickness direction) and it reports a slightly higher value in the simulation without a pre-crack. The IFF3 mode is defined by a fracture plane of 53
 $^{\circ}$
[Reference Puck and Schürmann40], which results in a higher value than in the case with a pre-crack. The IFF2 (shear) mode is also represented by a fracture plane parallel to the fibres (0
$^{\circ}$
[Reference Puck and Schürmann40], which results in a higher value than in the case with a pre-crack. The IFF2 (shear) mode is also represented by a fracture plane parallel to the fibres (0
 $^{\circ}$
wrt. thickness direction), resulting in the highest simulation values with a pre-crack (i.e., higher stress field). However, the failure value reduces drastically for the simulation without a pre-crack (i.e., lower stress field). Therefore, a similar response to that of the Puck is obtained: that is an increase in the IFF failure prediction without a pre-crack.
$^{\circ}$
wrt. thickness direction), resulting in the highest simulation values with a pre-crack (i.e., higher stress field). However, the failure value reduces drastically for the simulation without a pre-crack (i.e., lower stress field). Therefore, a similar response to that of the Puck is obtained: that is an increase in the IFF failure prediction without a pre-crack.
Table 7. Cuntze criterion, averaged values of IFF mode of marked elements

The difference between the results of Hashin criterion versus Puck and Cuntze criteria, for the IFF mode, is essentially due to the definition of the fracture angle. Hashin criterion causes a higher IFF value in the simulation with the pre-crack (i.e., higher stress field). However, when the stress field reduces, as in the simulation without a pre-crack, the IFF value decreases. This behaviour does not occur in the other two criteria. However, the two criteria result in an increase in the IFF mode as a consequence of the rise in the failure throughout the UD-plies, rather than the interface, where no delamination takes place (no pre-crack).
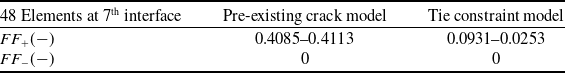
As seen in Table 8, for the common responses, including the fibre failure modes (tension/compression) measured by the three criteria, higher values are obtained at the element level when a pre-crack exists. This is due to the partial lack of load-carrying capacity in the plies in the presence of a pre-existing crack. For simulations without a pre-crack, FF modes resulted in values nearing zero. This does not occur for the global response (EFF) of Cuntze criterion, as indicated before (refer to Table 7). For the case of Hashin, the FF tensile mode, defined in Equation (9), results in the same values for pre-crack simulations as those without pre-crack.
Table 8. Averaged values of FF mode (Hashin, Puck, and Cuntze) in marked elements at seventh ply interface
4.2.3 LS-Dyna impact model
The Chang-Chang composite damage model is applied to the plies, and delamination is modelled between the seventh and eighth plies to determine the damage onset. Element deletion is not used to obtain an elastic response. A layer of cohesive elements is modelled between bottom plies with a thickness of 0.01 mm. Unlike VCCT, CZM does not require the existence of an initial crack in the structure and therefore is able to represent the complete interlaminar bonding layer. Figure 22 shows the delamination initiation (a) and the subsequent delamination as it propagates (b). Cohesive elements reaching failure due to the applied load over time are shown, representing the crack initiation and thereby highlighting delamination onset.
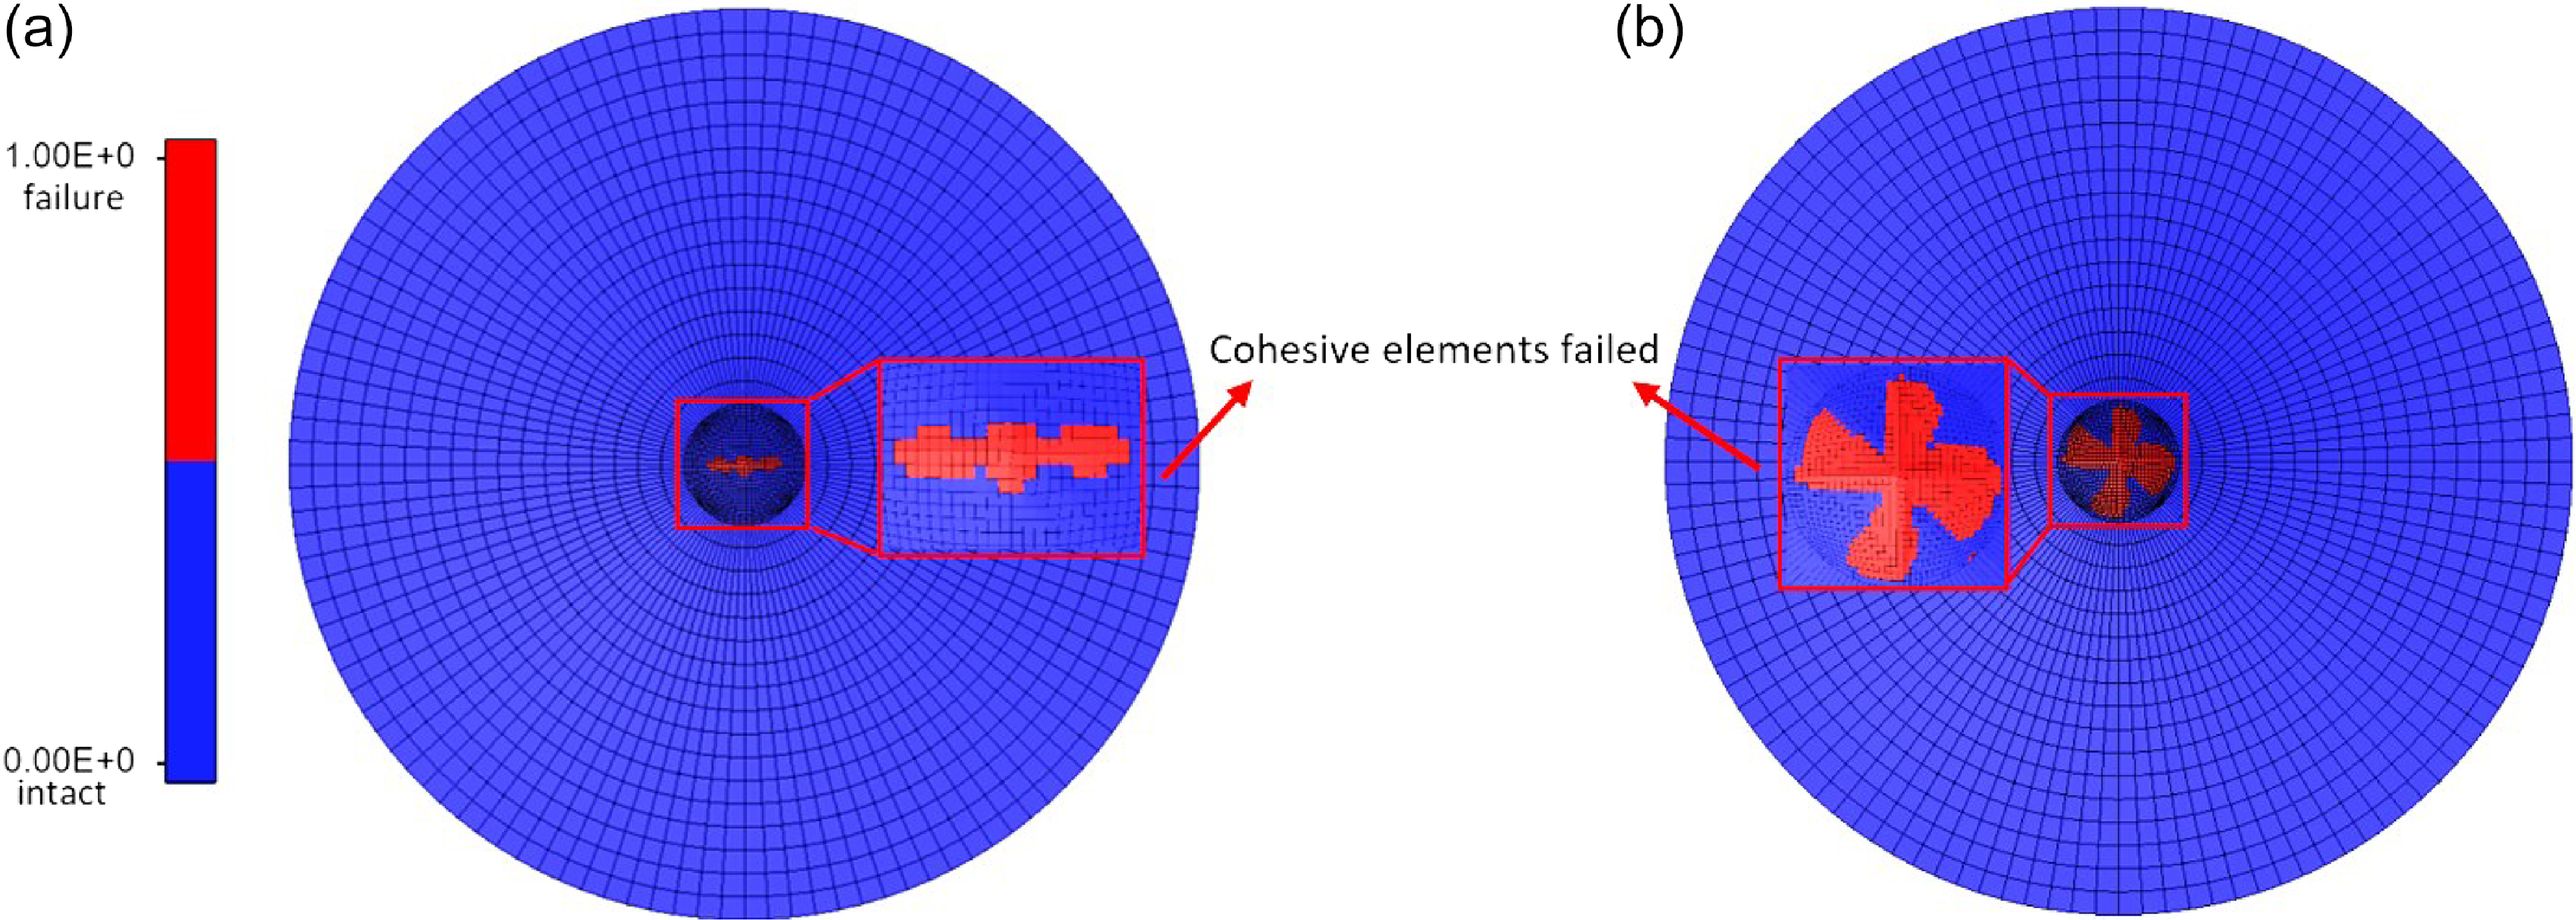
Figure 22. (a) Initial delamination at 0.446 ms (b) delamination propagation.
Figure 23 shows the von Mises stresses through the thickness of the laminate and provides a comparison between the CZM and tiebreak models. Figure 24 depicts the comparison of von Mises stresses on the surface of the seventh ply between the CZM and tiebreak constitutive model when delamination initiates. The von Mises stresses are presented since they offer a reasonable overall behaviour of the impacted specimen.
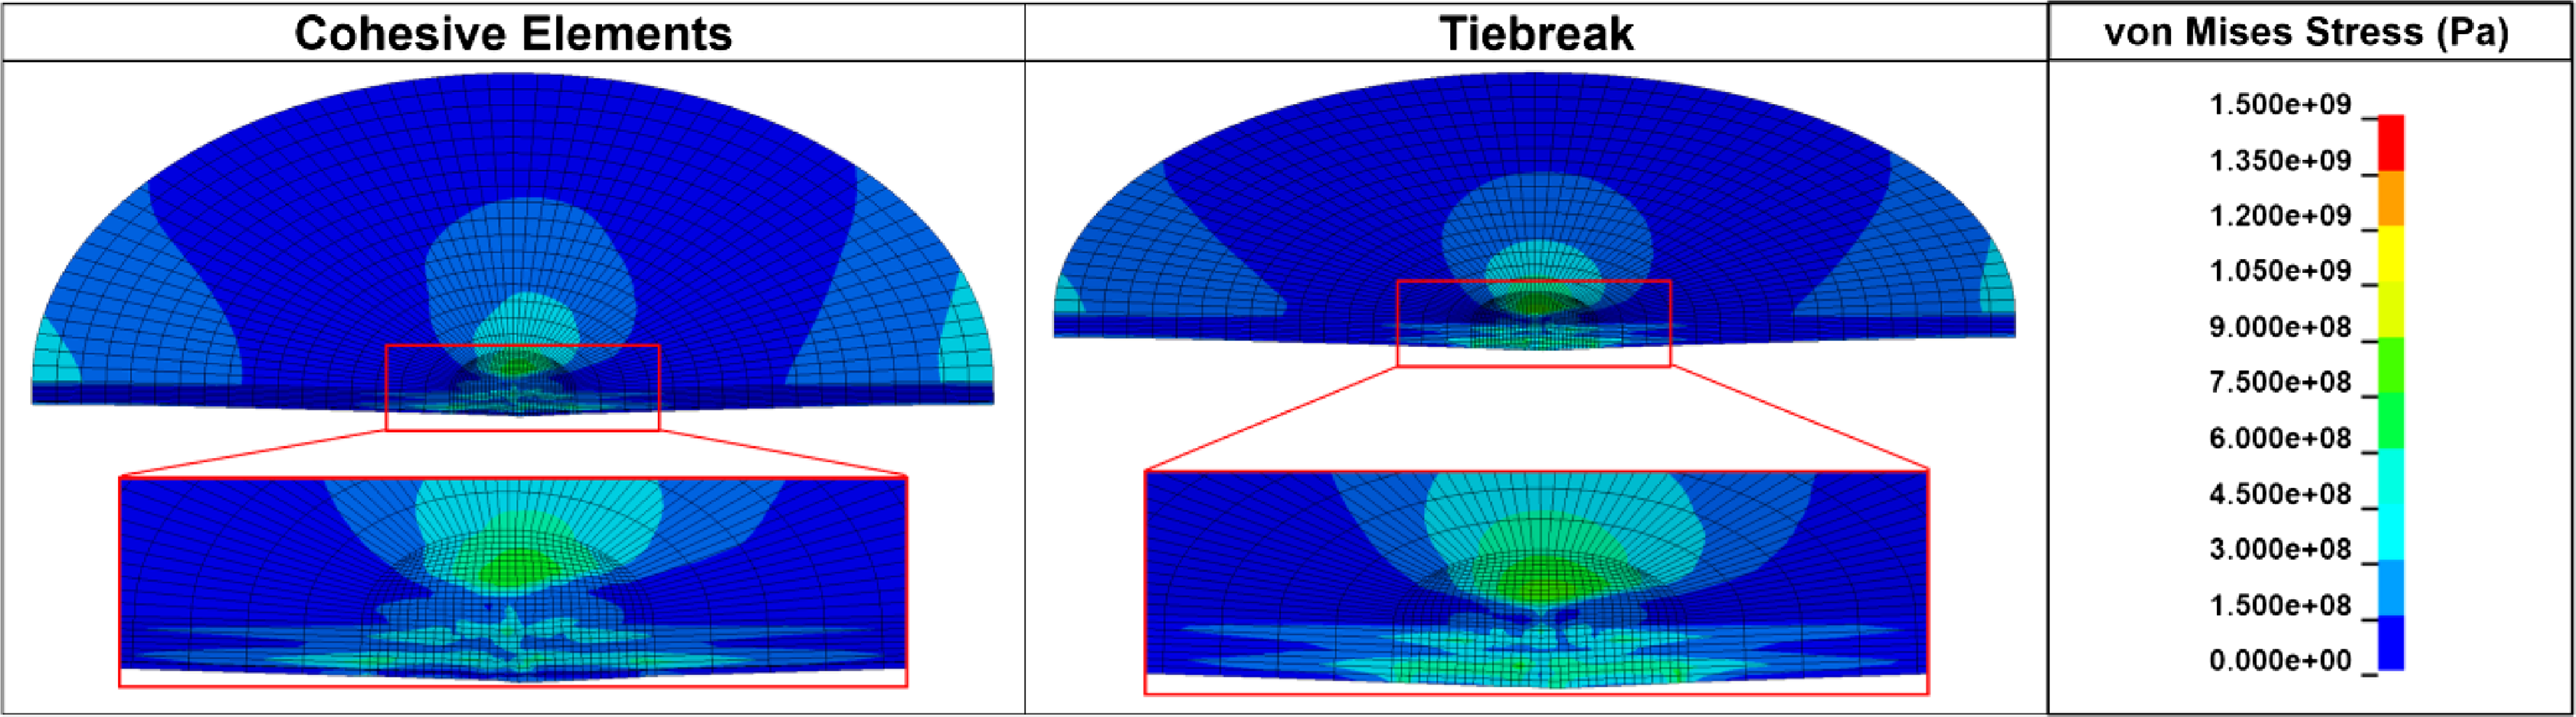
Figure 23. Comparison of von Mises stresses through thickness of modelled specimen between CZM (cohesive elements) and tiebreak model at the seventh ply at delamination onset.
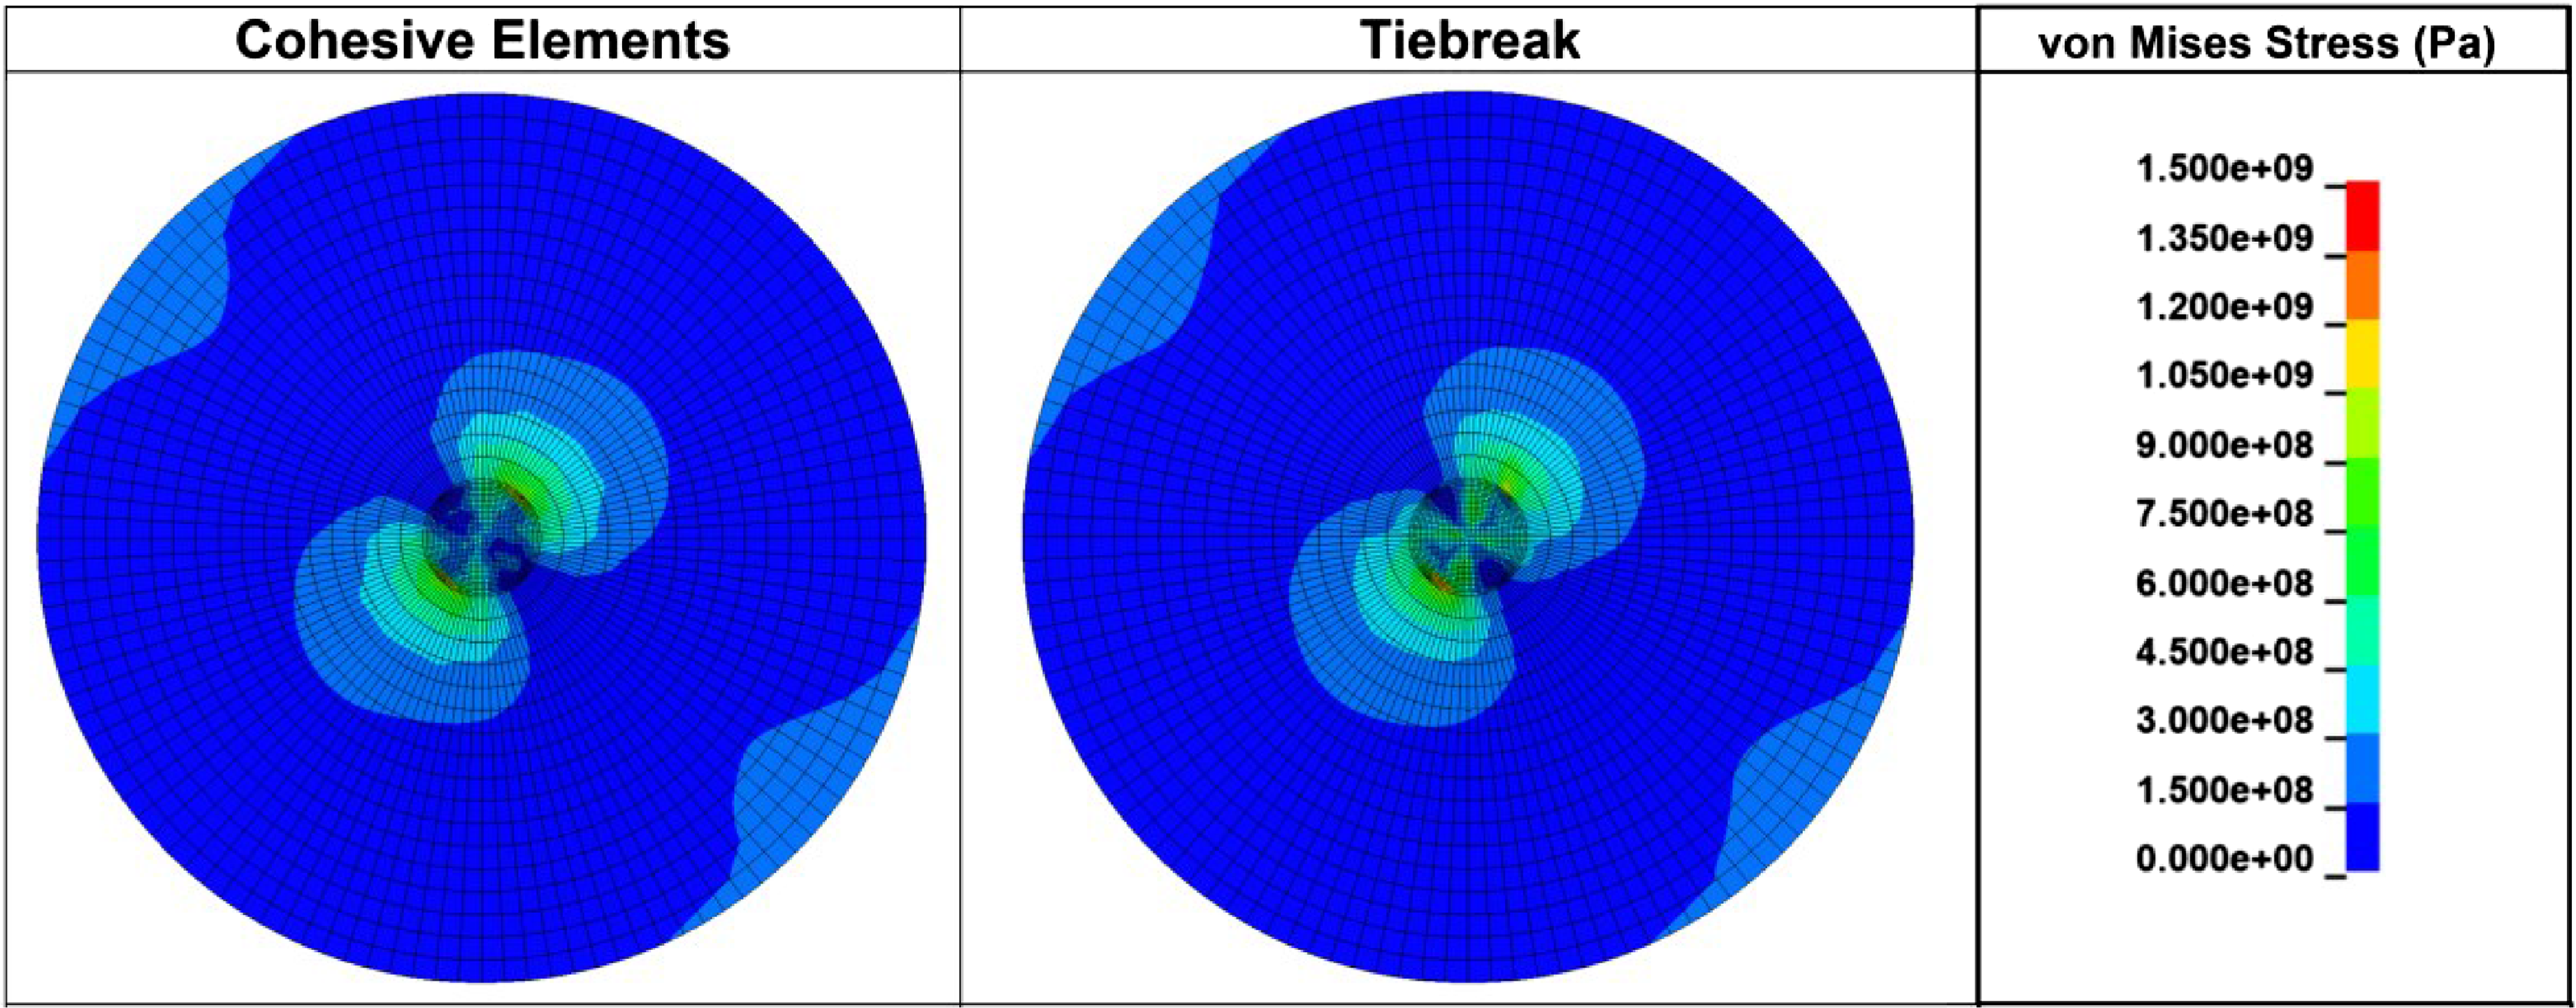
Figure 24. Comparison of the von Mises stresses between CZM (cohesive elements) and tiebreak model at seventh ply at delamination onset.
The stresses have about the same magnitude and their distribution is almost identical. The cohesive zone model predicts slightly higher stresses in the laminate near the centre region as compared to the tiebreak model, however, the difference is minimal. The maximum stresses are found to be at similar locations at which they reach a value of about 1.27 GPa. Near the centre region of the impact, the stresses in both models are found to be in the range of 350–650 MPa. The in-plane stresses (x, y, and z-directions) from the simulated impacts are also provided in Fig. 25. Given that the focus of the study was to investigate the damage in the matrix and fibre action planes, the in-plane stresses in x- and y-direction are more critical. Results show that the x-plane stresses are the largest, similar to the Abaqus/Explicit predictions (refer to Fig. 19).
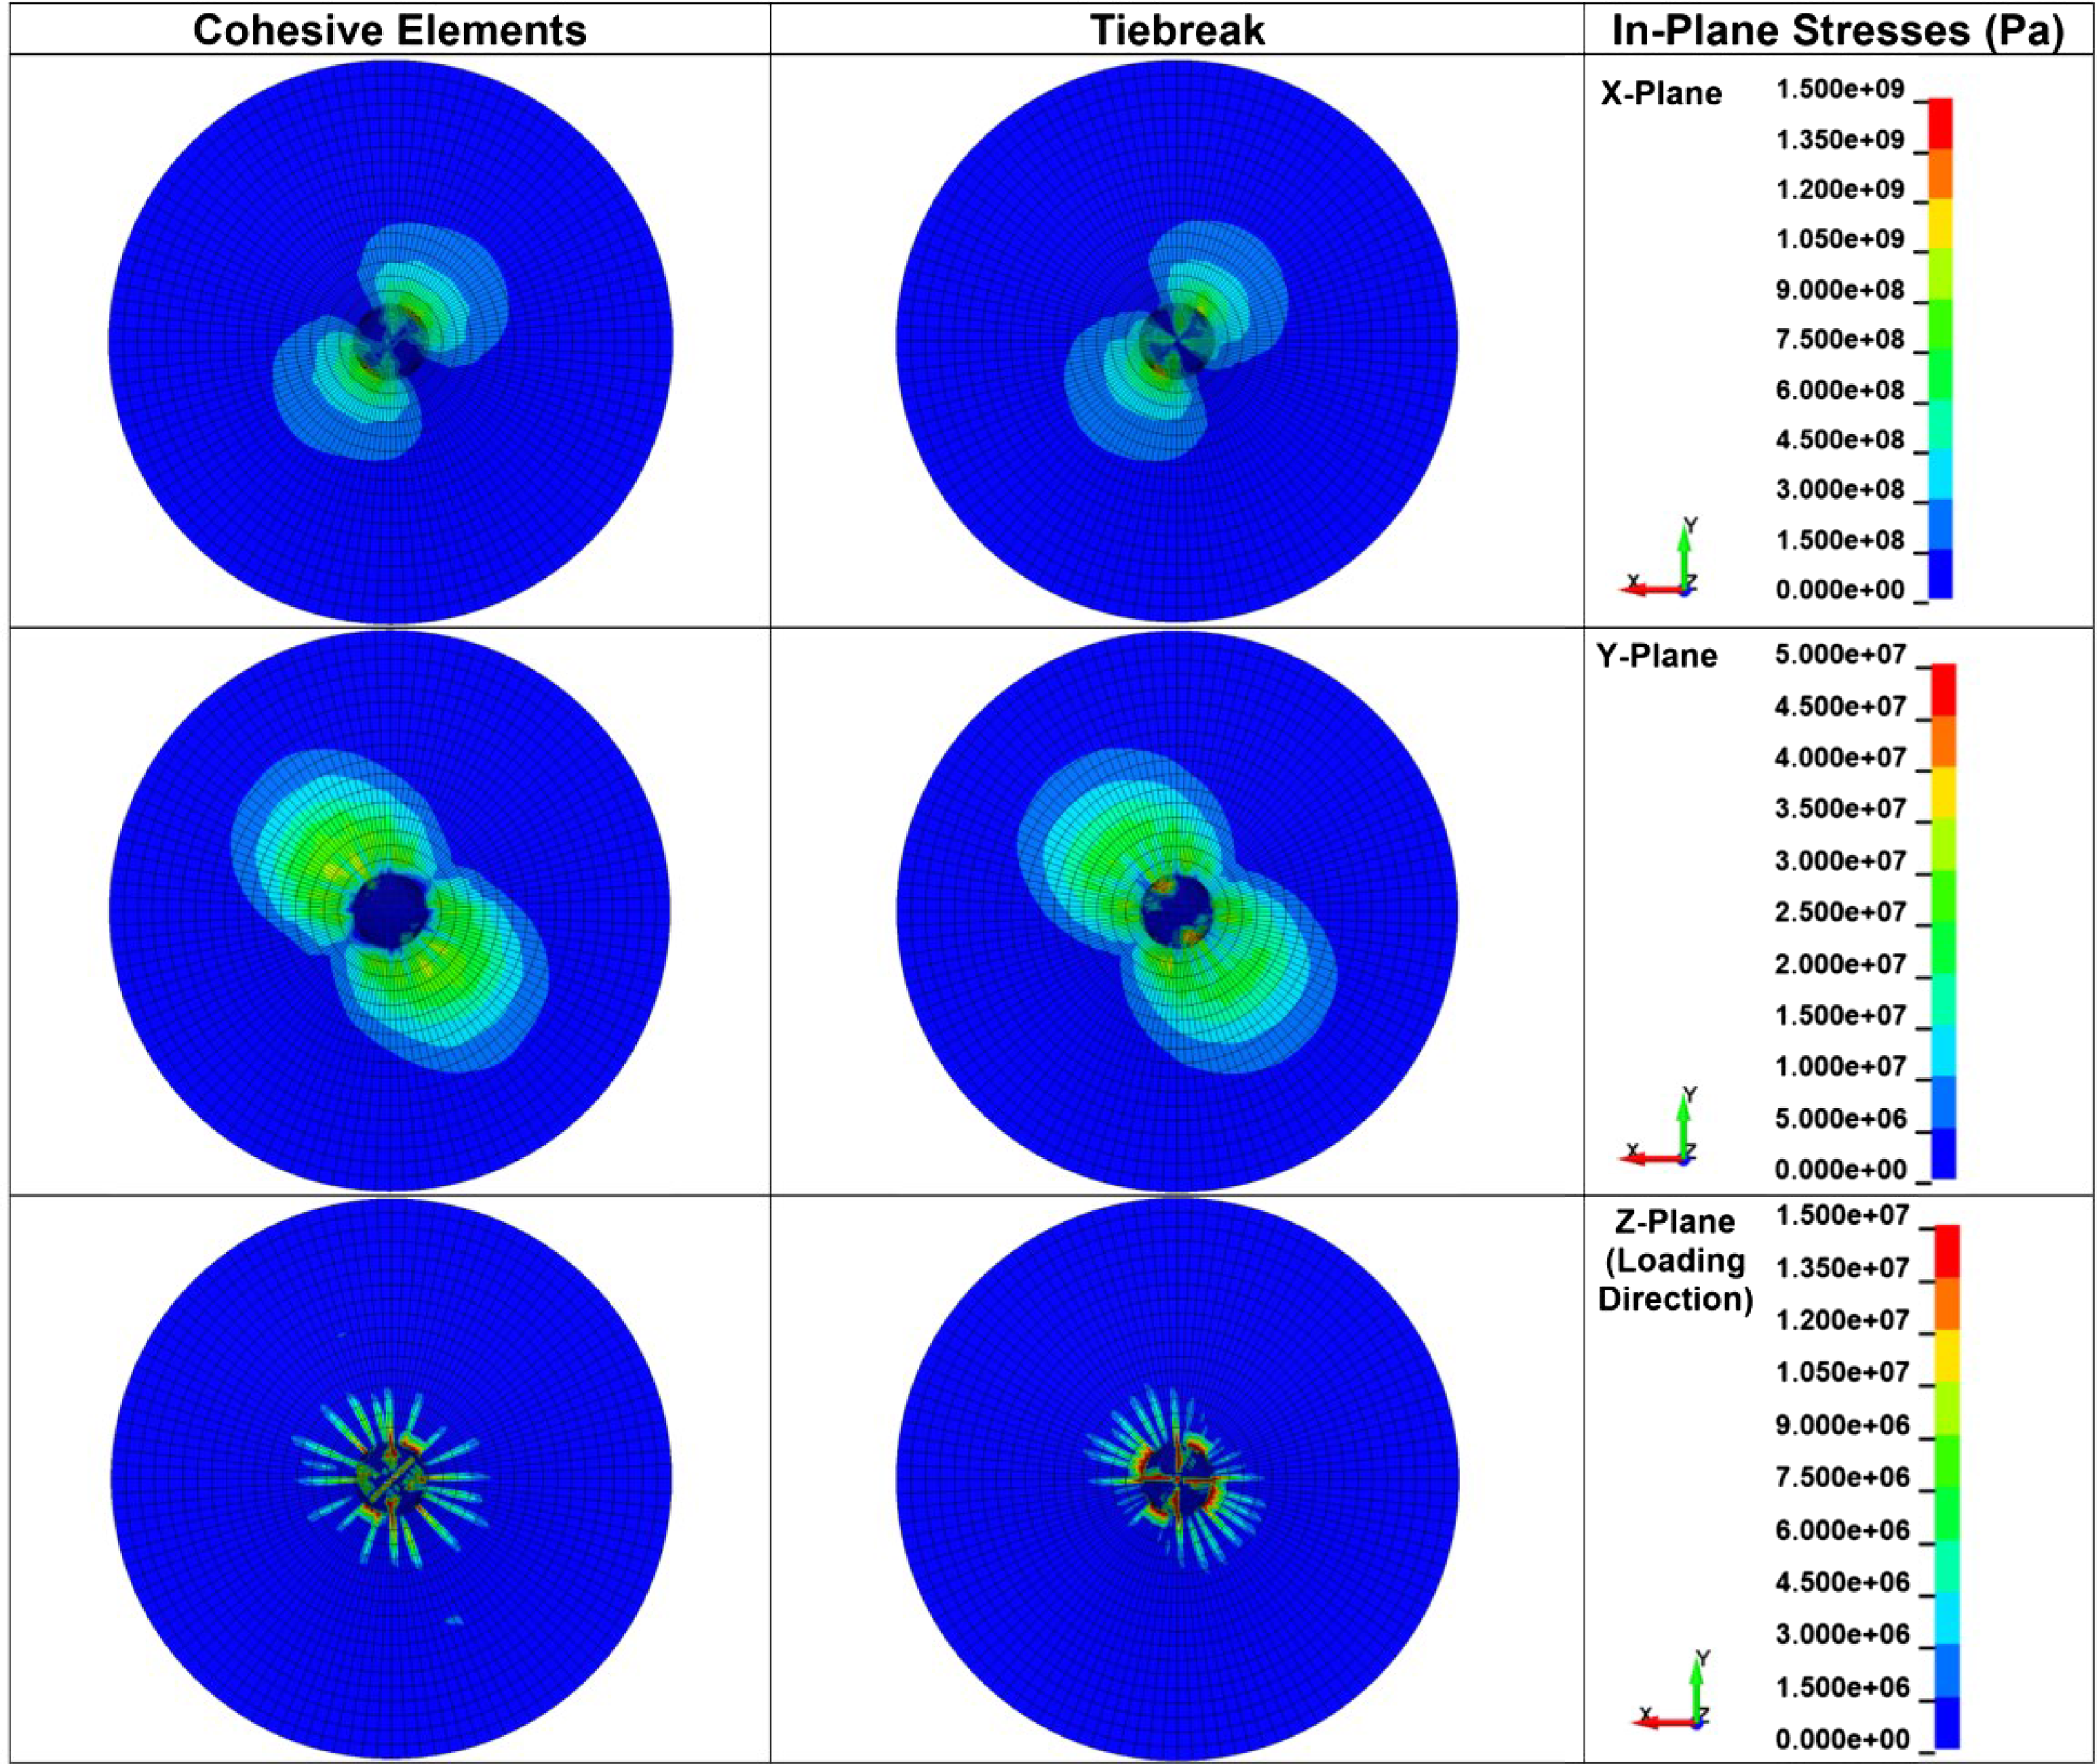
Figure 25. Comparison of in-plane stresses between CZM (cohesive elements) and tiebreak model at seventh ply at delamination onset.
Figure 26 depicts the fibre and matrix damage when delamination initiates on the bottom side of the seventh ply for the model with cohesive elements. Damage initiation takes place at the centre region where the impactor strikes the laminate as expected. Fibre is shown to be damaged in tension in the + 45
 $^{\circ}$
direction along the fibre orientation. The damage further develops near the centre of the fibre in compression. The seventh ply fibres do not seem to fail from a 5J impact since no element reaches the failure value of 1. The matrix on the other hand is seen to be both damaged as well as failed in tension near the centre region of the specimen where the impact primarily takes place. This is expected since in general matrix is more prone to damage and failure than fibre when the ply is deflected downwards due to the applied impact load. In this case, the matrix did undergo damage and failed in compression. The regions where the matrix failed was close to where the delamination was initiated.
$^{\circ}$
direction along the fibre orientation. The damage further develops near the centre of the fibre in compression. The seventh ply fibres do not seem to fail from a 5J impact since no element reaches the failure value of 1. The matrix on the other hand is seen to be both damaged as well as failed in tension near the centre region of the specimen where the impact primarily takes place. This is expected since in general matrix is more prone to damage and failure than fibre when the ply is deflected downwards due to the applied impact load. In this case, the matrix did undergo damage and failed in compression. The regions where the matrix failed was close to where the delamination was initiated.
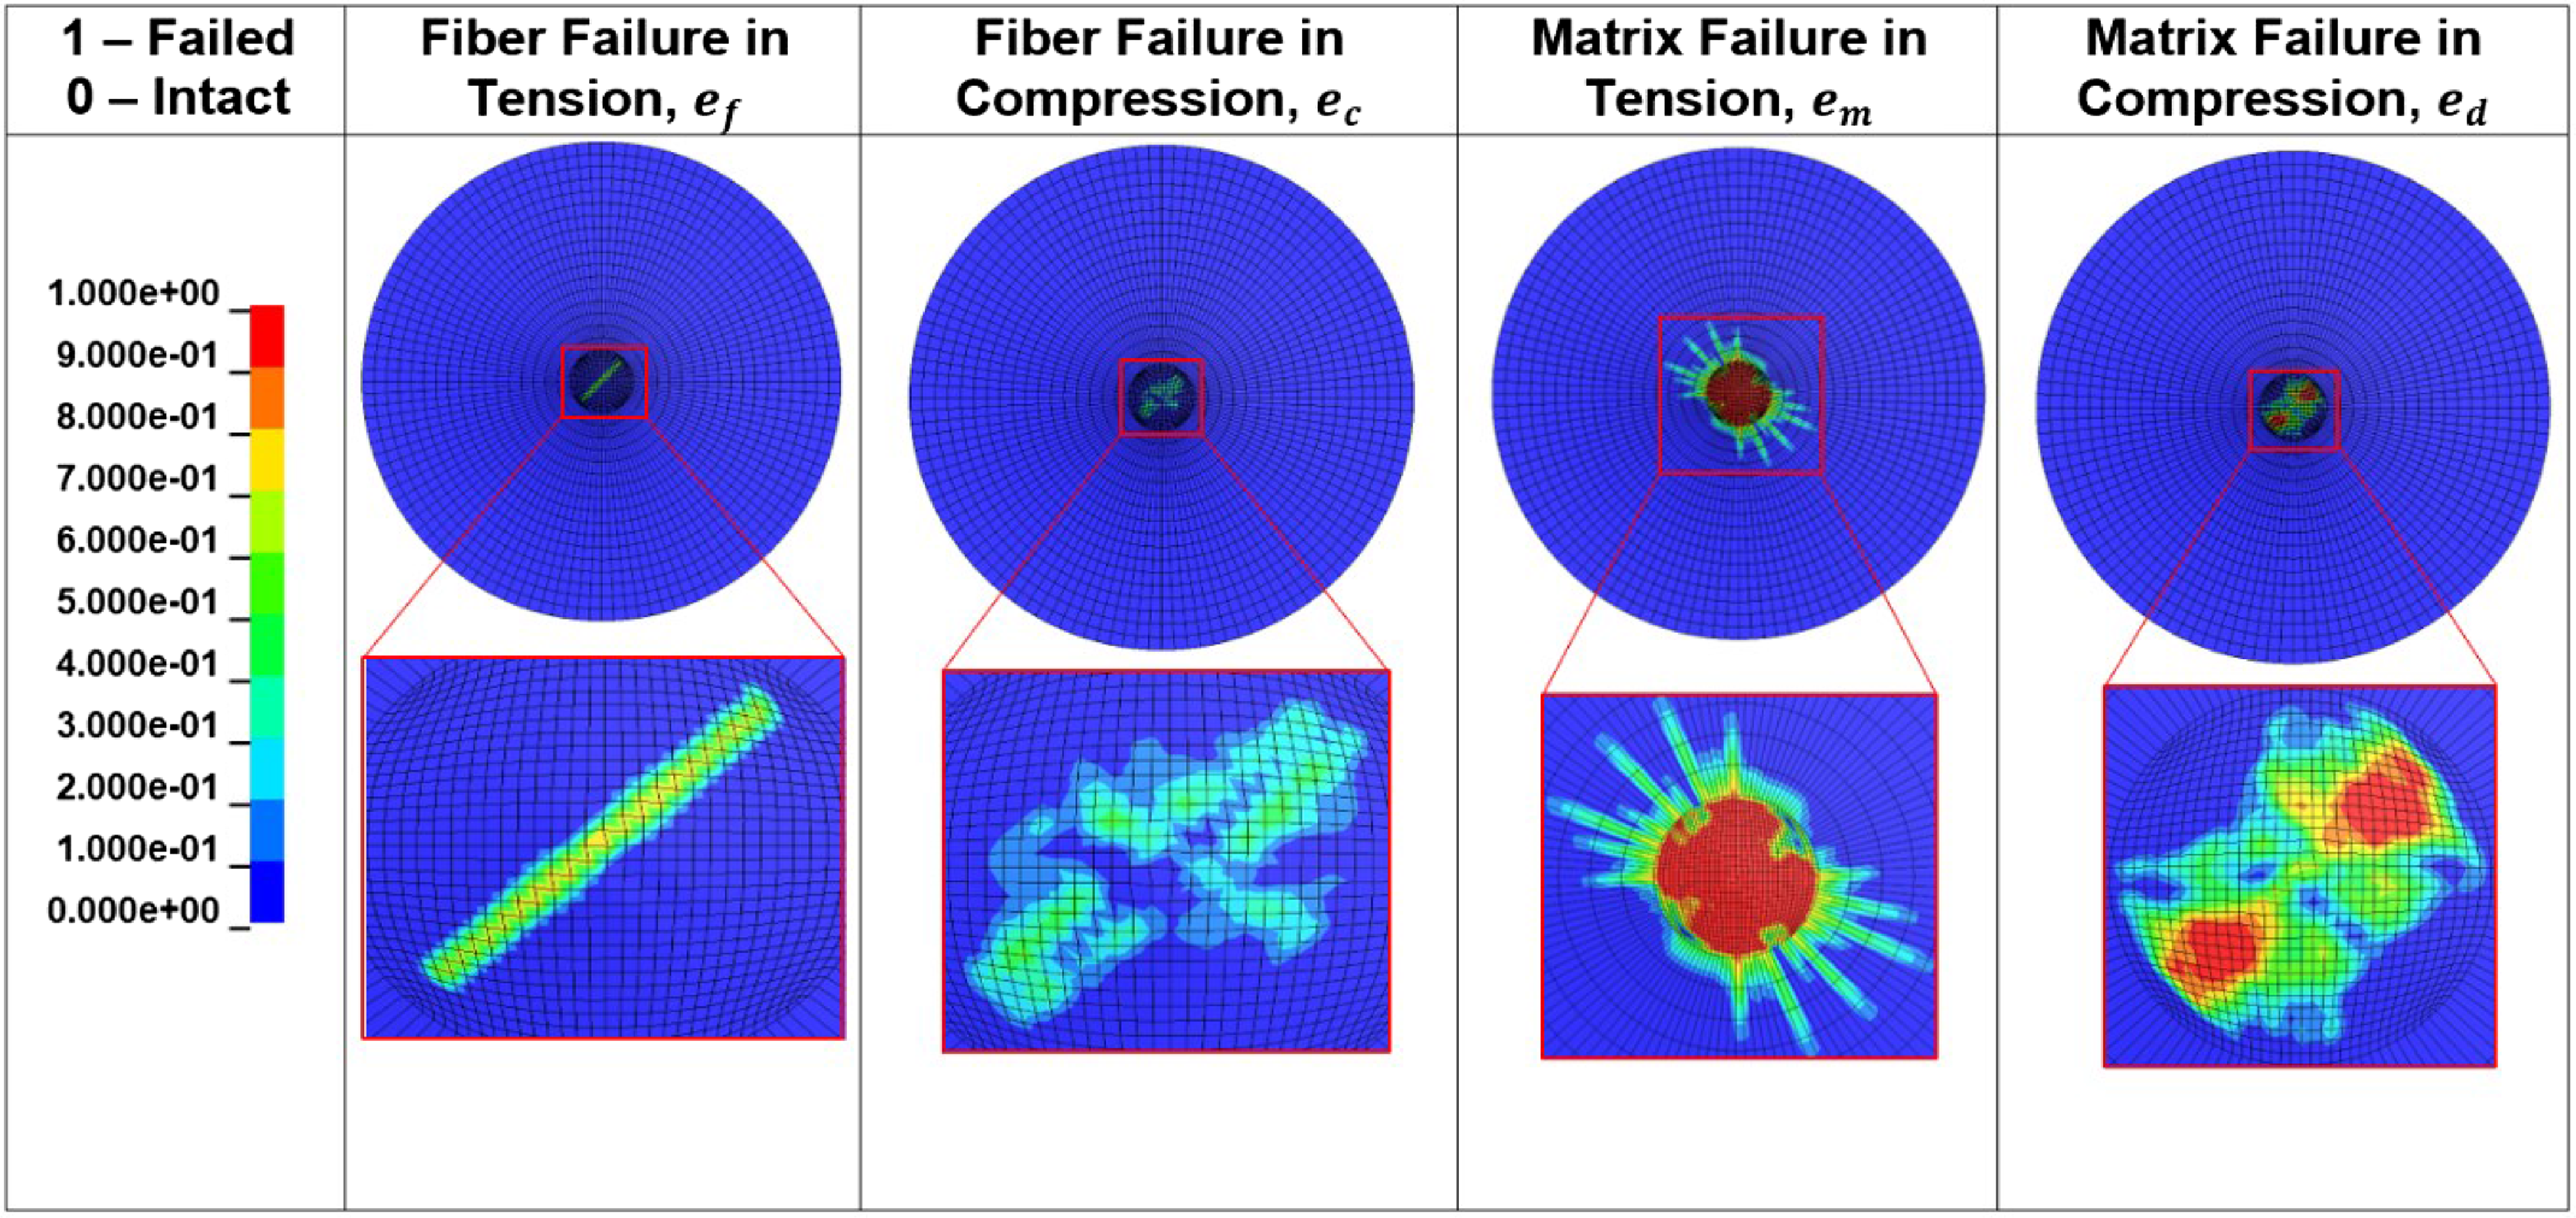
Figure 26. Damage at delamination onset.
Figure 27 shows the damage through the thickness of the laminate when delamination initiates for the model with cohesive elements. The damage for fibres in tension starts at the bottom two plies and then propagates upwards. Fibres in compression, on the other hand, are seen to have failed in some regions in the upper plies as expected. The matrix in tension follows a similar trend in which the failure initiates at the bottom plies and propagates upwards, where matrix in compression follows the trend of the fibres in the sense that it fails in the upper plies and undergoes damage in the bottom plies.
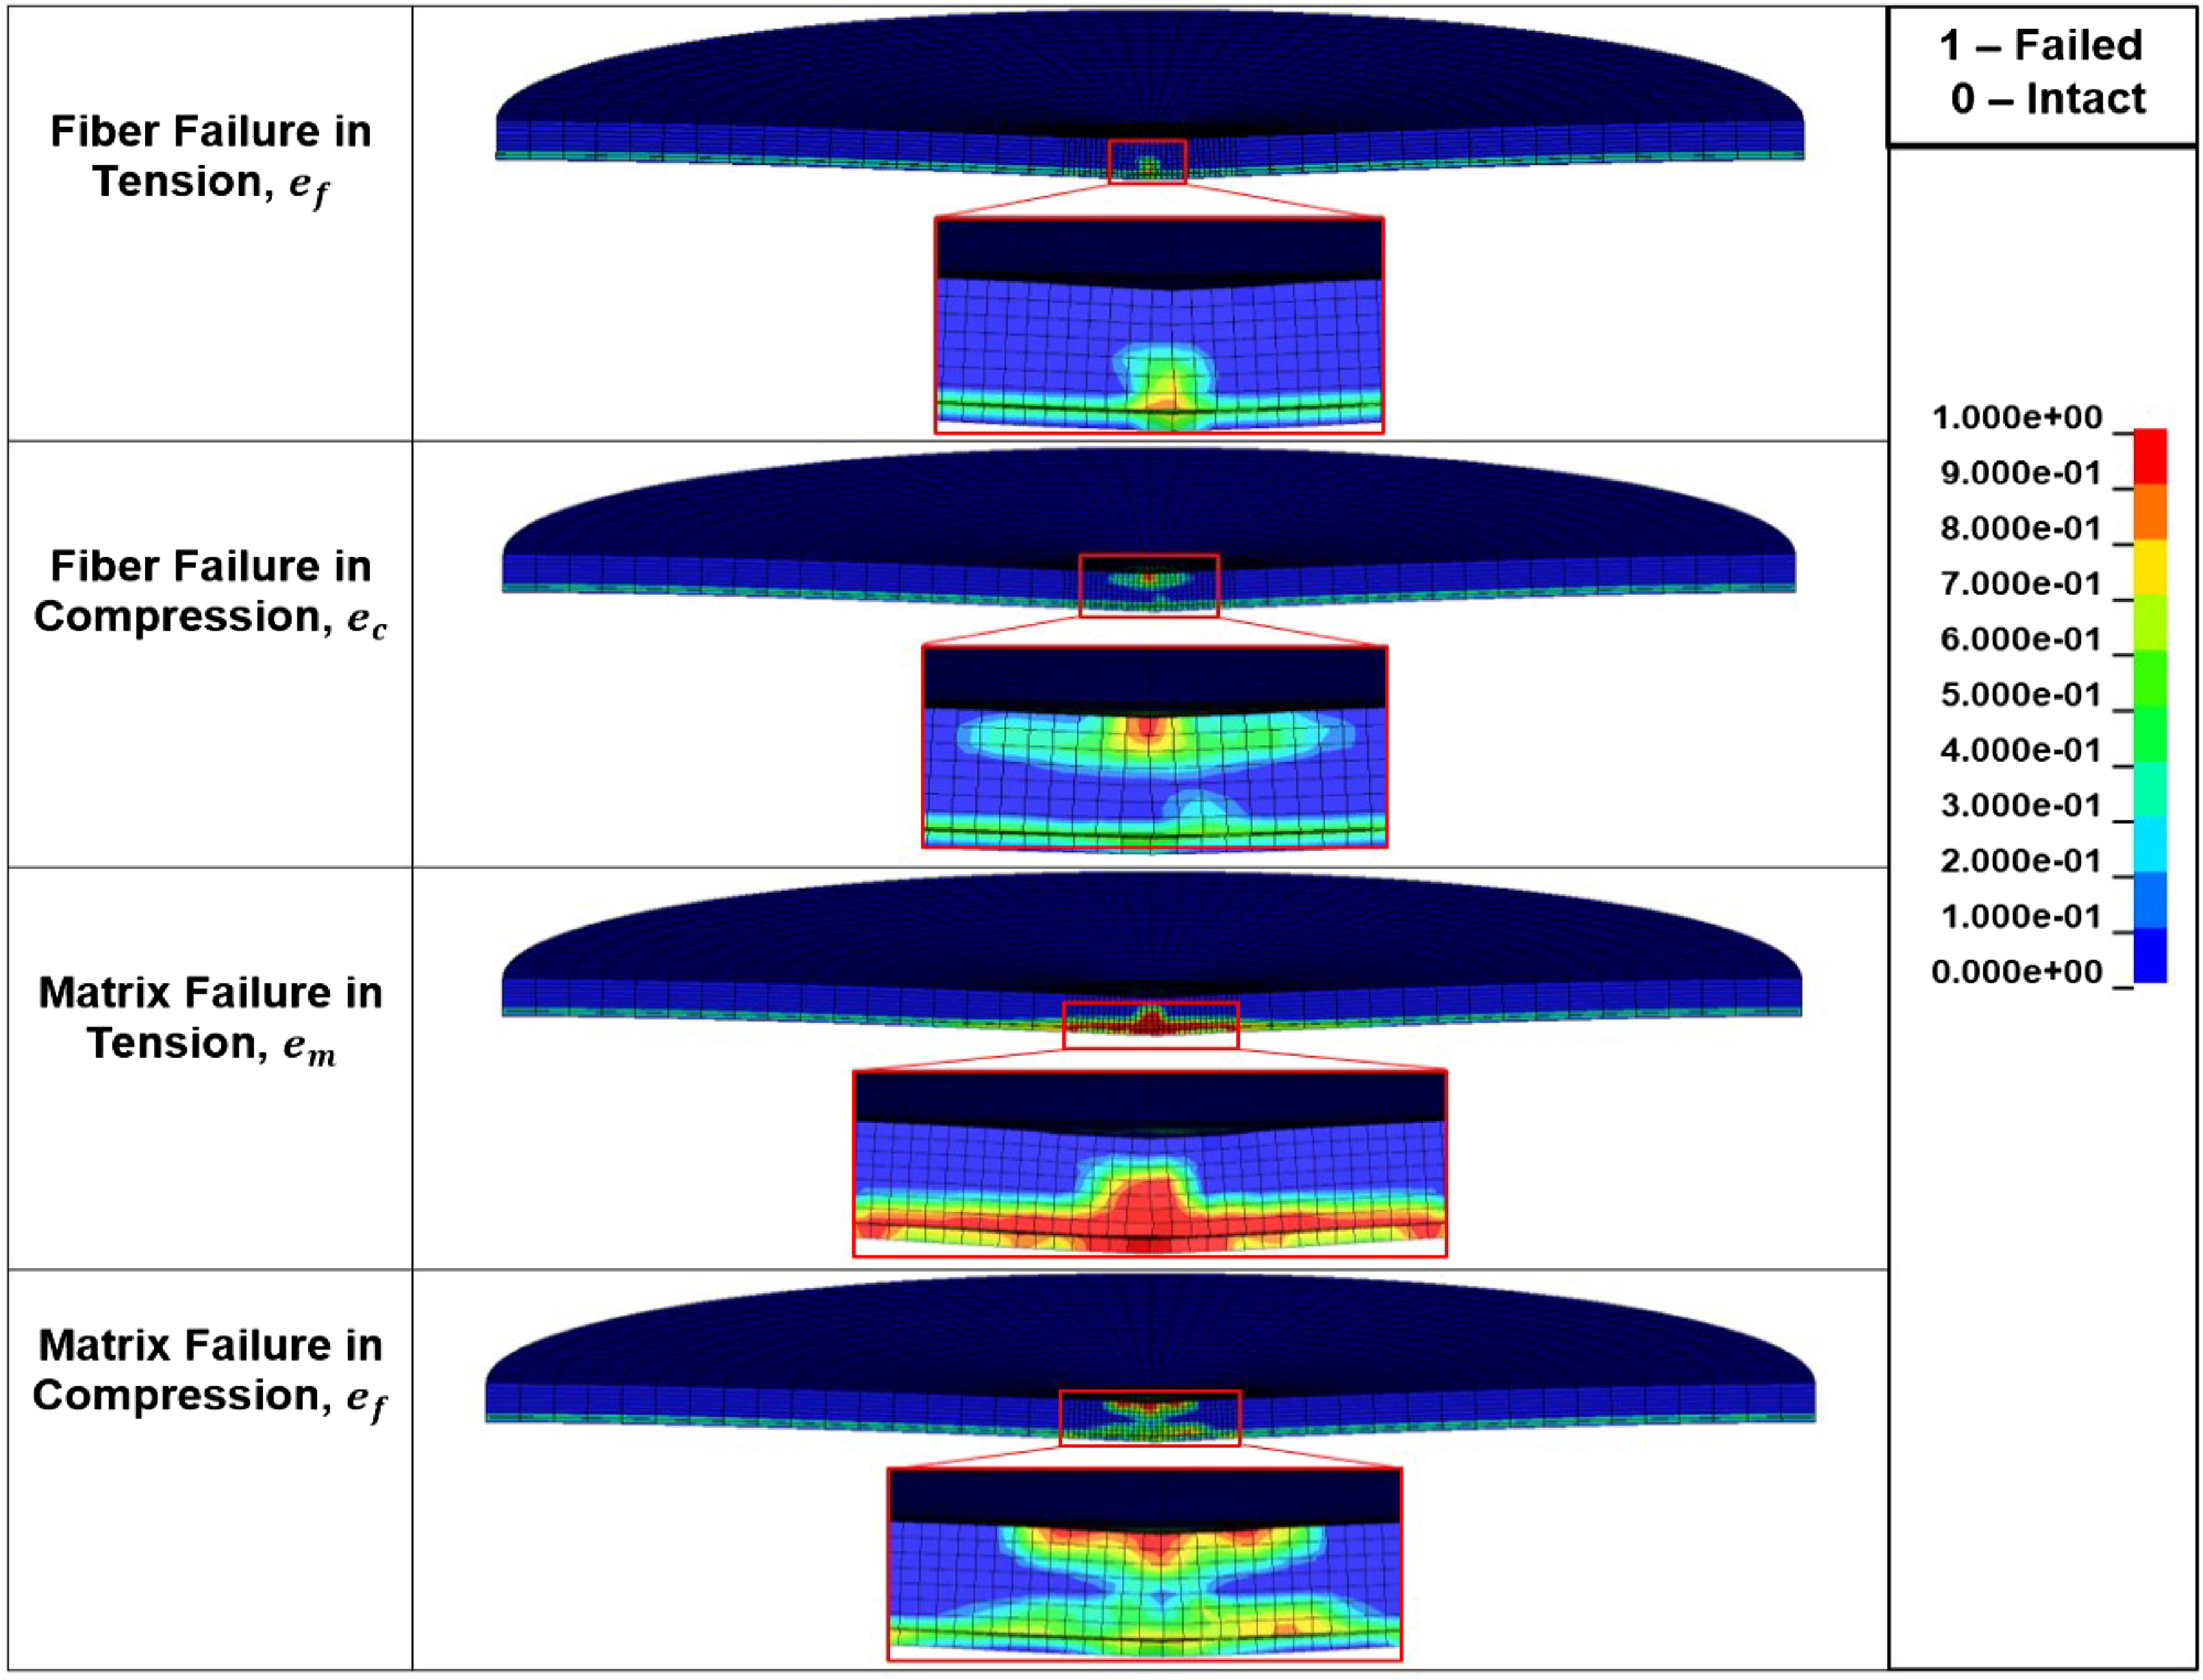
Figure 27. Through thickness damage at delamination onset.
Figure 28 shows the force-time history of the CZM and tiebreak constitutive models in LS-Dyna compared with the experimental data during the initial stages of damage. Delamination initiation occurs at around 0.446ms, which is indicated by the black arrow. Both models agree with the experimental force-time history well. Large drops in applied loading are seen around 0.43–0.45 ms when the initial delamination occurs. Further drops in the load histogram indicate delamination propagation and the formation of the initial crack. The simulation results, particularly those of the tiebreak model, do not capture any significant load drops as distinctively observed in the experiment. This may have been caused by the fact that delamination measures were not incorporated into the interfaces between all plies and that the element failure and deletion was not activated in the models. As a result, the laminate can only experience an elastic response, leading to an increased load-bearing capacity of the structure.
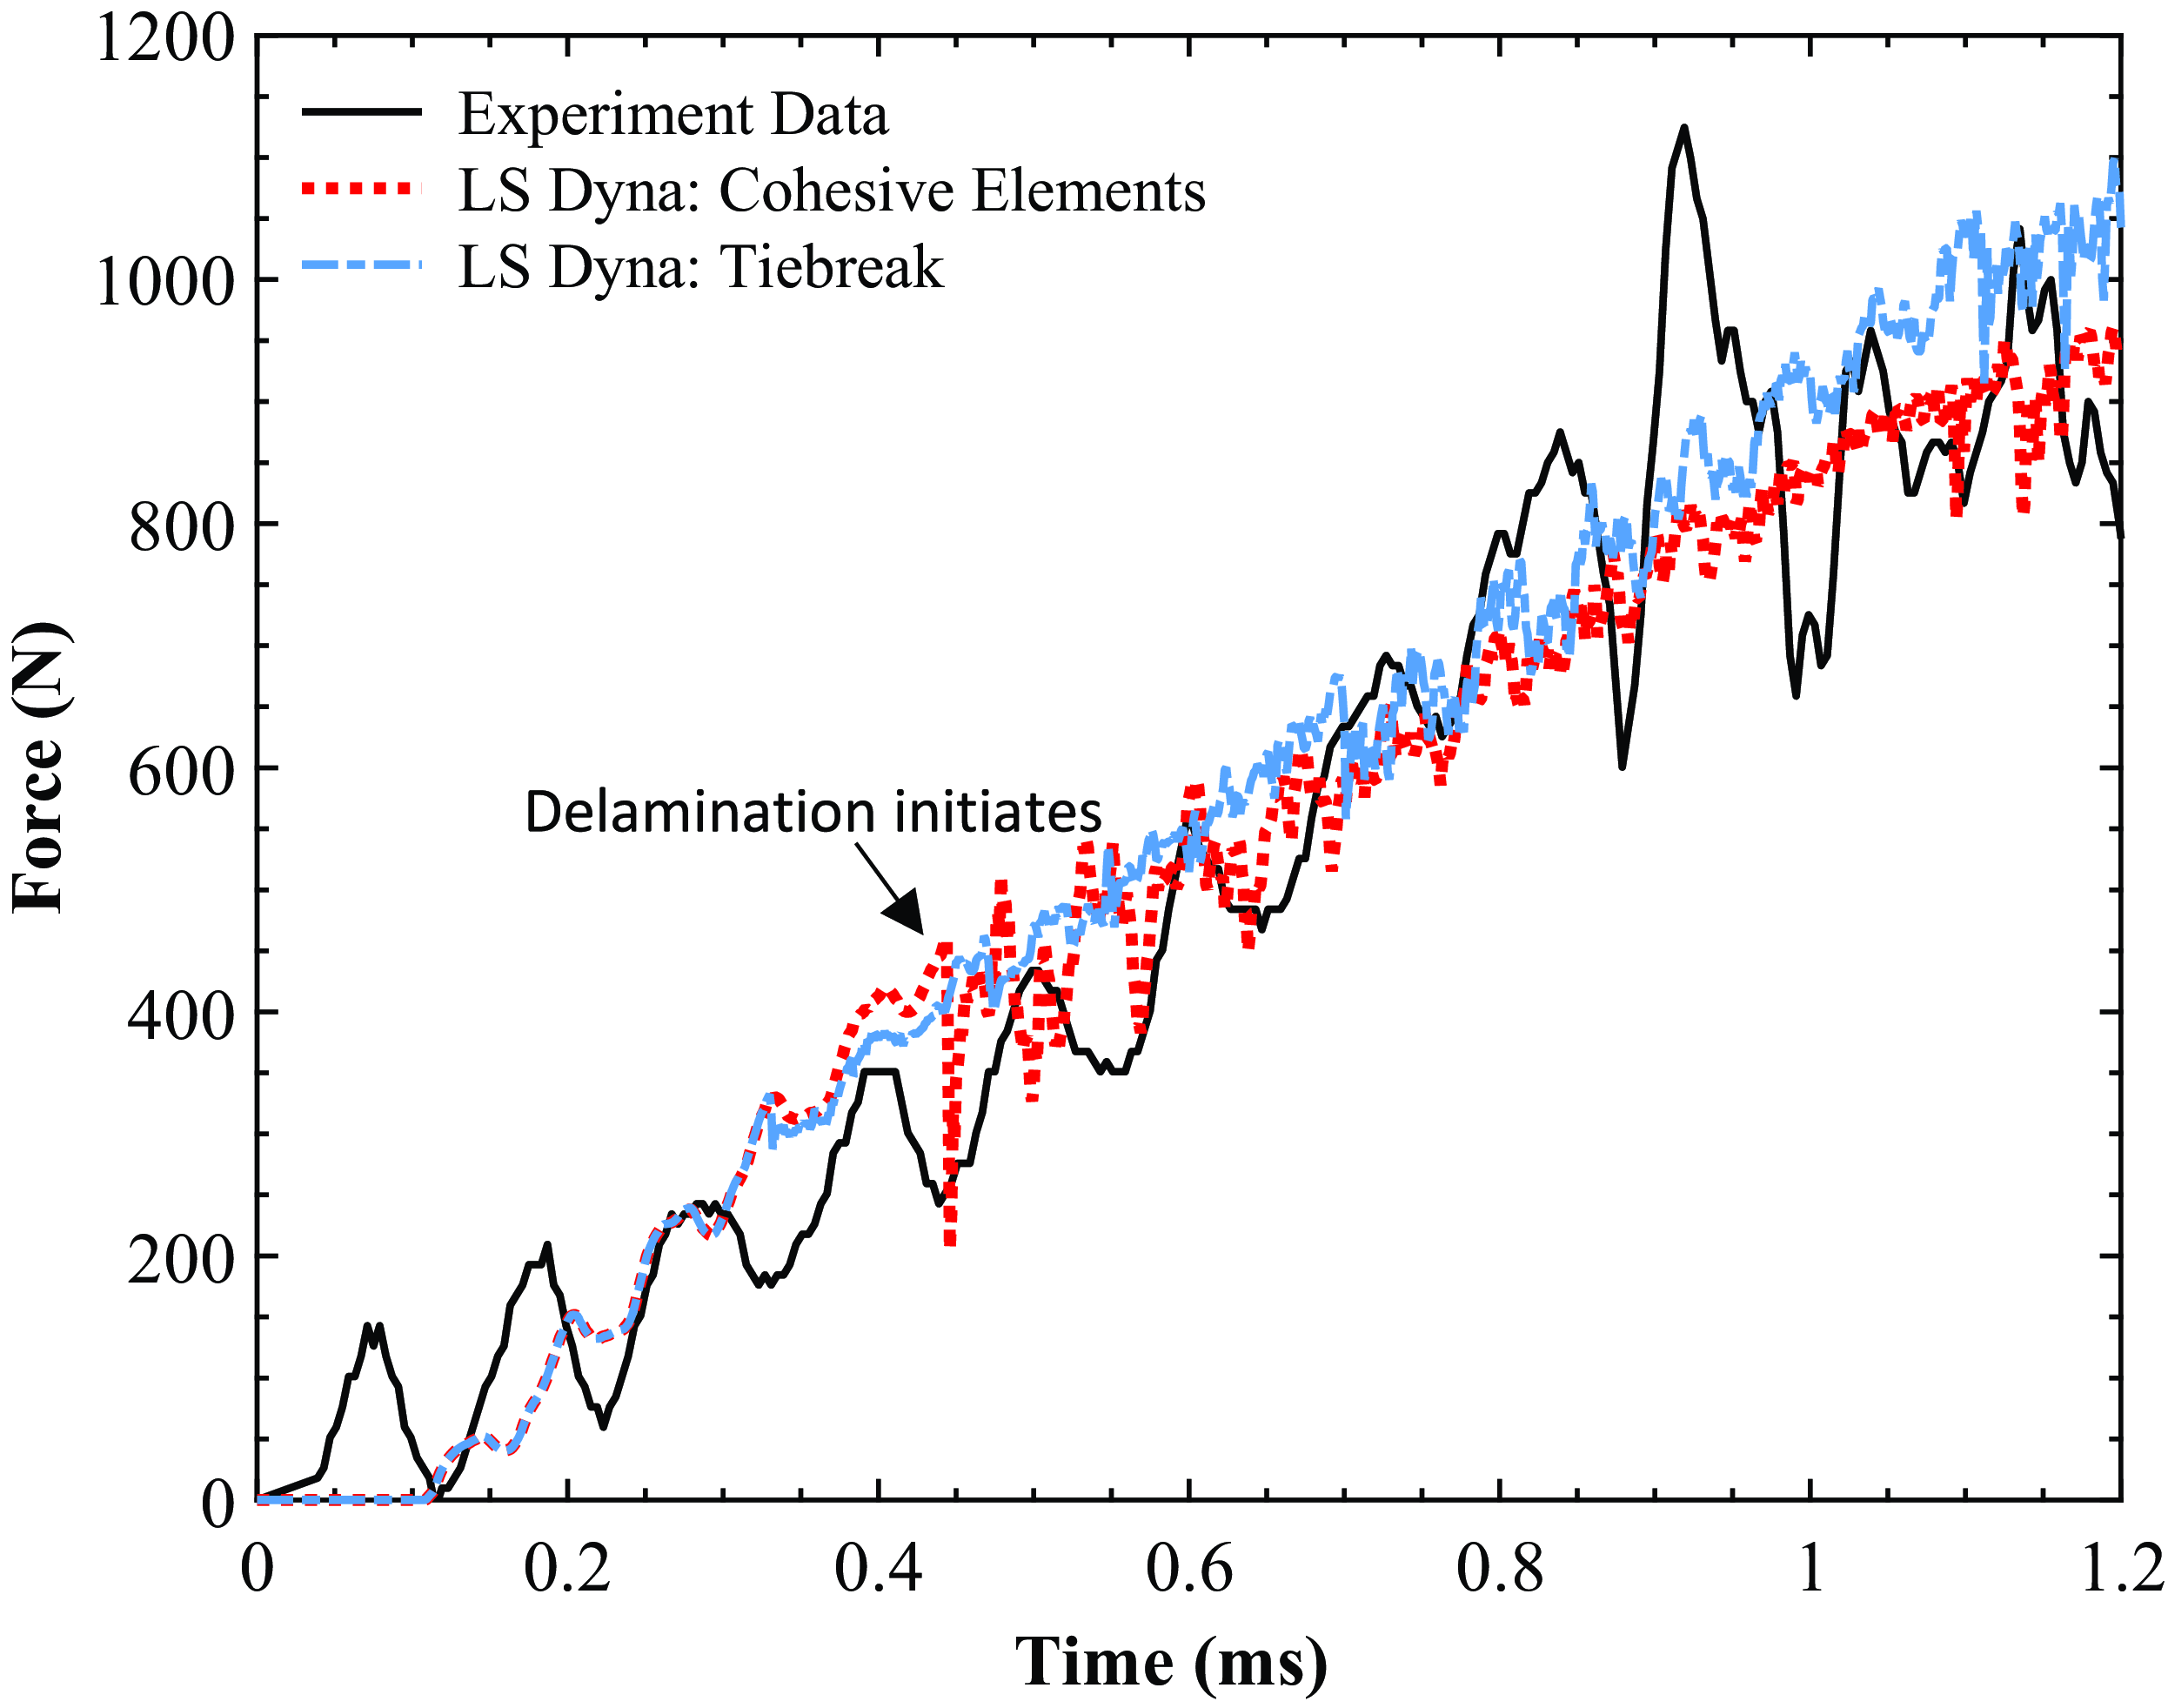
Figure 28. Comparison of force-time histories between CZM and tiebreak model in LS-Dyna during the initial stages of delamination.
5.0 Conclusion
The initial stages of damage at ply level is analysed in the presence of delamination in a CFRP laminate under impact loading using Abaqus/Explicit and LS-Dyna analysis tools. Different capabilities of each software are used for the study of the damage at early stages of the impact. A quasi-isotropic CFRP laminate is modelled under a 5 J impact scenario to examine its dynamic response. The results of the FE models are compared with the test data. The FE models are calibrated using a quasi-static indentation test. Results from the quasi-static indentation test for calibration can be summarised as follows:
-
The maximum and minimum strain magnitudes of the FE results are within the range of the readings obtained using DIC.
-
The elastic response of the FE models from Abaqus/Standard and LS-Dyna predict the experimental data well, showing a maximum displacement of about 0.25 mm at the centre.
The results for dynamic impact test carried using Abaqus/Explicit can be summarised as follows:
-
The FE model resulted in a good prediction of the experimental force in terms of linear elastic response.
-
The Puck and Cuntze criteria were able to correctly predict the failure at high stress concentration at edge elements around the pre-crack using the fracture angles implemented. The lack of contact between plies at the interface and the infinite stiffness of the VCCT contact might have resulted in the overestimation of the stress leading to the failure criteria being overcome.
-
Through the implementation of the failure criteria in terms of effective stresses, Abaqus/Explicit was able to analyse the influence of a pre-crack in damage evolution cases. The damage footprint increased in UD-plies where VCCT was not applied.
-
The user defined subroutine capabilities within Abaqus/Explicit allowed failure criteria that were not otherwise part of its default library to be developed.
-
The implementation of the subroutines for the Cuntze and Puck criteria allowed the characterisation of the global response of the laminate and the determination of the fracture angle.
-
The VCCT used in conjunction with the user-defined subroutines enabled an investigation into the influence of delamination.
The results for the dynamic impact tests modelled using LS-Dyna can be summarised as follows:
-
The models simulated were able to predict the damage onset and delamination well. Their predicted stiffer responses, compared to the experimental data, were attributed to not incorporating the element deletion option, and hence the model’s ability to carry more stress.
-
Initial delamination was captured well using cohesive elements, showing their capacity to both accurately predict as well as effectively visualise the spread of delamination.
-
Comparing the magnitude of von Mises stresses in both CZM and tiebreak, it was observed that they were in close agreement and showed almost identical patterns.
-
When assessing the force-time histories of CZM and tiebreak compared with the experimental data, it was observed that both graphs followed the overall trend of the test well and offered reasonably good prediction of the force magnitudes pre- and during early delamination phase.
-
Tiebreak model was found to be more computationally expeditious than CZM.
Comparing the results between Abaqus/Explicit and LS-Dyna, it was observed that the constitutive models in both software were able to predict similar damage patterns and delamination values. The delamination initiation however occurred earlier without ply degradation (Abaqus/Explicit), than in models with damage evolution activated (LS-Dyna). This is due to the higher load-bearing capacity of the unidirectional plies at the linear-elastic regime, making the response stiffer at the interface. The pre-crack modelled using VCCT prompted delamination to form and propagate faster as a consequence of the zero strength in that zone. The impact response of the laminate up to the initial stages of damage was predicted well using both constitutive models. As analysis tools, both LS-Dyna, with its composite damage and delamination features, and Abaqus/Explicit, with its user defined elastic model capabilities, allowed for a better understanding of the intricate dynamic performance of the composite specimen subject to low velocity impact. They relatively accurately and closely captured the onset of damage and subsequent progressive failure.
Acknowledgements
This project was partly funded by the Academy of Finland postdoctoral project: from micro-scale data to macro-scale understanding. Researcher E. Virtanen is acknowledged for his support in using the ultrasonic inspection device. The technical and financial support provided by CRASH Lab is further highly acknowledged. The reviewers are also acknowledged for their valuable feedback and suggestions.
Conflicts of interest
The authors declare none.


 Open access