


Scientific survey research traces its origins to George Gallup’s first nationwide sample survey in 1936. Ever since, researchers have worried that survey responses suffer from misreporting and nonresponse due to the sensitivity of some questions (Maccoby and Maccoby Reference Maccoby and Maccoby1954). In a small number of well-documented cases, validation studies have demonstrated that survey estimates of sensitive traits may be distorted. For example, as discovered in the earliest National Election Studies, survey respondents overreport voter turnout by 10 to 15 percentage points (Campbell et al. Reference Campbell, Converse, Miller and Stokes1960). In the other direction, one meta-analysis found that 30–70% of clinically confirmed drug users underreport drug use (Tourangeau and Yan Reference Tourangeau and Yan2007).
We call this form of measurement error sensitivity bias. The vast extant literature on misreporting and nonresponse in sensitive settings often invokes the term “social desirability bias.” In our view, that term is imprecise. First, it leaves open to interpretation who desires a particular response and why a respondent would care. Second, it does not capture other sources of bias beyond conformity with perceived social norms, including monetary costs and threats to personal safety. In this paper, we build on frameworks from sociology, social psychology, and political science to advance a social reference theory of sensitivity bias that disentangles these considerations.
Cottage industries have emerged in nearly every social science discipline to address sensitivity bias, with approaches falling into three broad categories. First, survey researchers can change the form of the question with techniques like projective questioning (Haire Reference Haire1950) or the method studied in this paper, the list experiment, also known as the unmatched count technique and originally called the item count technique (Miller Reference Miller1984). Second, they can change the social context in which the question is asked (Hatchett and Schuman Reference Hatchett and Schuman1975; Silver, Abramson, and Anderson Reference Silver, Abramson and Anderson1986). Third, they can attempt to identify which types of people are most prone to giving false answers (Berinsky Reference Berinsky2004; Snyder Reference Snyder1987). Each approach comes with costs in terms of development and testing, survey duration, and statistical power. Despite 70 years of methodological innovation, it remains difficult for researchers to decide whether sensitivity bias is likely to be a problem and if it is, how best to address it.
We tackle these questions in three parts. First, we introduce a theory of sensitivity bias to structure thinking about whether bias is likely. Applying our theory to a given empirical setting requires articulating a social referent in particular (for example, the self, a spouse, neighbors, or the state), respondents’ perceptions of the likelihood that responses will be revealed (in part or in full) to that individual or group, and the perceived consequences of the revelations.
Second, the choice among measurement technologies to address sensitivity bias amounts to a bias-variance trade-off (Warner Reference Warner1965). Direct questions may be biased, but they are low variance. Alternative question formats, such as the list experiment (Miller Reference Miller1984), the randomized response technique (Warner Reference Warner1965), the block total response technique (Raghavarao and Federer Reference Raghavarao and Federer1979), and the cross-wise technique (Yu, Tian, and Tang Reference Yu, Tian and Tang2008) may exhibit less bias but are higher variance. Because the list experiment is by far the sensitive question format of choice among political scientists, we restrict our discussion of the bias-variance trade-offs first identified in Miller (Reference Miller1984) for the choice between direct questions and list experiments. The broad strokes of our argument apply to these other formats as well. For a comparison of the bias and variance of these methods, see Rosenfeld, Imai, and Shapiro (Reference Rosenfeld, Imai and Shapiro2016).
Third, we compare 30 years’ worth of list experiments with direct questions in order to estimate the extent of sensitivity bias in many substantive domains. Our census of published and unpublished list experiments extends from the first list experiment published in 1984 up through the end of 2017, when we concluded data collection. This body of research covers topics of major interest to political scientists including racial prejudice, turnout, and vote buying, but also criminal behavior, sexual activity, and drug and alcohol use. Our results indicate that sensitivity bias is typically small to moderate, contra the evident expectation on either the authors’ or their real or imagined reviewers’ parts that misreporting was a large concern. However, there is considerable heterogeneity in sensitivity bias across substantive domains. We find evidence of overreporting of support for authoritarian regimes and suggestive evidence of overreporting for voter turnout, underreporting in vote buying and criticism of authoritarian regimes, but nearly no evidence of sensitivity bias in measures of prejudice.
Determining whether sensitivity bias is likely to be a problem in a particular domain is often a matter of intuition, conjecture, or previous theoretical expectations. Researchers can use our empirical results to recalibrate their expectations of sensitivity bias and to reassess their position on the bias-variance frontier. Even when we can be confident that list experiments generate unbiased prevalence estimates, they are far less accurate (in terms of mean-square error) than direct questions at typical sample sizes.
A Social Reference Theory of Sensitivity Bias
Why do questions about sensitive topics in surveys yield biased responses? We develop a social reference theory of sensitivity bias that distinguishes between the sensitivity of the topic and the properties of the measurement tool (typically self-reported responses to direct questions in sample surveys).
To formalize sensitivity bias, we assume that a subject  $$ i $$ harbors a latent true value of the sensitive trait,
  $$ {D}_i^{\ast } $$. The latent value may differ from the response that a subject would give if asked directly,
  $$ {D}_i $$. We assume that
  $$ {D}_i^{\ast } $$ exists and that the survey question is designed with sufficient construct validity that subjects understand that researchers are asking subjects to report
  $$ {D}_i^{\ast } $$. If the subject does not respond when asked,
  $$ {D}_i $$ is missing (
 $$ {D}_i=\mathrm{NA} $$). In the most general terms, measurement error occurs if
  $$ {D}_i\ne {D}_i^{\ast } $$—that is, if there is any slippage between the latent trait and the survey response. Measurement error may result from many different causes, including technical slipups, miscommunications between respondent and interviewer, respondent memory failures, or even deliberate falsification of responses by survey staff. We are concerned here with the special form of measurement error that occurs when
  $$ {D}_i\ne {D}_i^{\ast } $$ because of the sensitivity of the question, which could result from either conscious or unconscious processes (Tourangeau and Yan Reference Tourangeau and Yan2007). When
  $$ {D}_i^{\ast } $$ is binary (the case we consider here), a common target of inference is the average value of
  $$ {D}_i^{\ast } $$, or the prevalence rate
  $$ {\pi}^{\ast}\equiv \mathrm{E}\left[{D}_i^{\ast}\right] $$. If survey reports are distorted by sensitivity bias, then direct questions may only estimate
  $$ \pi \equiv \mathrm{E}\left[{D}_i\mid {D}_i\ne \mathrm{NA}\right] $$, which equals the prevalence rate plus a bias term. Sensitivity bias may be defined as
  $$ \delta \equiv \pi -{\pi}^{\ast } $$. If
  $$ \delta $$ is positive, direct questions exhibit overreporting, and if
  $$ \delta $$ is negative, they exhibit underreporting.Footnote 1 The difference
  $$ {D}_i-{D}_i^{\ast } $$ may vary by unit or subgroup, and sensitivity bias can be calculated by subgroup by taking the two expectations over a subset of units.
Our model of sensitivity bias requires that a (unique) latent value  $$ {D}_i^{\ast } $$ exists for each subject. This assumption would be violated if subjects do not harbor specific attitudes and beliefs (even if they would respond when asked a question on a survey). Further, we do not consider settings with “multiple truths,” which would mean that
  $$ {D}_i^{\ast } $$ is random or vector-valued. In order to speak coherently about sensitivity bias, we have to imagine there is a true, scalar latent trait
  $$ {D}_i^{\ast } $$ that may or may not be different from the survey response
  $$ {D}_i $$.
The dominant explanation for sensitivity bias since the 1950s has been social desirability bias (Maccoby and Maccoby Reference Maccoby and Maccoby1954). According to Fisher (Reference Fisher1993, 303), social desirability bias results from “the desire of respondents to avoid embarrassment and project a favorable image to others.” Goffman’s The Presentation of the Self in Everyday Life (Reference Goffman1959) launched research inquiries across sociology and social psychology into the importance of impression management or self-presentation (for a review, see Leary and Kowalski Reference Leary and Kowalski1990). Goffman argues that people have in their own minds an idea of how they are perceived by others and take actions to improve that perception. Social desirability bias is a behavioral manifestation of self-presentation. Beyond social desirability, scholars have identified self-image, the fear of disclosure of responses, and intrusive topics as additional causes of sensitivity bias.
Three elements of a survey jointly determine whether an item will be affected by these biases: the topic of the question (is it sensitive or not), the format of the question (is the question asked directly and what assurances of anonymity are made), and the context in which it is asked (who is listening to responses, and who can read or hear them after the interview).
The last element highlights the fact that we must know with respect to whom respondents manage impressions. Psychologists and political scientists have developed and applied scales to measure person-constant levels of sensitivity bias and have shown that different people withhold at different rates (Berinsky Reference Berinsky2004; Paulhus Reference Paulhus, Robinson, Shaver and Wrightsman1991; Snyder Reference Snyder1987). We interpret these findings as evidence of individuals’ idiosyncratic beliefs about relevant social referents. Respondents hold beliefs about who is asking questions, who sent the interviewers to ask, who can overhear the responses, and who can read responses after the interview is conducted. Beliefs may be heterogeneous across contexts and across respondents. For example, we demonstrate in the supplementary materials that respondents to the Afrobarometer vary widely in their perceptions of the survey sponsor.
Perhaps the most salient social referent for subjects is the interviewer asking the survey questions (Feldman, Hyman, and Hart Reference Feldman, Hyman and Hart1951). Subjects may presuppose (rightly or wrongly) that interviewers have an opinion about what the correct attitude to hold is. Using randomized experiments, scholars have demonstrated interviewer effects for interviewer race (Cotter, Cohen, and Coulter Reference Cotter, Cohen and Coulter1982; Davis Reference Davis1997; Hatchett and Schuman Reference Hatchett and Schuman1975), gender (Catania et al. Reference Catania, Binson, Canchola, Pollack, Hauck and Coates1996; Huddy et al. Reference Huddy, Billig, Bracciodieta, Hoeffler, Moynihan and Pugliani1997; Kane and Macaulay Reference Kane and Macaulay1993), and perceived religiosity (Blaydes and Gillum Reference Blaydes and Gillum2013). Bystanders, family members, coworkers, or others who may be within earshot constitute different sets of social referents (Silver, Abramson, and Anderson Reference Silver, Abramson and Anderson1986). Subjects might feel constrained to respond in a particular manner or not at all if under the watchful eye of a spouse (Aquilino Reference Aquilino1993). Other more distant social referents may include those who will read responses after the survey ends, such as the sponsoring institution or academic analysts (Corstange Reference Corstange2014); consumers of the survey data including the media and the general public; or more worryingly, the government or armed groups who might take punitive action depending on the response (Lyall, Blair, and Imai Reference Lyall, Blair and Imai2013).
Social desirability is not the only source of sensitivity bias. First, respondents face pressures that come from themselves, not only others (Greenwald and Breckler Reference Greenwald, Breckler and Schlenker1985). Second, questions may be seen as intrusive, representing taboo topics respondents feel are out-of-bounds (Tourangeau, Rips, and Rasinski Reference Tourangeau, Rips and Rasinski2000). For taboo topics, the act of responding, separate from the content of the response, may itself be sensitive. In such cases, sensitivity bias may manifest as nonresponse. Third, respondents may fear their responses will be disclosed to authorities such as governments, criminals, armed groups, or employers. The worry here is not what is socially desirable but instead what is safe.
We synthesize these strands into a social reference theory of sensitivity bias. Sensitivity bias occurs for a given respondent if and only if all four of the following elements are present:
1. A social referent (one or more people or organizations) the respondent has in mind when considering how to respond to a survey question. A social referent could be the respondent themself.
2. A respondent perception that the social referent can infer the subject’s response to the sensitive question either exactly or approximately.Footnote 2
3. A respondent perception about what response (or nonresponse) the social referent prefers.
4. A respondent perception that failing to provide the response preferred by the social referent would entail costs to themself, other individuals, or groups. Costs may be social (embarrassment), monetary (fines), or physical (jail time or personal violence).
These four elements can help structure expectations about when to worry about sensitivity bias. These expectations, importantly, may vary across different types of respondents (for example, in some circles racist views may be something to hide, but in others something to flaunt). If respondents do not have social referents in mind, or if they truly believe their answers will remain confidential, or if they do not know the preferences of the referent, or if they perceive the referent to be powerless to inflict costs, then standard survey measures may be free of sensitivity bias. When all four elements are present, articulating how they play out in a specific context can generate educated guesses about the plausible direction and magnitude of bias. These guesses can be tested empirically by collecting survey and focus group data from respondents about their second-order beliefs about relevant reference groups or directly estimating sensitivity bias.
This theory helps to distinguish sensitivity bias from other forms of measurement error, such as the distinction between self-deception and recall failures (Holbrook and Krosnick Reference Holbrook and Krosnick2010). If respondents misreport because they do not want to admit, even to themselves, that they participate in the sensitive behavior, direct questions will suffer from sensitivity bias. If however, respondents simply do not spend sufficient cognitive energy to recall whether, for example, they voted in the most recent election, direct questions will be biased, but not because of sensitivity. The theory also helps us to understand how the same question may be sensitive in one context but not another. Respondents may perceive that different referents prefer different answers, which raises the possibility of cross-cutting sources of bias. Related to this point is the idea that sensitivity bias will depend on survey mode. The important social referents in a face-to-face household survey will likely differ from those in an online or telephone survey (Hochstim Reference Hochstim1967).
A voluminous literature examines the link between implicit and explicit attitudes (Greenwald and Banaji Reference Greenwald and Banaji1995; Greenwald, McGhee, and Schwartz Reference Greenwald, McGhee and Schwartz1998). Since implicit attitudes are thought to operate at an unconscious level, respondents themselves may be unable to self-report them accurately. As a result, our theory likely applies to explicit attitudes and behaviors only (see also Littman Reference Littman2015).
Sources of Sensitivity Bias in Four Political Science Literatures
In this section, we apply our theory to four political science research literatures in which sensitivity bias has been identified by researchers as a major source of measurement error. We reinterpret their reasoning through the lens of the four criteria for sensitivity bias. We present a (not necessarily exhaustive) list of social referents and how the criteria are applied in each literature in Table 1.
Table 1. Possible Sources of Sensitivity Bias in Four Political Science Literatures

Clientelism in Developing Countries
The dominant mode of politics in many developing countries is clientelism, in which material goods are exchanged by politicians and voters in return for votes on an individual basis rather than on the basis of need as in programmatic political systems (for a review of accounts in political science, see Stokes Reference Stokes, Boix and Stokes2007). One important behavior that characterizes clientelistic systems, vote buying, is by its nature hidden. As a result, survey research—asking voters if they exchanged their vote for goods—is required both to measure its prevalence and whom is targeted by offers of exchange (Weitz-Shapiro Reference Weitz-Shapiro2012).
A recent flurry of scholarship has probed whether survey measures of vote buying are distorted by sensitivity bias. Vote buying is illegal in most places, so respondents may have a reasonable fear of prosecution (Lebanon, Corstange Reference Corstange2017; Nicaragua, Gonzalez-Ocantos et al. Reference Gonzalez-Ocantos, de Jonge, Meléndez, Osorio and Nickerson2012; Mexico, Imai, Park, and Greene Reference Gonzalez-Ocantos, de Jonge, Meléndez, Osorio and Nickerson2014; Hungary and Romania, Mares and Young Reference Mares and Young2019; Singapore, Ostwald and Riambau Reference Ostwald and Riambau2017). In some contexts, however, voters may not be concerned about the illegality of vote buying because of lax enforcement. For example, in a study of vote buying in the Philippines, Cruz (Reference Cruz2019, 390) speculates that the low levels of sensitivity bias in direct questions about the practice may be explained by the high prevalence of vote buying or because “laws that forbid it are rarely enforced in the Philippines.” Respondents may be reluctant to admit selling their vote because of “the implication that they are poor enough to sell their votes” (Stokes Reference Stokes2005, 321). Similar logics have been forwarded for Lebanese (Corstange Reference Corstange2017) and Nicaraguan (González-Ocantos et al. Reference González-Ocantos, de Jonge and Nickerson2015) respondents. Beyond the possible association with low socioeconomic standing, respondents may wish to avoid being seen as a participant in an immoral or unethical behavior (Mares, Muntean, and Petrova Reference Mares, Muntean and Petrova2018) or to “acknowledge that the handout influenced their vote” (Brusco, Nazareno, and Stokes Reference Brusco, Nazareno and Stokes2004, 69). Respondents may also wish to avoid appearing to have violated perceived social norms about behavior as a democratic citizen (Kramon Reference Kramon2016). Finally, Frye, Reuter, and Szakonyi (Reference Frye, Reuter and Szakonyi2014) highlights in the Russian case that respondents may have in mind their employer as a social referent, who may have special levers of retaliation.
Prejudice
The frequency and intensity of outright expressions of racial prejudice towards black Americans by white Americans has declined over time, but the causes and consequences of this change remain sources of scholarly and public debate (Bobo Reference Bobo, Katz and Dalmas1988; Schuman et al. Reference Schuman, Steeh, Bobo and Krysan1997). A central theme of the debate is whether old-fashioned racism has been supplanted by a modern form of racism or if little has changed but whites’ willingness to express their racist views in public (Kinder and Sears Reference Kinder and Sears1981; Tesler Reference Tesler2012). The survey research in this literature is beset by deep measurement difficulties, including disagreements about what the relevant theoretical constructs are and what survey questions might measure them (Sniderman and Tetlock Reference Sniderman and Tetlock1986). One point of agreement, however, is that sensitivity bias could undermine any of the measures if respondents believe that interviewers prefer a particular answer and would judge the respondent to be racist if that answer were not given. For this reason, the prediction is that, if anything, respondents underreport racist attitudes. The measurement problem is compounded by the difficulty (or impossibility) of separating attitudes towards policies like welfare or affirmative action from racial attitudes (Gilens Reference Gilens2009). However, if respondents think interviewers think those policy views are the result of racist attitudes, sensitivity bias could infect measures of policy attitudes regardless of the true causes of policy views.
The usual logic of sensitivity bias for racial attitudes extends directly to possible biases in measures of attitudes in other domains such as sexual orientation and religion. Respondents may wish to avoid being seen as retrograde or bigoted, so they may overreport positive attitudes and underreport negative attitudes. Especially in view of the dramatic shifts in public opinion on same-sex marriage, it is reasonable to wonder whether some or all of these changes can be attributed to sensitivity bias (Powell Reference Powell2013). Similarly, religious tolerance and respect for members of other faiths is a widely expressed value in many cultures. The evident social and cultural divisions along religious lines raise the possibility that survey affirmations of religious tolerance are disingenuous (Kane, Craig, and Wald Reference Kane, Craig and Wald2004).
Support for Authoritarian Regimes
At the heart of many models of authoritarian politics is the need for dictators to assess public opinion in order to predict and prevent revolution. The regime faces what Wintrobe (Reference Wintrobe2000) calls the “dictator’s dilemma,” in which the regime needs to know its true support to maintain stability, but publicly revealing dissatisfaction may itself lead to instability.Footnote 3 As a result, dictators may exert pressure on citizens to profess higher levels of support for the regime than they truly hold (a phenomenon labeled “preference falsification,” see Kuran Reference Kuran1997) and prevent polls that reveal low levels of support from being conducted or published. A casual inspection of recent polls on leader approval suggests this is exactly what is happening. High-quality surveys from Russia’s only independent polling agency (Yuri Levada Analytical Center 2019) estimate Russian support for President Vladimir Putin at 89%. According to the 2012–13 World Values Survey China, support for the central government in China is a full 93% (Tang Reference Tang2016). The four sensitivity bias criteria are plausibly met in these settings: (1) the regime is a top-of-mind social referent when answering questions; (2) regime informants can plausibly uncover responses to surveys; (3) citizens know the responses the regime prefers, learned through propaganda; and (4) costs may include harassment, imprisonment, or worse (Chen and Yang Reference Chen and Yang2018; Frye et al. Reference Frye, Gehlbach, Marquardt and Reuter2017).
Voter Turnout
From the earliest investigations into voter behavior in America, scholars have documented that that estimates of voter turnout based on survey self-reports are upwardly biased. Campbell et al. (Reference Campbell, Converse, Miller and Stokes1960, 93–6) report that 74% of the first National Election Study (1952) sample reported voting, whereas the official turnout rate in that election was only 63% (this pattern persists, see Vavreck Reference Vavreck2007). Recent work has shown that this problem affects voter participation research in developing democracies as well (Adida et al. Reference Adida, Gottlieb, Kramon and McClendon2019). The possible sources of error between the survey prevalence rate and the true turnout rate are many: survey nonresponse, item nonresponse, or misreporting. Distinguishing between these sources of error was frustrated by the difficultly of matching survey respondents to individual voter file records. Some of these technical challenges have been overcome and the most recent studies have concluded that misreporting is a major contributor to the discrepancy (Ansolabehere and Hersh Reference Ansolabehere and Hersh2012; Enamorado and Imai Reference Enamorado and Imai2019). Misreporting itself may or may not be due to sensitivity bias as we have conceived of it here. Holbrook and Krosnick (Reference Holbrook and Krosnick2010) subdivides misreporting into “memory errors” and “social desirability bias.” Memory errors occur when respondents do not invest the cognitive effort to be sure they did or did not vote in a particular election. It is possible that respondents remember having voted in some past election and so are more likely to respond yes when asked whether they participated in a particular election. Belli et al. (Reference Belli, Traugott, Young and McGonagle1999) show that some direct question wording variants are able to reduce memory errors of this sort. The list experiment is not designed to help with reducing memory errors, but it may give subjects cover to admit that they did not vote. Because whether or not a person has voted is a public record in many places, subjects are unlikely to be specifically worried about state authorities discovering their survey response. Therefore, the social referents that a survey subject must have in mind are the interviewers, household members within earshot of the interview, and themselves. In all cases, we imagine that the perceived cost of the social referent learning (or relearning, in the case of the “self” social referent) is shame at having failed in a civic duty.Footnote 4
List Experiments to Reduce Sensitivity Bias
The list experiment, also known as the item count technique and the unmatched count technique, hides individual responses to a binary sensitive item by aggregating them with the answers to several binary control items.Footnote 5 Subjects are randomly assigned to treatment and control groups. Those in the control group report how many of a list of control items apply to them; treatment group subjects report how many of a list of the control items plus an additional sensitive item apply to them. The prevalence rate of the sensitive item can be estimated by calculating the difference in the average response given by each group.
This technique mitigates sensitivity bias by hiding the sensitive item response from many possible social referents, including the interviewer, bystanders, or later data consumers, except in the case of floor and ceiling responses (Kuklinski et al. Reference Kuklinski, Sniderman, Knight, Piazza, Tetlock, Lawrence and Mellers1997; Miller Reference Miller1984). The list experiment does not address all sources of sensitivity bias. Intrusive questions may still generate bias because the text of the question includes the same sensitive item text as the direct question. Further, because the list experiment does not hide answers from the respondents themselves, the method will not reduce sensitivity biases arising from self-image concerns.
We illustrate the logic of the list experiment with an example. Kramon (Reference Kramon2016) reports on a nationally representative survey of 1,927 Kenyans administered after the 2007 Kenyan elections. The survey focuses on estimating the proportion of voters who experienced vote-buying attempts during the election. To do so, the authors use a list experiment and a direct question. Respondents were randomized into a control group or one of two treatment groups. In the control group, respondents were read the following instructions:
Election campaigns are a busy time in our country. I am going to read you a list of some of things that people have told us happened to them during the 2007 campaign. I am going to read you the whole list, and then I want you to tell me how many of the different things happened to you. Please do not tell me which of the things happened to you, just how many. If you would like me to repeat the list, I will do so.
1. Politicians put up posters or signs in the area where you live.
2. You read the newspaper almost every day to learn about the campaign.
3. You met a politician personally to discuss his or her candidacy.
4. You discussed the campaign with a chief or another traditional leader.
In the “Received” treatment group, the same script was read but with a fifth item added to the list:Footnote 6
5. You received money from a party or politician.
In the “Influenced” treatment group, the fifth item read:
5. You voted for a party or politician because they gave you money during the campaign.
Using data from the Kramon (Reference Kramon2016) postelection survey in Kenya (shown in Table 2), we estimate the prevalence rate of vote buying, the main quantity of interest in the study. Figure 1 presents the results. The “influence” question appears to be affected by sensitivity bias. The list experiment estimate, while imprecisely estimated, is definitively higher than the direct question estimate. By contrast, the direct and list experiment estimates of the proportion of respondents who received money from parties or politicians are quite similar.
Table 2. Observed List Experiment Responses by Treatment Status for Whether a Bribe Was Received and Whether a Bribe Influenced the Respondent’s Vote from the 2007 Kenya Postelection Survey Reported in Kramon (Reference Kramon2016)


Figure 1. Estimated Prevalence of Vote Buying from the List Experiments and the Direct Questions for Two Sensitive Items Presented in Kramon (Reference Kramon2016): Whether the Respondent Received a Bribe and Whether a Bribe Influenced the Respondent’s Vote
Trade-offs in the Choice of Measurement Design
The choice between list experiments and direct questions presents a bias-variance trade-off. Direct questions may be biased, but they produce low-variance estimates.Footnote 7 Under their identifying assumptions, list experiments are unbiased but high variance.
Consider a study of  $$ N $$ subjects with a true prevalence rate (
 $$ {\pi}^{\ast } $$) in which the direct question has a sensitivity bias (
 $$ \delta $$).
  $$ {D}_i $$ is the response that subject
  $$ i $$ gives to the direct question. The direct question estimator
  $$ \hat{\pi} $$ is the sample mean,
  $$ \hat{\pi}=\frac{1}{N}\sum \limits_1^N{D}_i $$. The variance of the direct question estimator (
 $$ \hat{\pi} $$) is given by
 $$ \mathrm{V}\left(\hat{\pi}\right)=\frac{1}{N-1}\left\{\right.{\pi}^{\ast}\left(1-{\pi}^{\ast}\right)+\delta \left(1-\delta \right)-2\left(\delta -{\pi}^{\ast}\delta \right)\Big\}.$$
 The variance of the list experiment estimator  $$ \hat{\pi^{\ast }} $$ under a balanced design (in which exactly half of the units are assigned to the treatment list) is given by:
 $$ {\displaystyle \begin{array}{ccc}\mathrm{V}\left(\hat{\pi^{\ast }}\right)=\frac{1}{N-1}\left\{\right.{\pi}^{\ast}\left(1-{\pi}^{\ast}\right)+4\mathrm{V}\left({Y}_i(0)\right)+4\operatorname{cov}\left({Y}_i(0),{D}_i^{\ast}\right)\Big\},\end{array}} $$
 where  $$ \mathrm{V}\left({Y}_i(0)\right) $$ is the variance of the control item count and
  $$ \operatorname{cov}\left({Y}_i(0),{D}_i^{\ast}\right) $$ is the covariance between the control item count and the true sensitive item response. See the supplementary materials for derivations of these variance expressions.
Plugging in  $$ N= $$ 2,000,
  $$ {\pi}^{\ast }=0.5 $$, and
  $$ \delta =0.1 $$ and taking the square root yields a standard error of the direct question estimator of 0.0110, or 1.10 percentage points. Using the average values of the variance of the control items (0.75) and their covariance with
  $$ {D}_i^{\ast } $$ (0.025) estimated from the set of studies in our meta-analysis, we obtain a standard error for the list experiment of 0.0409, or 4.09 percentage points.Footnote 8 For the same number of subjects, the list experiment is
  $$ {\left(4.09\divslash 1.10\right)}^2\approx 14 $$ times more variable than the direct question. Stated differently, a researcher would need a sample of 28,000 subjects in order to produce a list experiment estimate as precise as the direct question with 2,000. The intuition for this stark shortcoming of the list experiment is that only half the sample is asked about the sensitive item and their responses are further obscured by adding noise.
This bias-variance trade-off interacts with the goal of the research. We identify four main goals: estimating a prevalence rate, demonstrating the presence of sensitivity bias, estimating the difference in prevalence rates across groups, and estimating the difference in sensitivity bias across groups.Footnote 9
When the primary research goal is obtaining a good estimate of the prevalence rate of a sensitive item (e.g., Gervais and Najle Reference Gervais and Najle2018, who sought to estimate the proportion of U.S. residents who identify as atheist), it is unclear whether the direct question or the list experiment will render estimates that are closer to the true prevalence rate in terms of root mean square error (RMSE). The two important parameters that govern which approach will be closer are the extent of bias and the sample size of the study. The left panel of Figure 2 provides a visual explanation of how these factors interact. All else being equal, the higher the true bias of the direct question, the more we prefer the list experiment. However, for many sample sizes, the direct question has lower RMSE, even in the face of substantial sensitivity bias. The line in the figure describes the bias-sample size combination at which researchers should be indifferent between the two methods based on RMSE. For a study with 1,000 subjects, the bias must be greater than 5.5 points to prefer a list experiment; at 2,000, the bias must be greater than 4 points. Figure 2 is generated assuming a true prevalence rate of 0.5, but because of the relatively small influence of the true prevalence rate on the variance of the list experiment, the results are quite similar regardless of prevalence rate.
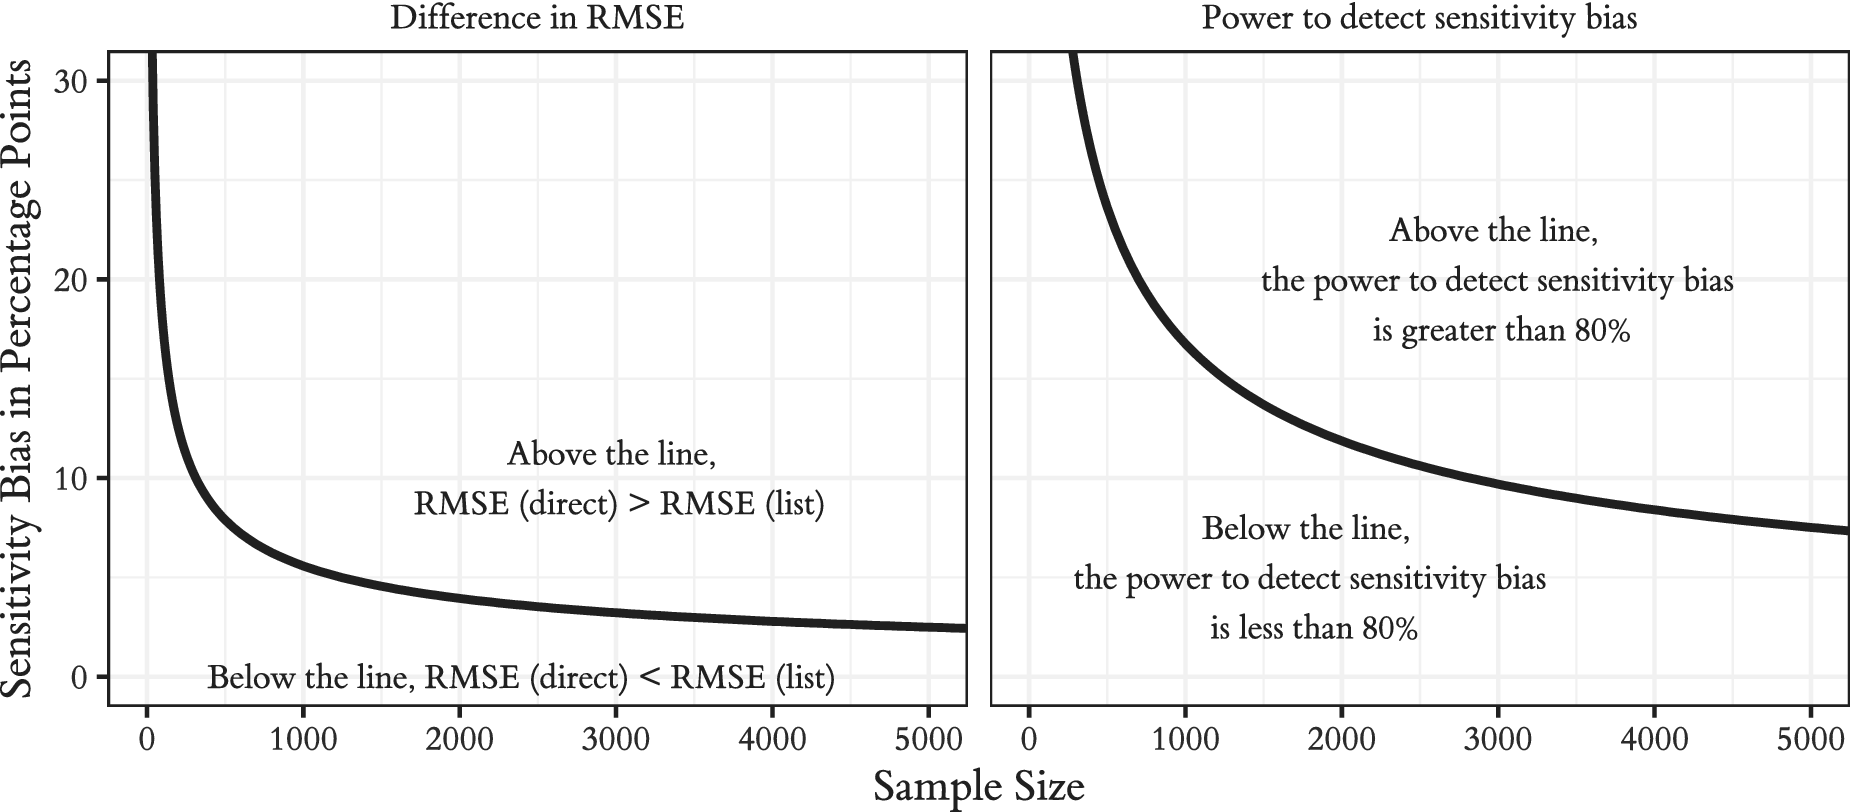
Figure 2. For a Given Sample Size, Whether the List Experiment is Preferred to Direct Questions Depends on the Expected Level of Sensitivity Bias
Another goal in some settings is to show that a particular domain is or is not plagued by sensitivity bias by conducting both a direct question and a list experiment and comparing the results. For example, Lax, Phillips, and Stollwerk (Reference Lax, Phillips and Stollwerk2016) find that the estimated sensitivity bias for same-sex marriage could not be distinguished from zero. The main design parameters that govern the power of this procedure to detect sensitivity bias are again the true level of bias and the sample size. The right panel of Figure 2 plots the bias-sample size combinations at which the power to detect sensitivity bias is 80%. At 1,000 subjects, the bias would need to exceed 16 percentage points in order to reach 80% power; even at a sample size of 2,000, power to detect biases of 10 percentage points is well below the conventional power target.
Many social scientific theories predict that prevalence rates will differ according to subgroups defined by individual-level covariates such as race, gender, or political orientation. Further, some experimental interventions are designed to change whether or not a person holds an attitude or engages in a behavior. Interestingly, for a comparison of direct question responses to generate biased estimates of the difference in prevalence rates across groups, sensitivity must affect responses in each group differently, since otherwise, the biases would cancel each other out when the group prevalence rates are differenced. In order for sensitivity to vary across groups, respondent beliefs about social referents—their preferences, their ability to monitor, or the costs they impose—must be heterogeneous.
In such cases, researchers can employ a list experiment to measure outcomes and then estimate the difference in prevalence rates using an interaction model. As described in Samii (Reference Samii2012), however, this estimator has extremely high variance. Figure 3 panel (a) shows that the power to detect even substantial differences in prevalence rates is abysmal. Differences must exceed 20 percentage points before a 2,000 unit study has 80% power to detect them; they must be 18 points or more in the case of a 3,000 unit sample. Conclusively demonstrating that two groups have different prevalence rates using list experiments requires extreme differences and very large samples.
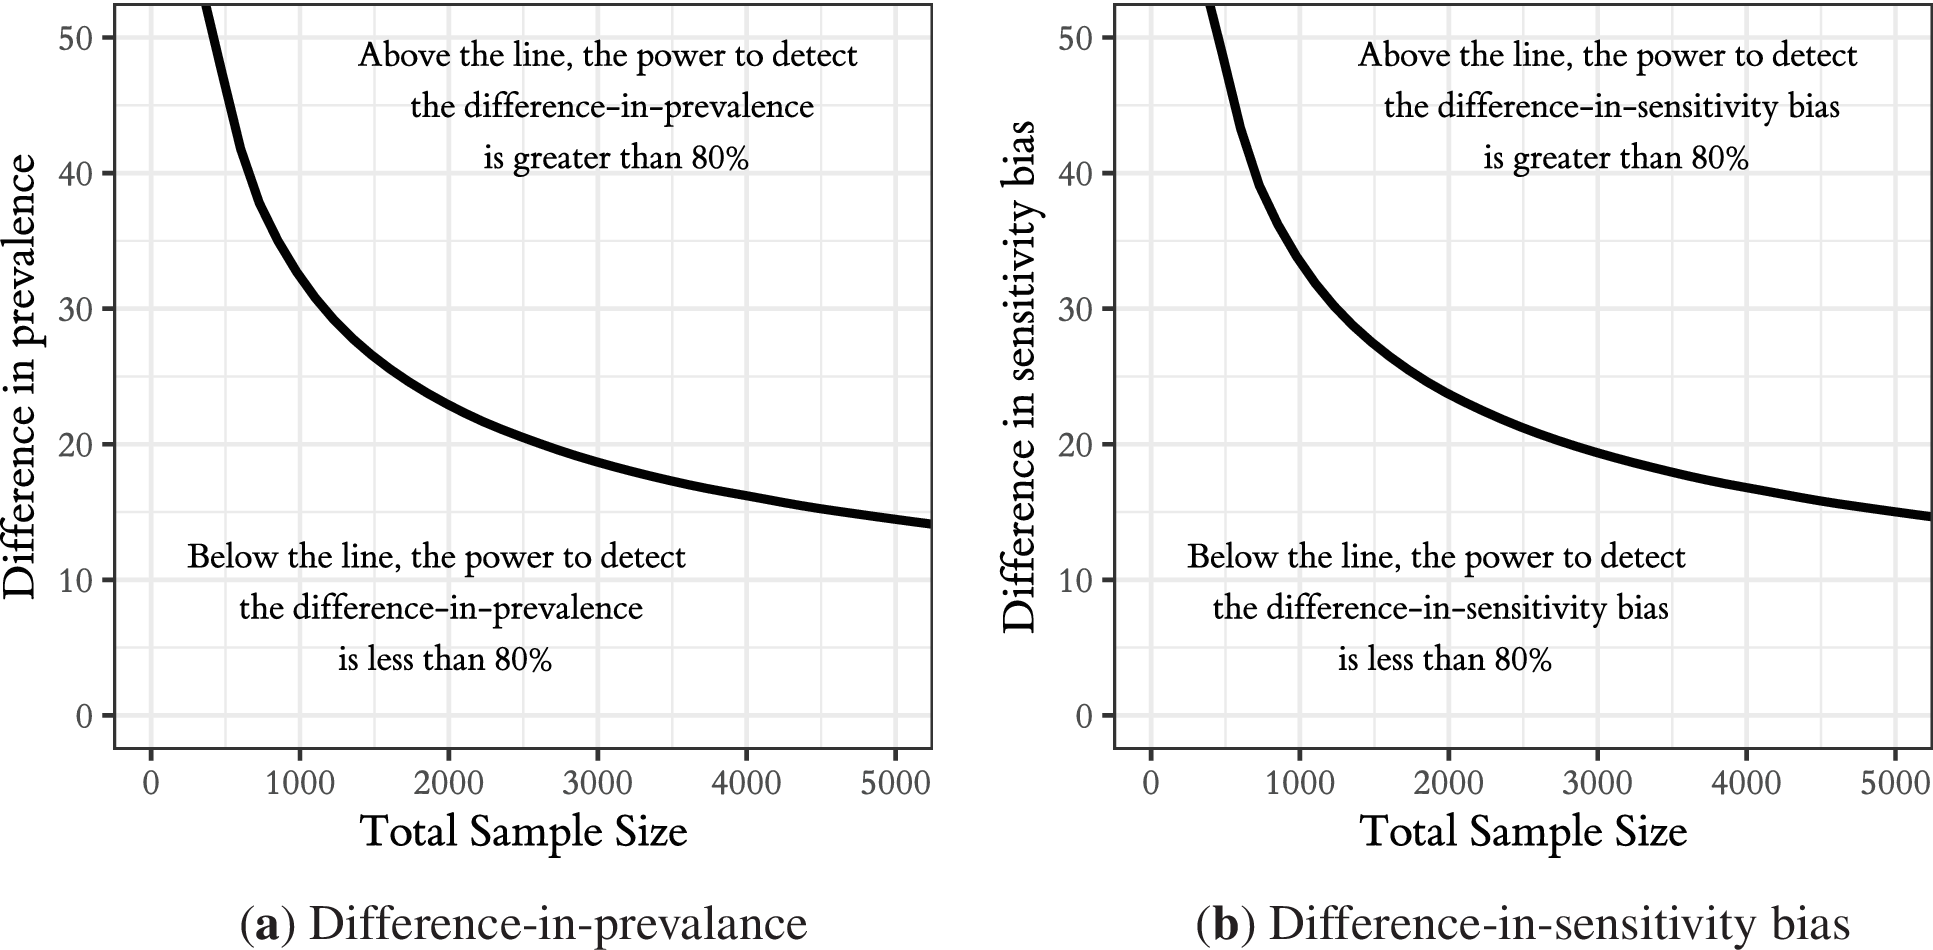
Figure 3. Power to Detect Differences in Prevalence Rates or Differences in Sensitivity Bias between Groups is Low Except When the Difference or the Sample Size is Very Large
Some studies hypothesize not differences in the prevalence rates across subgroups but rather differences in sensitivity bias. For example, Lax, Phillips, and Stollwerk (Reference Lax, Phillips and Stollwerk2016) study “whether social desirability effects differ by a respondent’s partisan identification and religious affiliation,” and Kiewiet de Jonge (Reference de Jonge and Chad2015) studies how sensitivity bias varies by income level. As panel (b) of Figure 3 shows, such tests are also quite sample hungry.
Improving the Power of the List Experiment Design
After introducing the technique, Judith Droitcour Miller wrote in her 1984 dissertation that “the variance of the item-count estimator is potentially high” (67). She noted that the loss of power comes from aggregating the sensitive item with other items and measuring only the count and the fact that “reports of deviant behavior are collected from only half of the total sample” (57). She laid out a series of practical suggestions for constructing the lists and alternative designs to reduce the variance. Many of these ideas have been taken up by survey methodologists in the decades since. In this section, we describe each modification in terms of the effective sample size improvement over the standard design, allowing a direct comparison of designs using a common metric.Footnote 10
Just after introducing the standard design, Miller (Reference Miller1984) proposed the double list experiment design, in which all subjects participate in two list experiments with different control items but the same sensitive item (see also Droitcour et al. Reference Droitcour, Caspar, Hubbard, Parsley, Visscher, Ezzati, Biemer, Groves, Lyberg, Mathiowetz and Sudman1991; Glynn Reference Glynn2013). Subjects are randomly assigned to see the treatment list in one experiment but not the other; the combined estimate has approximately 50% the variability of the equivalent single list experiment.
Miller (Reference Miller1984) offers detailed guidance on selecting control items to reduce the variance of the list experiment. These include trading off the length of the lists with privacy protection, selecting some low- and some high-prevalence items to avoid many respondents answering at the floor (“no” to all items) or ceiling (“yes” to all items), inducing negative correlation across items within the list, and inducing positive correlation between the two lists in a double list design (68–70). These list design tips are further explored in more recent methodological work (Blair and Imai Reference Blair and Imai2012; Glynn Reference Glynn2013).
Other scholars have introduced methods for combining list experiments with other sources of information. Blair, Imai, and Lyall (Reference Gonzalez-Ocantos, de Jonge, Meléndez, Osorio and Nickerson2014) proposes a combined list and endorsement experiment that succeeded in reducing variance by 12%. Aronow et al. (Reference Aronow, Coppock, Crawford and Green2015) derive a method for combining list and direct questions by conducting a list experiment among those subjects who do not directly admit to the sensitive trait. In their applications, the combined estimator decreased variance by 12% to 50%. Chou, Imai, and Rosenfeld (Reference Chou, Imai and Rosenfeld2018) provide a generalization of Aronow et al. (Reference Aronow, Coppock, Crawford and Green2015) to any subgroup among whom the true prevalence rate is known. In their application to support for an antiabortion ballot measure, auxiliary information in the form of known vote totals reduced the variance of the list experiment by 88%.
Model-based methods to reduce the variance of the list experiment include the linear regression, nonlinear least squares, and maximum-likelihood models proposed in Imai (Reference Imai2011). Maximum likelihood models have also been proposed for the LISTIT design (Blair and Imai Reference Blair and Imai2012; Corstange Reference Corstange2009).Footnote 11Table 3 shows how each of these methods help to decrease variance and increase effective sample sizes. The feasibility of each improvement will vary depending on the application; sometimes unavoidable features of the setting will cause violations of the specific assumptions invoked by each design.
Table 3. Variance Reductions and Increases in Effective Sample Size from Alternative List Experiment Designs

Table 3 can be used in conjunction with Figures 2 or 3 to guide sample size decisions for list experiments that employ these alternative designs. At a given nominal sample size, we can look up what the effective sample size will be and then reference the figures to determine whether a list experiment is an appropriate measurement tool for a given research scenario.
Meta-Analysis Research Design
In this section, we present a meta-analysis of list experiments to characterize the level of sensitivity bias in four political science literatures: turnout; prejudice based on race, religion, and sexual orientation; vote buying; and political attitudes in authoritarian contexts. To do so, we compare responses to questions asked directly and in a list experiment. Within each research literature, we present the empirical distribution of estimated bias and summarize this distribution using random-effects meta-analysis.Footnote 12 We use this evidence to assess where each research area falls on the bias-variance trade-off. These estimates can be used to help researchers make context-specific decisions about survey question designs.
We attempted a census of all list experiments ever conducted, published or otherwise, as of December 31, 2017. We certainly failed in this task. At a minimum, colleagues have told us of list experiments that were never written up and whose data are long since lost. We searched Google Scholar, SSRN, Dataverse, and seven years of political science conference programs with the search terms “list experiment,” “item count technique,” and “unmatched count technique,” and their abbreviations. In addition, we traced citations from several influential early papers on list experiments, including Judith Droitcour Miller’s dissertation which introduced the technique and from each of the studies identified in our keyword searches. Our search yielded 487 distinct experiments in 154 separate papers. We were able to obtain both direct question and list experiment estimates in 285 cases. We limit all analyses to the 264 (92 papers) list experiments whose sensitive item was predicted by the researchers to be over- or underreported, excluding non-sensitive topics.
We gathered statistical information about the list experiments using a cascading data collection approach. In the best case, we obtained the replication dataset from online journal appendices, Dataverse, authors’ personal websites, or private communication. When replication data were not available, we searched the paper for crosstabs of list experiment responses by treatment condition (similar to Table 2). For those studies, we calculated the difference-in-means estimate of prevalence and its standard error. Finally, if neither the data nor the crosstab were available, we searched the paper for the estimated prevalence rate and its standard error. In the rare case that a study reported a prevalence rate estimate but no standard error, we imputed our best guess based on a flexible regression model.
Publication bias arising from the file-drawer problem has, anecdotally, been a concern in the list experiment literature. In the course of our data collection, we heard from many scholars who claimed to have “not found anything” when using a list experiment and so chose not to pursue publication. Our main approach to this problem was to energetically seek out published and unpublished studies. Nevertheless, we are sure that we have missed some studies that were conducted but for whatever reason were never written up. Reasoning about the influence of selection into our meta-analysis is complex for at least two reasons. First, many studies had multiple inferential goals (estimating a prevalence rate, demonstrating the existence of sensitivity bias, measuring group differences in prevalence rates, or some combination of these) and it was not obvious which, if any, was the primary driver of publication incentives. For this reason, we do not present diagnostics such as funnel plots or p-curves. Funnel plots require a common quantity of interest thought to be subject to the publication filter and p-curves require a common theoretical null distribution of p-values. Secondly, it is not always clear which result—null or significant—is theoretically congenial in a given setting. Some theories predict the absence of sensitivity bias (e.g., Coppock Reference Coppock2017) while others predict its presence (e.g., Gonzalez-Ocantos et al. Reference Gonzalez-Ocantos, de Jonge, Meléndez, Osorio and Nickerson2012), so intuiting how the file-drawer problem may distort our meta-analysis is challenging.
The direct question estimates of prevalence all come from the original authors. The majority of studies asked the direct question to either their entire sample or a random subset; three of our studies referred to a direct question estimate obtained by others. We logged whichever direct question estimate was reported by the original authors. We elected not to independently obtain direct question prevalence estimates (e.g., from publicly available surveys), as such discretion could lead to the perception that we were seeking to obtain a pattern either favorable or unfavorable to list experiments. We acknowledge that relying on original authors for direct question estimates introduces a second source of selection in addition to publication bias.
Our measure of sensitivity bias is the difference between the list and direct estimates. We estimated the standard error of the difference as  $$ \mathrm{SE}\left(\mathrm{difference}\right)=\sqrt{\mathrm{SE}{\left(\mathrm{list}\right)}^2+\mathrm{SE}{\left(\mathrm{direct}\right)}^2} $$. This formula assumes that the direct and list estimates are independent; this assumption will be mildly violated if both the direct and list estimates are calculated using data from the same respondents. Under the assumption that direct and list estimates are positively correlated, our naive estimates of sampling variability are conservative by the properties of the variance of the difference in two random variables. We calculated a 95% confidence interval for the difference under a normal approximation.
We first categorized studies by substantive domain, then by the expected direction of sensitivity bias: overreporting or underreporting. Wherever possible, we relied on the logics of misreporting forwarded by the original authors and in rare cases had to substitute our own best judgment. Theoretically speaking, the direction of sensitivity bias need not be constant across respondents (Lax, Phillips, and Stollwerk Reference Lax, Phillips and Stollwerk2016), though in the vast majority of the empirical papers we reviewed, the bias was presumed to have the same sign (if not the same magnitude) for all subjects.Footnote 13
To summarize the distribution of estimated differences, we implement a standard random-effects meta-analysis model (DerSimonian and Laird Reference DerSimonian and Laird1986). We model observed differences  $$ y $$ between list and direct with a normal distribution:
  $$ y\sim \mathbf{\mathcal{N}}\left(\delta, \sigma \right) $$ where
  $$ \sigma $$ is the observed standard error and
  $$ \delta $$ represents the true sensitivity bias for a given study. We model bias as
  $$ \delta \sim \mathbf{\mathcal{N}}\left(\mu, \tau \right) $$. The parameters of this distribution are
  $$ \mu $$, the grand mean of sensitivity bias, and
  $$ \tau $$, the standard deviation of true effect sizes. We conduct Bayesian estimation using Stan (Carpenter et al. Reference Carpenter, Gelman, Hoffman, Lee, Goodrich, Betancourt, Brubaker, Guo, Li and Riddell2017), adopting the default improper uniform priors for
  $$ \delta $$,
  $$ \mu $$, and
  $$ \tau $$ and restricting
  $$ \tau $$ to be non-negative. We assess convergence by running four parallel chains and using the standard R-hat criterion. We calculate several quantities of interest from this model. First, we estimate the average amount of sensitivity bias (
 $$ \mu $$), its standard error and 95% credible interval. Second, we estimate the distribution of sensitivity bias, not just its mean, since the true level of bias could vary across context and topic. We calculate predictive intervals that bracket our best posterior guesses of the middle 50% and 95% of the distribution of true sensitivity biases. These ranges help us to characterize what the corpus of list experiments conducted to date teaches us about typical levels of sensitivity bias across contexts.
In order to interpret the difference between list experiments and direct questions as a measure of sensitivity bias, we make several auxiliary assumptions in addition to the standard assumptions of the list experiment. We assume no differential nonresponse between questions. We assume there are no order effects. We assume that differences in question wording of the sensitive item do not affect responses. Finally, we assume that the list experiment and direct question were asked of the same sample or of two samples from the same population. If these additional assumptions are violated, the difference is still meaningful, but the difference itself can no longer be considered an estimate of sensitivity bias. If readers are unwilling to make these auxiliary assumptions, then our meta-analysis is still of use as a summary of how much the two measurement technologies differ.
Meta-Analysis Results
We present three sets of results. First, we summarize the estimated level of sensitivity bias in the four research literatures discussed above: vote buying; voter turnout; prejudice based on race, religion, and sexual orientation; and support for authoritarian regimes. We present the study-level estimates, the meta-analysis estimate, and the predictive interval in each case. Second, we analyze all studies for which we have sufficient information according to whether authors predicted sensitivity bias in the form of overreporting or underreporting. These two analyses allow us to answer the question of whether we should worry about sensitivity bias in a given research context. Third, we integrate our empirical results with the design advice given above to describe where the typical study appears to fall on the bias-variance trade-off, allowing us to answer the question of whether list experiments or direct questions are a better choice in a specific research scenario. We present our full results in Figure 4 and summarize them in Table 4.

Figure 4. Sensitivity Bias in Four Political Science Research Literatures
Table 4. Meta-analysis Estimates of Sensitivity Bias

Note: We include all studies for which we can estimate the sensitivity bias in the meta-analytic estimates for overreporting and for underreporting. We do not break out studies for other categories, which all have fewer than three studies.
Sensitivity Bias in Four Political Science Literatures
Clientelism in Developing Countries
We begin our summary of results with the literature on clientelism. Across 19 studies, we find evidence of moderate underreporting of vote buying. We display this result in Figure 4a, which we walk through in detail for this first example.Footnote 14 The top panel of the subfigure presents the estimated level of sensitivity bias for each study (black points), calculated by subtracting the list experiment estimate from the direct question estimate. Under the assumptions laid out above, negative values indicate that the list experiment recovered a higher prevalence rate than the direct question, revealing underreporting due to sensitivity bias. For example, in the top row of Figure 4a, sensitivity bias is estimated to be 5 percentage points (95% CI –3 to +14) based on a 2010 survey conducted in Bolivia in which the sensitive question read “They gave you a gift or did you a favor” (Kiewiet de Jonge Reference de Jonge and Chad2015). The size of the plotted points is proportional to the weight the study is accorded in the meta-analysis.Footnote 15 The size of the point represents how informative the study is, which is also reflected in the width of the confidence interval: the wider the confidence interval, the smaller the point.
We present two summaries of these estimates of sensitivity bias in the bottom panel. In the top row is the estimated average sensitivity bias across studies for vote-buying questions (black diamond), –8 points with a 95% credible interval stretching from –13 to –3 points. This is our best guess of the level of sensitivity bias that would be found in future studies absent additional contextual information. As is clear from the dispersion of the study-level estimates that range from –24 points to +5 points, the sensitivity bias attending to vote-buying questions differs from context to context. In the bottom row of Figure 4a, we show the 50% predictive interval from –14 to –2 points and the 95% predictive interval from –27 to +10 points. These intervals are different from confidence intervals in that they describe our best guess about the distribution of sensitivity biases in vote-buying questions and not our uncertainty about the average level of bias. In summary, the theoretical prediction of underreporting bias in direct questions about vote buying is supported on average, but there is also a considerable range of bias from very large to none at all.
Voter Turnout
Consistent with theory and the evidence from explicit validation studies, our posterior estimate based on 10 studies is that voter turnout is overreported by +7 percentage points, but the confidence interval on the meta-analytic average crosses zero. This uncertainty is also reflected in the very wide predictive intervals: the 50% interval is 13 points wide and the 95% interval is 45 points wide. We interpret this evidence to indicate that at most a small proportion of the measurement error that others have documented by comparing survey responses to validated turnout records from the voter file is due to sensitivity bias, as opposed to memory or recall failures.
Prejudice
After the study of drug use (Miller Reference Miller1984), one of the earliest uses of the list experiment was the study of prejudice, specifically prejudice based on race (Sniderman, Tetlock, and Piazza Reference Sniderman, Tetlock and Piazza1991). Since then, list experiments have been used to study prejudice towards many subgroups within society. We measure sensitivity bias in three domains: prejudice based on race, religion, and sexual orientation.Footnote 16 Contrary to expectations, we find relatively little evidence of bias, at least for the specific set of direct questions that have been tested. We were frankly quite surprised at the low levels of sensitivity bias we estimated for all three forms of prejudice.
For questions about racial prejudice, our summary guess is that if anything, subjects overreport racist attitudes by approximately 4 points (95% CI –3 to +9). Over the nine studies in our sample, therefore, the difference between direct questions and list experiments is not statistically significant. The 50% predictive interval reaches from +1 to +7 points, but the 95% predictive interval admits large negative biases (–16 points) to large positive biases up to 16 points. Our analysis does include the 1994 Multi-Investigator Study (Sniderman, Brady, and Tetlock Reference Sniderman, Brady and Tetlock1994), which estimated underreporting on the scale of –10 percentage points for policy attitude questions but +10 percentage points for non-policy attitudes like interracial dating and a black family moving in next door. Our interpretation is either that the list experiment does not provide the cover it is designed to provide in this context or that respondents actually do hold their reported views (at least on the narrow attitudes measured by these direct questions). We also note that the extreme variability of the list experiment discussed above, even when tamed somewhat through meta-analysis, holds us back from drawing strong conclusions here.
Our meta-analysis again renders a null result for sensitivity bias on questions about religious prejudice. On average, we estimate a –1 point underreporting bias in direct questions thought to be prone to underreporting bias. This estimate is in the expected direction, but the credible interval is 13 points wide and includes zero. The expected range of true effects is on par with the other prejudice-related sensitivity bias estimates. Biases on the order of approximately five points are consistent with the set of studies in our meta-analysis.
Our set of studies includes two kinds of questions that measure attitudes towards gays and lesbians. For questions thought to be subject to overreporting, the average estimate of sensitivity bias is –2 percentage points; for underreporting, the estimate is +2 percentage points. These estimates both have an unexpected sign relative to the predictions and are not distinguishable from zero. The range of plausible sensitivity biases in this literature is on the scale of 5 to 10 points.
Support for Authoritarian Regimes
Finally, we do find evidence of substantial sensitivity bias when respondents are asked about support for authoritarian regimes and their leaders. Estimates of overreporting range up to a maximum of +43 points when overreporting is predicted (Kalinin Reference Kalinin2015) and a minimum of –45 points when underreporting is predicted (Weghorst Reference Weghorst2015). Based on 21 studies, our meta-analysis estimate of the average level for studies in which overreporting is predicted is +14 points and the 50% predictive interval suggests a likely level of sensitivity bias between +4 to +24 points. When underreporting is predicted, the meta-analysis average based on 13 studies is –8 points, with a 50% credible interval between –16 and 0 points. Support for authoritarian regimes is an area where our data suggest there is considerable risk of sensitivity bias. These results are consonant with cross-country comparisons of survey nonresponse rates (Shen and Truex Reference Shen and Truex2019). As we discussed in the theory section, the risks to responding to surveys in authoritarian contexts—especially on questions about politics and the regime itself—go far beyond the desire to please the interviewer. The regime is a relevant social referent and the costs range up to imprisonment or disappearance.
Empirical Distribution of Sensitivity Bias and Sample Size
Our final set of results uses the empirical distribution of sensitivity bias as a means to gauge the extent to which list experiments conducted to date are sufficiently large. We return to two of the main goals of list experimentation: achieving a better RMSE or demonstrating the existence of sensitivity bias.
Figure 5 shows that many list experiments are simply too small. Below the lower curve (98 of 264 studies), it is likely that direct questioning would have produced answers closer to the truth (in RMSE terms) than the list experiments. Between the two curves (107 studies), the choice between list experiments and the direct question depends on the goal of the research. These list experiments are large enough to produce lower RMSE than the direct question, but they are not large enough to reliably demonstrate the existence of sensitivity bias. The studies that are above both curves (59 studies) are large enough such that the list experiment is preferred for either purpose.
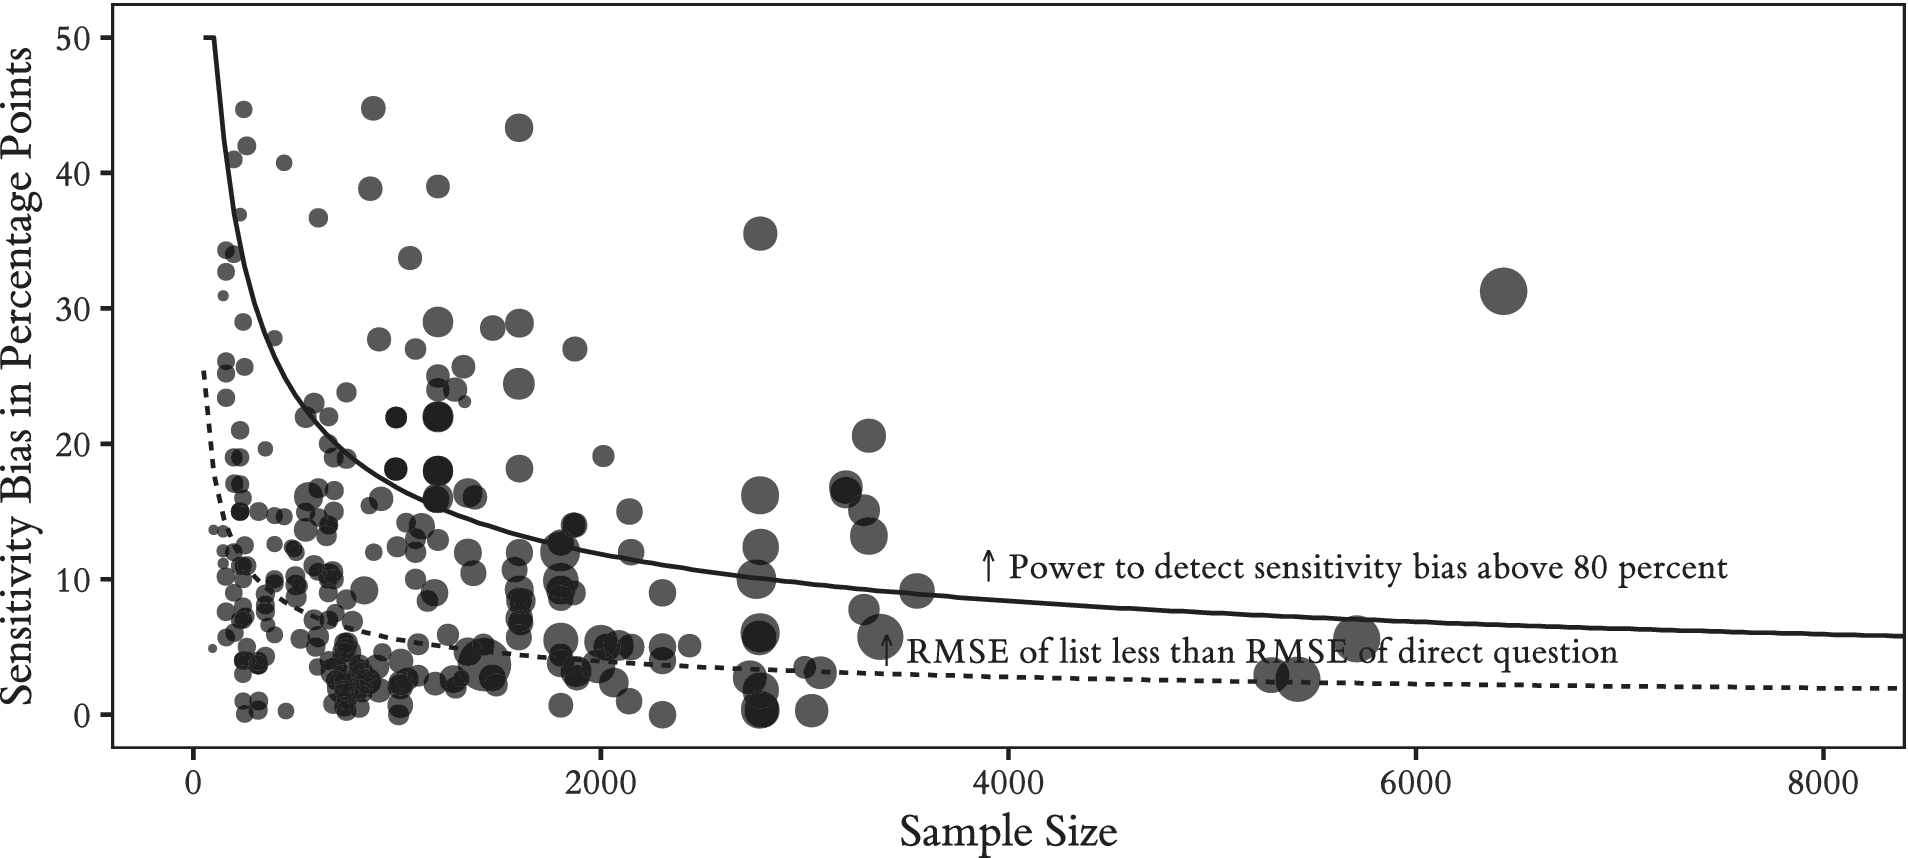
Figure 5. Many Studies of Sensitive Topics Are Smaller than Sample Sizes Recommended Based on Power or Root-Mean-Square Error Trade-offs
We emphasize that the indifference curves between list experiments and direct questions included in Figure 5 assume the standard list experiment design. The true position of each study relative to indifference between the two designs is better represented by its effective sample size, adjusting for any improvements to list experiment design and analysis implemented in that study.
Summary of Empirical Results
Is sensitivity bias likely to be a problem? Perhaps unsurprisingly given the huge range of questions that have been investigated using list experiments over the past three decades, the answer is, “it depends.” Subjects substantially overreport support for authoritarian regimes, underreport opposition to them, and underreport vote buying. We find suggestive evidence of overreporting of voter turnout. Surprisingly to us, subjects appear to honestly report their prejudices based on race, religion, and sexual orientation.
Our meta-analysis faces some important limitations. First and foremost, this is not a validation study since for most topics, we do not have access to the true prevalence rate. Indeed, this lack is what occasions the reliance on survey estimates of prevalence in the first place. The interpretation of the meta-analytic results depends on the assumptions one is willing to make. If the list experiment assumptions (no liars and no design effects) hold, we can interpret the estimated differences between direct and list responses as an estimate of sensitivity bias. If these assumptions do not hold, the difference between list and direct estimates simply represents the difference in the answer obtained depending on which measurement technology is used.Footnote 17 This quantity is still important to learn because applied researchers are faced with the choice of asking directly or using another method. Our estimates can help guide those choices even if the meta-estimates do not represent unbiased estimates of sensitivity bias per se.
Another limitation concerns the variability of the list experiment. The power of the list experiment to detect moderate sensitivity bias is low, so our conclusion of limited bias in most direct measures may be an instance of “accepting the null” of no bias. The more cautious interpretation is that we can rule out average biases as large as 10 or 15 percentage points in most cases. Biases on this order are of course very meaningful, but also difficult to detect with list experiments. The posterior predictive intervals are wide, which indicates that the biases in some contexts could be much larger than the average bias, which may justify the use of list experiments.
Despite the reasonable concern that the list experiment assumptions are unlikely to hold in at least some contexts, the technology appears to perform well. In the 166 list experiments for which we have sufficient information, 160 pass the design-effects test described in Blair and Imai (Reference Blair and Imai2012). However, we highlight an important limitation of our meta-analysis search: we are likely to miss list experiments for which the design assumptions are violated because of publication bias or authors’ reluctance to share estimates from procedures whose identifying assumptions are not met. If there is a large body of these failed studies, our conclusions about the performance of the list experiment in general might differ.
Discussion
Survey research designs rely on asking respondents for self-reports of political attitudes, beliefs, and behaviors. When respondents refuse to respond, or answer but misreport, the conclusions from survey data will be biased. In this paper, we set out to answer two questions: how much of a problem is sensitivity bias, and what can be done about it?
With respect to the first question, we think researchers should consider four criteria when deciding whether to worry about the problem:
1. Is there a social referent respondents have in mind when answering?
2. Do respondents believe the social referent can infer their answers exactly or approximately?
3. Do respondents perceive that the social referent prefers a particular answer to the question?
4. Do respondents believe they (or others) will suffer costs if that preferred response is not provided?
If the answer to any of these questions is “no,” then sensitivity bias may not be a meaningful source of measurement error. Researchers may be uncertain as to the answer to each of these questions, in which case care, caution, and further research are of course still warranted.
With respect to what researchers should do about sensitivity bias, the choice between list experiments and direct questions largely amounts to a bias-variance trade-off. Under typical conditions, list experiments are approximately 14 times noisier than direct questions, which means that either the sample size or the amount of bias needs to be large in order to justify a list experiment. That said, ensuring the safety of participants and research staff may be well worth the loss of precision that comes from list experiments.
Beyond the list experiment, many techniques have been proposed to mitigate sensitivity bias, and the social reference theory helps us to consider these alternative measurement procedures in a common framework. They largely fall into two types. The first set combines responses with random noise in order to change respondent beliefs about which social referents can infer their responses exactly or approximately. This set includes the list experiment, the randomized response technique, the unrelated question technique, and the crosswise technique. These methods obscure responses from both interviewers and bystanders at the time of the survey and also from later data consumers including researchers and state authorities. If these are the social referents respondents are concerned about, these methods will reduce sensitivity bias.
The second set of techniques changes the social context in which the sensitive question is asked to separate the response from the identity of the respondent temporarily. Most simply, researchers have implemented secret ballots during surveys to measure vote choice or turnout (Bishop and Fisher Reference Bishop and Fisher1995), physical barriers between respondents and interviewers (Beber, Roessler, and Scacco Reference Beber, Roessler and Scacco2014; Scacco Reference Scacco2012), and prerecorded questionnaires played through headphones with item order randomized (Chauchard Reference Chauchard2013). Self-administered surveys and interactive voice response surveys (i.e., with no interviewer involved at all) are often deployed for sensitive surveys for similar reasons. These procedures only obscure responses temporarily, preventing bystanders and in some cases interviewers from linking participants with their responses, though researchers and state authorities can often later reconnect responses to identifying information.Footnote 18 When interviewers or bystanders are the primary social referents respondents worry about, these methods will reduce sensitivity bias as well.
Our research design advice can also guide decision making between these techniques. All of the techniques that reduce sensitivity bias by adding noise will exhibit a bias-variance trade-off similar to the one we described for the list experiment. By design, the other information (random noise or unrelated items) reduces precision compared with the direct question. The techniques that temporarily separate respondents and responses do not typically face a bias-variance trade-off: they decrease bias without incurring variance penalties. When these techniques can be ethically and logistically deployed (and when the interviewer or bystanders are the primary concern of respondents) they may be the best choice to address sensitivity bias.
In this paper, we have focused on survey measurement of behaviors as well as explicit attitudes and beliefs. Techniques like the implicit association test (Greenwald, McGhee, and Schwartz Reference Greenwald, McGhee and Schwartz1998) and the affect misattribution procedure (Payne et al. Reference Payne, Cheng, Govorun and Stewart2005), by contrast, target implicit attitudes. These measures are plausibly free from sensitivity bias, since responses are difficult to consciously misrepresent even if respondents would prefer to hide their views (Nosek Reference Nosek2007, though see Skorinko and Sinclair Reference Skorinko and Sinclair2018). Nevertheless, a foundational assumption in the implicit attitudes literature is that implicit and explicit attitudes are fundamentally different constructs. By switching from direct measures of explicit attitudes to indirect measures of implicit attitudes, we may have purged our estimates of sensitivity bias, but we have also changed the research question. This switch is of course appropriate when implicit attitudes are indeed the theoretical target of interest.
We have shown that sensitivity bias is a very real concern for survey research, but it varies considerably by context and by topic in sometimes surprising ways. In some literatures, we find little to no evidence of sensitivity bias, and in others it is quite sizable. We hope researchers will carefully consider the likely magnitude of sensitivity biases using the four sensitivity criteria before turning to the list experiment or similar techniques, mainly because they are so variable that achieving sufficient precision can be costly. Surveys may also be substantially improved by less expensive changes to survey administration that can reduce bias without increasing variance. When list experiments or similar methods are selected, they should be conducted only with large samples or when biases are expected to be substantial.
Supplementary Materials
To view supplementary material for this article, please visit http://dx.doi.org/10.1017/S0003055420000374.Replication materials can be found on Dataverse at: https://doi.org/10.7910/DVN/YUXHZT.


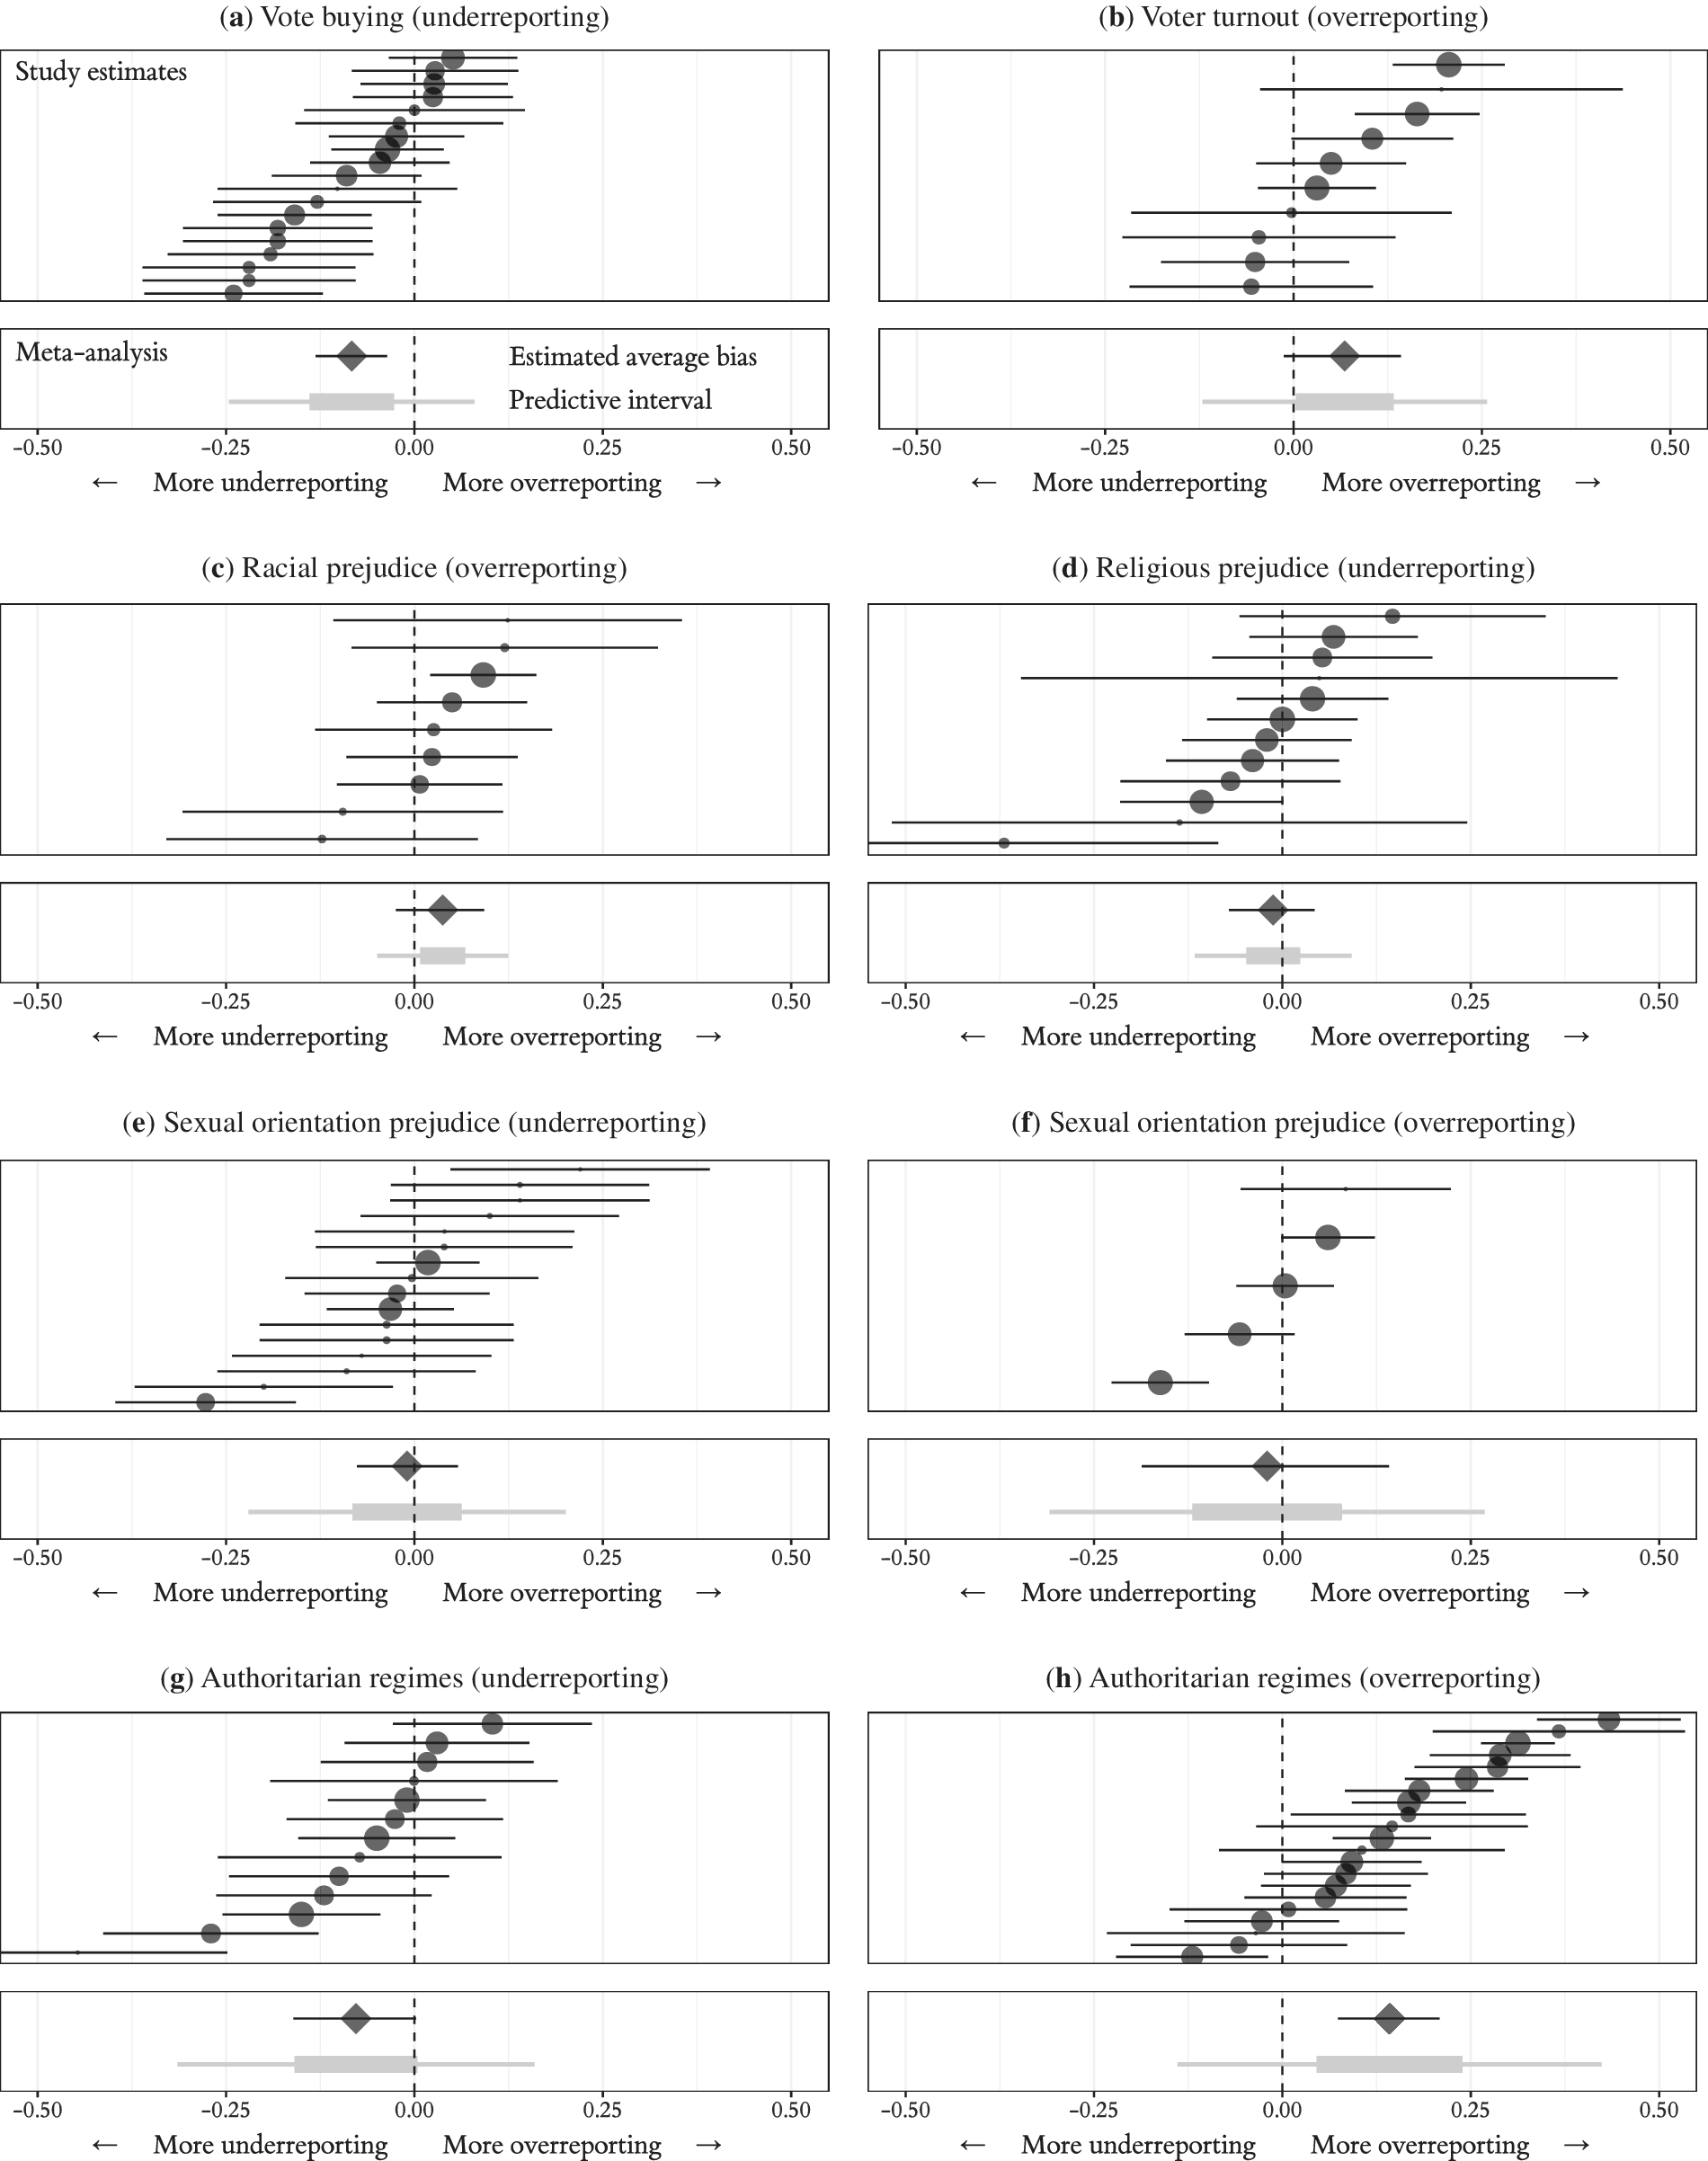


 Open access
Comments
No Comments have been published for this article.