


Introduction
Mass-balance modelling is a crucial step in modelling the response of glaciers to future climate change and their contribution to future sea-level rise. Such models generally fall into two categories: energy-balance (Reference HockHock, 2005) and empirical temperature-index models (Reference HockHock, 2003). The former are physically based, estimating melt as the residual in the energy-balance equation, but they require detailed data input. Conversely, temperature-index models have low data requirements, but they lack a rigorous physical basis. It also remains unclear as to how the empirical relationship between air temperature and melt holds under different climate conditions. Both principal approaches have been used as the basis for estimating mass-balance sensitivities and the contributions of glacier decline to future sea-level rise (e.g. Reference de Woul and Hockde Woul and Hock, 2005; Reference OerlemansOerlemans and others, 2005; Reference Raper and BraithwaiteRaper and Braithwaite, 2006), but a fundamental question is how far results are affected by the choice of the mass-balance model under otherwise identical conditions.
The purpose of this study is a model intercomparison in order to investigate the sensitivity of mass-balance projections to the choice of the mass-balance model. We apply five different mass-balance models of varying complexity to Storglaciären, a well-investigated glacier in northern Sweden (67˚55' N, 18˚35' E), forcing the models by daily European Centre for Medium-Range Weather Forecasts re-analysis (ERA-40) data. The calibrated models are then used to compute the static mass-balance sensitivities to a 1 K warming and a 10% precipitation increase, and to compute the cumulative mass-balance evolution until 2100 based on downscaled temperature output from a regional climate model.
Data
Mass balance
Storglaciären has the longest detailed and continuous mass-balance record in the world (Reference Holmlund, Jansson and PetterssonHolmlund and others, 2005) including separate winter and summer mass balances. The glacier’s area has remained roughly constant for the last 30 years (~3.1 km2). We use the recalculated and updated mass-balance series by Reference HulthHulth (2006 and unpublished data). Mean winter, summer and net mass balances over the 21 year calibration period (1981–2001) are 1.62, –1.54 and 0.08 ma–1w.e., respectively.
ERA-40 re-analysis
All models were calibrated using daily ERA-40 re-analysis data (Reference Simmons and GibsonSimmons and Gibson, 2000) using the data for the roughly 50 ×50km gridcell containing the glacier. ERA-40 data comprise a dynamically consistent three-dimensional gridded dataset that is derived from a numerical weather-forecast model combined with meteorological observations and data from satellites for the period mid-1957 to mid-2002. We restrict our model calibration to the mass-balance years 1980/81 to 2000/01 since the accuracy of ERA-40 data improved from 1979 due to inclusion of satellite observations in the analysis (Reference SimmonsSimmons and others, 2004).
We retrieved daily data of 2m air temperature and relative humidity, precipitation, 10m wind speed and global radiation (shortwave incoming radiation). Reference Radić and HockRadić and Hock (2006) compared ERA-40 temperature and precipitation data with observations in the Storglaciären region and found generally good correlation; in particular, interannual variability, which is crucial for the mass-balance modelling, is captured well. Since ERA-40 temperatures refer to the mean gridcell elevation of 623 ma.s.l., considerably lower than the elevation range of the glacier (1140–1730ma.s.l.), daily ERA-40 temperatures were downscaled to the approximate average elevation of the equilibrium line (1460ma.s.l.) according to a model-specific constant statistical temperature lapse rate (±ERA in Table 1) obtained from calibration of each of the models. It is emphasized that this lapse rate includes temperature variations with elevation, horizontal distance and model bias. Systematic biases between ERA-40 precipitation data and observations (Reference Radić and HockRadić and Hock, 2006) are dealt with in different ways depending on the model type (see below). We use ERA-40 relative humidity and global radiation data unaltered, since comparison with data collected during the 1998–2002 glacio-meteorological campaign on Storglaciären (Reference Jonsell, Hock and HolmgrenJonsell and others, 2003) indicated a lack of systematic biases. Daily 10m ERA-40 wind speed was computed as the arithmetic average of 6 hourly instantaneous values. These data show systematic underestimation compared to daily mean wind speeds measured at 2 m above the surface. We corrected for this difference based on linear regression between daily values of ERA-40 data and the observations in order to downscale the 10m ERA-40 data to the 2 m wind speeds on the glacier required as input in the energy-balance modelling.
Table 1. Tuned model parameters for five mass-balance models, coefficients of determination (r 2) for correlation between modelled and measured area-averaged winter (b w), summer (b s) and net (b n) mass balances, static mass-balance sensitivities (MBS) to a 1 K temperature and a 10% precipitation increase, and cumulative mass balances (Cum b n) until the year 2100. T, P, G, RH and u are air temperature (˚C), precipitation (mm d–1), global radiation (Wm–2), relative humidity (%) and wind speed (m s–1), respectively. ΓERA is the lapse rate (K (100 m)–1) to correct for the bias between ERA-40 air temperatures and near-surface temperatures at equilibrium-line altitude (1460ma.s.l.). ΓΓl is the lapse rate (K (100 m)–1) to extrapolate the downscaled ERA-40 temperatures across the glacier. T0 r/ s is the threshold temperature (˚C) for discriminating snow and rainfall. MF (mmd–1 K–1) and rsnow/ice (mmm–2W–1 d–1 K–1) are melt and radiation parameters in Equation (3); c 0 (Wm–2 d–1) and c 1 (Wm–2 d–1K–1) are parameters in Equation (4). PCF is the precipitation correction factor (%), PG is the precipitation gradient (% per 100m elevation increase), α s, α f, α i are albedo for snow, firn and ice surfaces, respectively, and z 0 is roughness length for wind (mm)

Climate scenario
For the mass-balance projections until 2100 we use daily air-temperature data from the regional climate model RCA3 of the Rossby Centre of the Swedish Meteorological and Hydrological Institute (Reference KjellströmKjellström and others, 2005), extracting the data for the roughly 50 ×50km gridcell closest to Storglaciären. The lateral boundaries are given by output of the general circulation model ECHAM4/OPYC3, and runs are forced by the B2 emission scenario from Reference HoughtonHoughton and others (2001). RCA3 predicts a temperature rise of 2.94± 0.26 K per century. RCA3 temperature series were downscaled using ‘local scaling’ (Reference SalathéSalathé, 2005) which means that the daily RCA3 data were adjusted by the averaged monthly differences over the 1981–2001 baseline period between the RCA3 and ERA-40 temperatures (Reference Radić and HockRadić and Hock, 2006). By doing this, the average bias between the RCA3 and ERA-40 temperatures is corrected for.
For precipitation, relative humidity, wind speed and global radiation, we assume no future changes and simply replicate the 20 year ERA-40 data series from 1981 to 2000 to represent the conditions from 2001 to 2100 based on the following considerations. First, in contrast to air temperature, these variables have received far less scrutiny in terms of downscaling, and future trends appear less conclusive. Second, we focus on the sensitivity of mass balance to future temperature changes only. Third, our purpose is not to provide ‘real’ mass-balance projections but rather to elucidate the sensitivity of results to the choice of the mass-balance model.
Mass-Balance Modelling
We use five mass-balance models including temperature-index and energy-balance approaches and further differing from each other in spatial discretization (zero-dimensional, elevation bands, fully distributed (grid-based)). The models are briefly outlined below in order of increasing model sophistication, and model parameters obtained from calibration (optimization) are listed in Table 1. All models are run with daily time-step.
Model 1: zero-dimensional temperature-index regression model
We use a simple degree-day approach following Reference de Woul and Hockde Woul and Hock (2005) and Reference Radić and HockRadić and Hock (2006). Summer mass balance, b s, and winter mass balance, b w, are modelled by
where Ti is air temperature (˚C) downscaled by ΓERA (Table 1). The parameters α and β are derived from linear regression between measured summer mass balances (b s) and positive degree-day sums (∑aiTi ) over the entire mass-balance year, and between measured winter mass balances (b w) and annual sums of daily precipitation (∑aiPi ) with air temperatures below the threshold temperature T0r/s which discriminates rain from snowfall.
Model 2: elevation-dependent temperature-index regression model
The model is identical to model 1, but simulates elevation-dependent mass balances. A different set of parameters (±, β) is derived for each elevation band. Hence, each 20m elevation band is treated as if it were an individual glacier with different optimized statistical lapse rates (ΓERA in Table 1).
Model 3: distributed temperature-index model including potential direct solar radiation
Melt and accumulation are computed for each gridcell of a 30×30m resolution elevation model according to Reference HockHock (1999). Melt, M (mm d–1), is modelled by multiplying positive air temperatures by a melt factor, but instead of using a constant degree-day factor, the melt factor is varied for each gridcell and every time-step as a function of daily means of potential (clear-sky) direct solar radiation, thereby incorporating topographic effects on the melt distribution:
where MF is an empirical melt factor (mm d–1 K–1) and r snow/ ice is a radiation coefficient (mmm–2W–1 d–1 K–1), different for snow and ice to account for generally larger albedo over snow than ice. Firn surfaces are treated like snow. I pot is potential direct solar radiation at the inclined glacier surface (Wm–2). T is daily ERA-40 air temperature (˚C) first downscaled by ΓERA (Table 1) to the approximate equilibrium-line altitude (1460ma.s.l.) and then extrapolated to each gridcell as a function of elevation according to a local lapse rate constant in time (Γl in Table 1). The model has successfully been applied on several glaciers (e.g. by Reference Schneeberger, Albrecht, Blatter, Wild and HockSchneeberger and others, 2001; Reference Flowers and ClarkeFlowers and Clarke, 2002; Reference SchulerSchuler and others, 2005; Reference de Woul, Hock, Braun, Thorsteinsson, Jóhannesson and Halldórsdóttirde Woul and others, 2006).
Precipitation is initially adjusted by a correction factor, PCF, to account for the bias between ERA-40 data and the conditions at the glacier surface. This precipitation referring to 1280 ma.s.l. is then assumed to vary linearly with elevation according to two precipitation gradients, PG, different for the elevation bands below and above this elevation. We chose this elevation as breakpoint since the winter balance profiles on Storglaciären generally show an increase in winter mass balance with both increasing elevation above and decreasing elevation below this elevation (Fig. 1). The latter is due to lee effects at the steep glacier front. A temperature threshold, T0r/s (˚C), is used to discriminate snow from rain precipitation. A mixture of snow and rain is assumed in a transition zone ranging from T0r/s – 1 K (100% snow) to T0r/s + 1 K (100% rain) with linear interpolation in between.

Fig. 1. Area–elevation distribution of Storglaciären (based on the 1990 map) and modelled and measured winter (b w), summer (b s) and net (b n) balance profiles averaged over the period 1980/81–2000/01. The profile for model 2 coincides with the observed profile as a consequence of the regression procedure applied.
Model 4: elevation-dependent simplified energy-balance model
We use a modified version of the model proposed by Reference OerlemansOerlemans (2001) which parameterizes the daily mean energy available for melt, QM (Wm–2), for each elevation band by
where α is albedo, Q G is global radiation (Wm–2), T is air temperature (˚C) and c 0 and c 1 are parameters obtained from optimization. The term c 0 + c 1 T represents the sum of longwave radiation balance and turbulent heat fluxes. We enhance the model by computing daily snow albedo as a function of snow depth and cumulative air temperature after last snowfall according to Reference Brock, Willis and SharpBrock and others (2000). Ice albedo is assumed constant. Modelling of refreezing is added according to Reference Woodward, Sharp and ArendtWoodward and others (1997). The melt model may be considered as an enhanced temperature-index model since only the shortwave radiation balance is considered, while the remaining energy components are lumped into a temperature dependence (Equation (4)). Snow accumulation is modelled as in model 3, but no mixture of snow and rain is allowed.
Model 5: distributed energy-balance model
The model is a slightly modified version of the fully distributed surface energy-balance model by Reference Hock and HolmgrenHock and Holmgren (2005). Data input are 2 m air temperature, relative humidity and wind speed, as well as global radiation and precipitation. The turbulent fluxes are computed using the bulk aerodynamic approach considering atmospheric stability based on Monin–Obukhov similarity theory. Direct and diffuse radiation are extrapolated separately considering topographic effects. ERA-40 global radiation is separated into the direct and diffuse components based on an empirical relationship between the ratio of diffuse to global radiation and the ratio of global to top-of-atmosphere solar radiation. Direct radiation, I, is then extrapolated to the entire grid by multiplying potential direct radiation for each gridcell (computed from solar geometry, gridcell slope, aspect and topographic shading) by the ratio of actual direct radiation, I, derived from ERA-40 and the direct radiation if conditions were cloud-free. Diffuse radiation is extrapolated by means of a sky-view-factor relationship and by considering additional diffuse radiation reflected from adjacent slopes (see Reference Hock and HolmgrenHock and Holmgren, 2005, for further details). We modified the modelling of incoming longwave radiation, L↓, by using the approach of Reference Konzelmann, van de Wal, Greuell, Bintanja, Henneken and Abe-OuchiKonzelmann and others (1994) which parameterizes L↓ in terms of water vapour pressure, air temperature and cloud amount. Parameters were developed from observations during four summer seasons on Storglaciären, and cloud amount is parameterized in terms of the ratio between global radiation and top-of-atmosphere radiation (Reference SedlarSedlar, 2006). Snow, firn and ice albedo are assigned constant values (Table 1). Snow accumulation is computed as in model 3.
Model calibration
All models were calibrated by tuning model parameters to yield maximum agreement between (1) modelled and observed area-averaged winter, summer and net mass balances and (2) modelled and observed winter, summer and net mass-balance profiles (not possible for model 1). For models 3–5, winter balances and summer balances were integrated over the periods 15 September–14 May and 15 May–14 September, respectively. Models 1 and 2 do not require a fixed date for the winter/summer transition (Equations (1) and (2)). A combination of manual optimization and the global optimization algorithm according to Reference Vrugt, Gupta, Bouten and SorooshianVrugt and others (2003) was applied for parameter tuning in order to derive the best-fit parameter sets. The set of model parameters for each model and their optimized values are summarized in Table 1.
Results and Discussion
Model performance
It was possible to tune all models so that measured mass-balance profiles were reasonably well reproduced (Fig. 1). Winter mass-balance time series (Fig. 2) were modelled well by all models (r 2 = 0.73–0.78; Table 1), indicating that ERA-40 captures interannual precipitation variability sufficiently well to be used in mass-balance modelling. Correlation statistics (Table 1) show that all temperature-index models performed considerably better (r 2 = 0.87–0.88) with respect to reproducing measured summer balances than the energy-balance models (r 2 = 0.66–0.72). This confirms that air temperature alone is a good predictor for melt (Reference OhmuraOhmura, 2001), and interannual temperature variability in this region is well reproduced by the ERA-40 re-analysis. The lower performance of the energy-balance models (Table 1; Fig. 2) may be attributed to the inability of the ERA-40 radiation, humidity and wind-speed data to represent the variability at Storglaciären. In contrast to air temperature, the available ERA-40 global radiation and humidity data are directly taken from the forecasts, and not re-analyzed, and thus not adjusted to observations (Reference Simmons and GibsonSimmons and Gibson, 2000). In addition, model 4 strongly parameterizes the energy-balance components and also neglects any topographic effects on the amount of global radiation in each elevation band, and hence may be oversimplified.

Fig. 2. Modelled and measured winter (b w), summer (b s) and net (b n) mass balance for the mass-balance years 1980/81–2000/01.
Mass-balance sensitivities
Static mass-balance sensitivities in response to a hypothetical 1 K warming range from –0.41 to –0.61ma–1 (Table 1). The lowest and highest values are obtained by the energy-balance models. The sensitivities in response to a 10% precipitation increase vary between 0.19 and 0.22 ma–1. In agreement with previous studies (Table 2), on average, the assumed precipitation increase only partially (36–49%) offsets the effects of a 1 K warming.
Table 2. Static mass-balance sensitivities to a 1 K warming and a 10% increase in precipitation reported in previous studies for Storglaciären
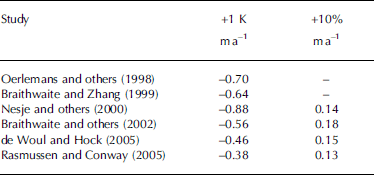
The range reported in previous studies for a 1 K warming (Table 2) is somewhat larger (–0.38 to –0.88ma–1), but differences between studies, in addition to use of different mass-balance models, can arise from differences in applied datasets, calibration periods and procedures. Any differences in mass-balance sensitivities found here are entirely due to the choice of the mass-balance model since all models are forced by the same input data and calibrated by the same procedures. This poses a problem in using mass-balance sensitivities for future glacier predictions. Mass-balance sensitivities have widely been used to estimate the contribution of glaciers to future sea-level rise. The sensitivities derived for one or a few glaciers are assumed to be representative for glacier regions, and total mass loss is obtained from multiplying mass-balance sensitivities by total glacierized area (e.g. Reference OerlemansOerlemans and others, 2005). Hence, an uncertainty in mass-balance sensitivities by a factor 1.5, as found in our case study, will add to the uncertainty in computed volume-change projections with the same magnitude.
Cumulative mass-balance projections
The cumulative net mass balances for the 100 year period until 2100 in response to the temperature changes predicted by the RCA3 regional climate model are shown in Figure 3 for all five models. It is emphasized that the predictions do not represent ‘real’ changes to be expected for Storglaciären. First, future climate changes in variables other than air temperature were neglected. Second, the glacier will decrease in size and retreat to higher elevations, which can lead to less negative mass balances as the glacier approaches a new steady state. We neglect such feedback on mass balance since we assume the glacier to remain constant in size. Hence, our mass balances are ‘reference-surface’ rather than ‘conventional’ mass balances (Reference Elsberg, Harrison, Echelmeyer and KrimmelElsberg and others, 2001; Reference Harrison, Elsberg, Cox and MarchHarrison and others, 2005), and therefore the century-scale mass loss is over-predicted. However, our approach suffices in place of a more sophisticated scheme, since our purpose is to investigate the sensitivity of mass-balance computations solely to the choice of the mass-balance model rather than to provide ‘real’ predictions.

Fig. 3. Cumulative net mass balances predicted by five mass-balance models for the mass-balance years 2001/02–2099/2100.
Cumulative mass balances by 2100 are between –81 and –92m for models 1–4, but –121m for model 5. Hence, variations are within 13% of the mean for all temperature-index models (models 1–3) and the simple elevation-dependent energy-balance model (model 4), but considerably larger for the detailed energy-balance model. Our results indicate that glacier mass loss in future glacier predictions may be under-predicted when temperature-index or highly simplified energy-balance models are used instead of detailed energy-balance models. The non-linear response of glacier mass balance to temperature changes may only be described adequately if the feedbacks on each individual component are accounted for separately according to their individual temperature dependencies.
Conclusions
We used five different mass-balance models (a zero-dimensional and an elevation-dependent temperature-index regression model, a distributed temperature-index model, as well as an elevation-dependent and a fully distributed energy-balance model) to compute static mass-balance sensitivities and cumulative glacier mass loss until 2100. Model performance did not improve with increased sophistication of the model. All models produced good estimates of measured winter mass balance (r 2 = 0.73–0.78) during the calibration period, but summer balances (and hence net balances) were modelled better by all temperature-index models (r 2 = 0.87–0.88) than the energy-balance models (r 2 = 0.66–0.72). We conclude that the elevation-dependent energy-balance model may be oversimplified and that, in contrast to air temperature and precipitation, other ERA-40 data used to force the models (such as global radiation, and in case of model 5 also wind speed and humidity) may not adequately characterize the variability of these variables in the region of Storglaciären. Further evaluation of ERA-40 global radiation, humidity and wind-speed data is needed in regions where corresponding long-term measurements are available in order to investigate their suitability for forcing energy-balance mass-balance models and to develop adequate downscaling methods.
Static mass-balance sensitivities to a 1 K warming and a 10% increase in precipitation ranged from –0.41 to –0.61ma–1 and from 0.19 to 0.22 ma–1, respectively. Hence, results differ considerably depending on the approach adopted for mass-balance modelling, indicating that the choice of the mass-balance model is a major source of uncertainty in estimation of future glacier mass loss, adding to the uncertainties in climate model predictions (Reference OerlemansOerlemans and others, 2005; Reference Radić and HockRadić and Hock, 2006) and modelling geometry changes (Reference Radić, Hock and OerlemansRadić and others, 2007). The cumulative mass balances for the 100 year period until 2100 in response to the temperature changes given by the RCA regional climate varied by 13% of the mean (–81 to –92 m) for four of the models, but the response of the fully distributed detailed energy-balance model was much larger (–121 m). This indicates that glacier mass loss in future glacier predictions may be under-predicted when temperature-index or highly simplified energy-balance models are used instead of detailed energy-balance models that account for the feedback of temperature changes on each individual energy component separately. More model intercomparisons are needed to ascertain this result.
Acknowledgements
Financial support has been provided by Formas – the Swedish Research Council for Environment, Agricultural Sciences and Spatial Planning (project No. 21.4/2003-0387) and the CE (Climate and Energy) project funded by Nordic Energy Research (NEFP). R. Hock is Royal Swedish Academy of Science Research Fellow supported by a grant from the Knut Wallenberg Foundation. We acknowledge Rossby Centrum at the Swedish Meteorological and Hydrological Institute, particularly E. Kjellström, for providing the RCA3 data, and P. Kållberg and C. Maass (ECMWF) for helping to retrieve ERA-40 data. The ERA-40 data were received from ECMWF. R. Braithwaite and an anonymous reviewer provided useful comments on the manuscript.


