


Introduction
There is general agreement that Iceland was not permanently settled until the late ninth century AD (Vésteinsson & McGovern Reference Vésteinsson and McGovern2012). Once settlement began, most habitable areas of the island were occupied within 20-60 years (Vésteinsson & Gestsdóttir Reference Vésteinsson and Gestsdóttir2016). A few decades later, in the mid 980s, a group of Icelanders established the first of what would eventually become three colonies in south-west Greenland (Edwards et al. Reference Edwards, Cook, Nyegaard and Schofield2013). Known as the Eastern Settlement, Middle Settlement and Western Settlement, these colonies were occupied for several centuries before being abandoned in the fourteenth and fifteenth centuries for reasons that continue to be debated (Arneborg Reference Arneborg, Graham-Campbell, Roesdahl and Kristiansen2015).
Though archaeological evidence of the colonisation of Iceland and Greenland is well studied, the genetic and cultural composition of the founding populations remains unresolved. Historical texts, including the twelfth-century Íslendingabók (Book of Icelanders) and Landnámabók (Book of Settlements) and several medieval sagas (Bjarnason et al. Reference Bjarnason, Bjarnason, Edwards, Friðriksson, Magnússon, Mourant and Tills1973; Pálsson Reference Pálsson, Bernhard and Kandler1974) suggest that the majority of the people who settled Iceland were of Norwegian ancestry. Morphological analysis of cranial non-metric traits of skeletons excavated from archaeological sites in Iceland and Greenland indicates that these populations included little or no genetic contribution from regions other than Norway (Steffensen Reference Steffensen1953, Reference Steffensen1975; Berry Reference Berry1974; Lynnerup Reference Lynnerup1998; Hallgrimsson et al. Reference Hallgrímsson, Donnabháin, Walters, Cooper, Guðbjartsson and Stefánsson2004; Price & Arneborg Reference Price and Arneborg2018). This finding is supported by the close affinity of mitochondrial DNA (mtDNA) sequences from Iron Age skeletons in Norway (c. 500 BC–AD 750) with those of modern-day Icelanders (Krzewińska et al. Reference Krzewińska, Bjørnstad, Skoglund, Olason, Bill, Götherström and Hagelberg2013), which is consistent with Iceland's founding population having been largely Norwegian in origin.
An alternate hypothesis proposes that the founding population of Iceland included a mix of people with ancestry from Scandinavia, along with Britain and Ireland—the latter individuals possibly taken to Iceland as thralls (i.e. unfree people) by wealthy Scandinavians (Karlsson Reference Karlsson2000; Vésteinsson Reference Vésteinsson, Sheehan and Corráin2010). DNA studies have produced results that support this hypothesis. For example, analyses of mitochondrial and Y-chromosome DNA of living present-day populations in Iceland, Scandinavia, Britain and Ireland indicate that approximately 75 per cent of the patrilineal ancestry of Icelanders derives from Scandinavia, while mtDNA from this group suggests about 60 per cent of matrilineal ancestry is from Scotland and Ireland (Helgason et al. Reference Helgason, Sigurðardóttir, Gulcher, Ward and Stefánsson2000a, Reference Helgason, Sigurðardóttir, Nicholson, Sykes, Hill, Bradley, Bosnes, Gulcher, Ward and Stefánsson2000b). Similar results were obtained in an analysis of Viking Age individuals from Iceland: approximately 72 per cent of males were most closely related to modern-day individuals from Scandinavia, while approximately 65 per cent of females were most closely related to individuals from Scotland and Ireland (Ebeneserdóttir et al. Reference Ebeneserdóttir, Sandoval-Velasco, Gundersdóttir, Jagadeesan, Guðmundsdóttir, Thordardóttir and Einarsdóttir2018). Combined analysis of nuclear and mitochondrial genomic data further shows that Viking Age individuals from Iceland and Greenland display a substantial genetic contribution from Britain and Ireland as well as Scandinavia; the Icelandic sample demonstrated approximately 38 per cent Scandinavian ancestry and 42 per cent from Britain and Ireland, and the Greenlandic sample featured substantial ancestry from Britain and Ireland as well as Scandinavia (Margaryan et al. Reference Margaryan2020).
Recently, we investigated the origins of Icelanders using a new line of evidence—the three-dimensional (3D) shape of the cranial base (Plomp et al. Reference Plomp, Gestsdóttir, Dobney, Price and Collard2021). In that study, we employed ‘geometric morphometrics’, a method used extensively by palaeoanthropologists to address comparable questions (e.g. Zichello et al. Reference Zichello, Baab, McNulty, Raxworthy and Steiper2018). We focused on the cranial base because several studies have found that the shape of this part of the cranium can be informative about relatedness among human populations (e.g. Harvati & Weaver Reference Harvati and Weaver2006; Smith Reference Smith2009; von Cramon-Taubadel Reference von Cramon-Taubadel2009). Our results suggested that in Iceland's founding population, individuals with ancestry in Britain and Ireland outnumbered those with Scandinavian ancestry (52–65% versus 31–48% respectively, Plomp et al. Reference Plomp, Gestsdóttir, Dobney, Price and Collard2021).
Given the lack of clarity regarding the composition of the population that settled Iceland and its offshoots in Greenland, further tests of the two main hypotheses are necessary. Here we build on our earlier study by comparing the 3D shapes of crania from the Eastern Settlement in Greenland with similarly dated crania from Scandinavia, as well as Britain and Ireland. Using geometric morphometrics, we estimate the proportion of ancestry within the Greenland sample that may be attributed to the genetic influence of populations from Scandinavia or from Britain and Ireland. The results build upon our previous analysis of Icelandic individuals to evaluate whether people from Britain and Ireland, including southern Britain, played a larger role in the settling of Iceland and, subsequently, Greenland than traditionally thought.
Materials and methods
The present study considers 270 crania recovered from archaeological sites in Greenland, Scandinavia, and Britain and Ireland. Only adult crania were recorded to avoid incorporating into the analyses the confounding effects of morphological differences between adult and juvenile crania. Individuals were judged to be adult based on full dental eruption and complete epiphyseal fusion, especially at the spheno-occipital synchondrosis. We did not attempt to check or revise the biological sex assigned to individuals by other researchers.
Forty of the individuals in the sample are from the Eastern Settlement in Greenland and date to between AD 1000 and 1425. It is generally agreed that there were no other cultural groups in south-west Greenland at this time (Dugmore et al. Reference Dugmore, Keller and McGovern2007), so it is assumed that all the individuals are of European ancestry.
Our Scandinavian sample comprises 64 individuals from various Iron Age (dated between 500 BC and AD 800) and Viking Age (AD 793-1066) sites in Denmark and 28 individuals from sites in southern Norway (see online supplementary material (OSM) Table S1 for more information about individual sites). Sampling was limited to southern Norway to reduce the probability of inadvertently including data from individuals of possible Sámi ancestry to comply with the ethics agreement between the authors and the University of Oslo.
Our sample from Britain and Ireland focused on individuals who pre-dated the settlement of those islands by Germanic speakers in the mid fifth century AD, in order to avoid the potentially confounding effects of admixture between local and immigrant populations. We measured a total of 138 crania from sites in England, Scotland and the Republic of Ireland. The sample includes individuals from three sites in England—Poundbury (Romano–British, c. AD 43–410) and Maiden Castle (Iron Age, c. 800 BC–AD 43) in Dorset and Hallet's Garage (Romano–British) in Kent—and various sites in Scotland, ranging in date from Neolithic (c. 4000–2000 BC) to Bronze Age (c. 2000–700 BC) and Pictish (Portmahomack, c. AD 550–800). Individuals from several sites in the Republic of Ireland, dating from the Neolithic to the Iron Age (c. 3000 BC–AD 400), are also included. Further details of the individuals included in the present study are given in the OSM (Table S1).
A 3D model of each cranium was created using photogrammetry as outlined by Evin et al. (Reference Evin, Souter, Hulme-Beaman, Ameen, Allen, Viacava, Larson, Cucchi and Dobney2016; see OSM for detailed methods). We used an eight-megapixel digital SLR camera mounted with a 50mm lens to photograph each cranium 150 times at three different angles (level with the cranium, at 15°, and 40°). Each cranium was placed on a PalaeoPi rotating table, which was systematically turned while photographs were taken at 10° intervals. Next, we used Agisoft's Metashape (2019 edition) software to align the photographs and generate a mesh model of each cranium. Thirty-four landmarks (see Harvati & Weaver Reference Harvati and Weaver2006) of the cranial base and temporal bones were then mapped onto each mesh model using MorphoDig (Lebrun Reference Lebrun2018; Figure 2, Table S2). Seven of the landmarks are Type I and 27 are Type II, based on Bookstein's (Reference Bookstein1991) landmark classification scheme. The types of landmarks represent how easy it is to identify the landmark on each object, with Type 1 being the most replicable.

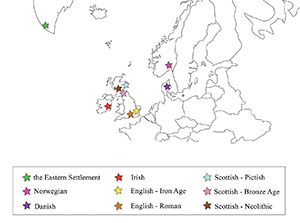
Figure 1. Geographical locations of the individuals included in this study. The Scandinavian individuals come from various sites in Norway and Denmark, with the general areas indicated by pink and purple stars (figure by K.A. Plomp).
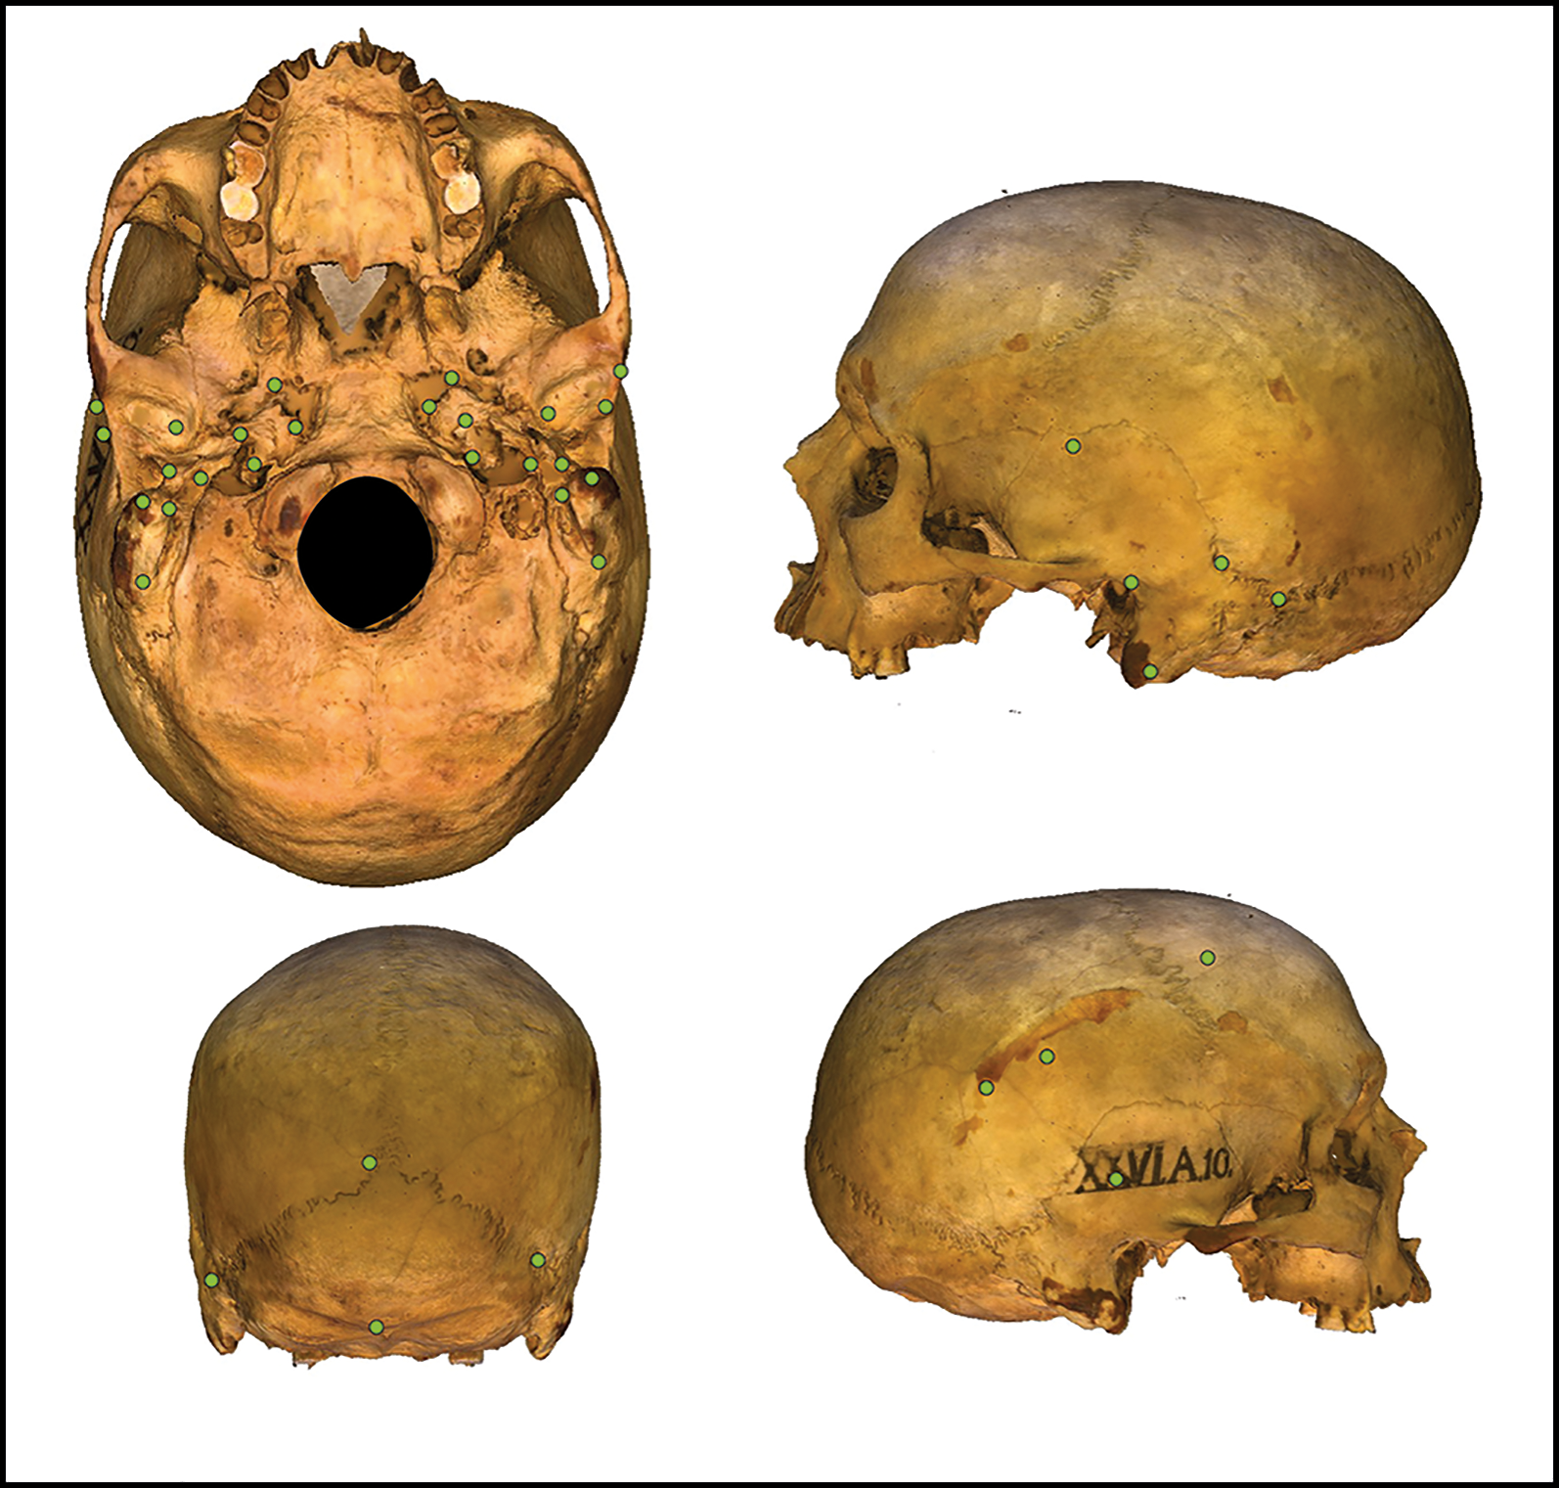
Figure 2. Location of the 34 cranial base landmarks used in this study. Based on Bookstein's (Reference Bookstein1991) landmark classification scheme, there are seven Type I landmarks (lambda, asterion, auriculare, pterion, inion, carotid canal, hypoglossal canal) and 27 Type II landmarks (figure by K.A. Plomp).
Intra-observer error in the recording of landmarks was assessed following the protocol set out by Neubauer et al. (Reference Neubauer, Gunz and Hublin2009, Reference Neubauer, Gunz and Hublin2010, see OSM for details). The results were found to fall within acceptable limits. Following this, MorphoJ software (Klingenberg Reference Klingenberg2011) was used to remove or reduce the effects of several confounding factors, including translation (i.e. information associated with location of the cranium relative to the camera), rotation (i.e. information associated with the orientation of the cranium), size and asymmetry. Individuals were then grouped into four Operational Taxonomic Units (OTUs) based on the location from which they were excavated: Greenlandic, Scandinavian, southern British (i.e. from sites in what is now England), and Scottish and Irish (Table 1). Individuals from southern Britain were separated from those from Scotland and Ireland in order to make the results directly comparable with those reported by Plomp et al. (Reference Plomp, Gestsdóttir, Dobney, Price and Collard2021).
Table 1. Operational Taxonomic Units (OTUs) used in the study. See the OSM (Table S1) for further details.

As the study is predicated on the existence of morphological differences between crania from three OTUs—Scandinavia, southern Britain, and Scotland and Ireland—it is necessary to establish whether the average cranial shapes of these three groups are significantly different. We began by reducing the dimensionality of the data by subjecting the averaged Procrustes coordinates to principal components analysis followed by the principal component reduction procedure outlined by Evin et al. (Reference Evin, Cucchi, Cardino, Viðarsdóttir, Larson and Dobney2013, Reference Evin2015, using MorphoJ and R). The retained principal component scores were subjected to multivariate analyses of variance (MANOVAs) using R (R Development Core Team 2018) to assess the statistical significance of any shape differences between the three potential source OTUs.
Similarities and differences in shape amongst all the OTUs could then be explored through the application of canonical variates analysis, with the aid of MorphoJ. Canonical variates analysis maximises between-group variation in relation to within-group variation, thereby facilitating interpretation of the differences among groups of individuals.
Lastly, we estimated the contribution of the potential source OTUs to the ancestry of the Greenlandic OTU using linear discriminant analysis of the retained principal components in R. Following Evin et al. (Reference Evin2015), we designated the potential source OTUs as the known samples and directed the linear discriminant analysis to indicate the OTU to which the Greenlandic individuals were most likely to belong. This process was repeated 100 times for each Greenlandic individual and the attribution percentages averaged. At this point, two methods for the estimation of ancestry can be employed.
In the first method, an individual is deemed to be most closely related to a given OTU if the average attribution percentage for that OTU is greater than or equal to 35 per cent. If none of the average attribution percentages for an individual is greater than or equal to 35 per cent, ancestry is recorded as ‘uncertain’. This method makes it possible to calculate the percentage of the Greenlandic individuals who were attributed to each of the potential source OTUs.
In the second method, average attributions across all the Greenlandic individuals are calculated to arrive at a percentage contribution of each of the three potential source OTUs to the ancestry of the Greenlandic OTU. Treating the linear discriminant percentages in this way avoids the ‘forced choice’ with respect to potential source OTUs involved in the first method.
Results
Following the reduction procedure (Evin et al. Reference Evin, Cucchi, Cardino, Viðarsdóttir, Larson and Dobney2013, Reference Evin2015), 11 principal components collectively account for 70 per cent of the total shape variance amongst the 270 crania included in this study. The overall MANOVA score is statistically significant (λ 0.643, F = 4.867, p<0.001) and so are all the pairwise comparisons between source OTUs (Table 2). This indicates that there are statistically significant differences in shape between the crania from the three potential source OTUs.
Table 2. Results of pairwise MANOVAs comparing potential source OTUs. *=significant p-value.

The canonical variates analysis yields three canonical variates (CVs). CV1 accounts for 55 per cent of the variation, CV2 for 25 per cent, and CV3 for 19 per cent. CV1 and CV2 are plotted against each other in Figure 3a, and CV1 and CV3 in Figure 3b. There is substantial overlap among the OTUs on CV1, but the southern British individuals tend to plot more towards the negative end of the CV, while the Scandinavian and Greenlandic individuals tend to plot more towards the positive end. The Scottish and Irish individuals are positioned near the centre of CV1, falling in the zone of overlap between the southern British individuals, and the Scandinavian and Greenlandic individuals. On CV2, the Greenlandic individuals overlap with both the southern British and Scottish and Irish individuals but tend to plot more positively than the Scandinavian individuals. Lastly, on CV3, the Greenlandic, southern British and Scandinavian individuals overlap substantially, whereas the Scottish and Irish individuals tend to plot more negatively.
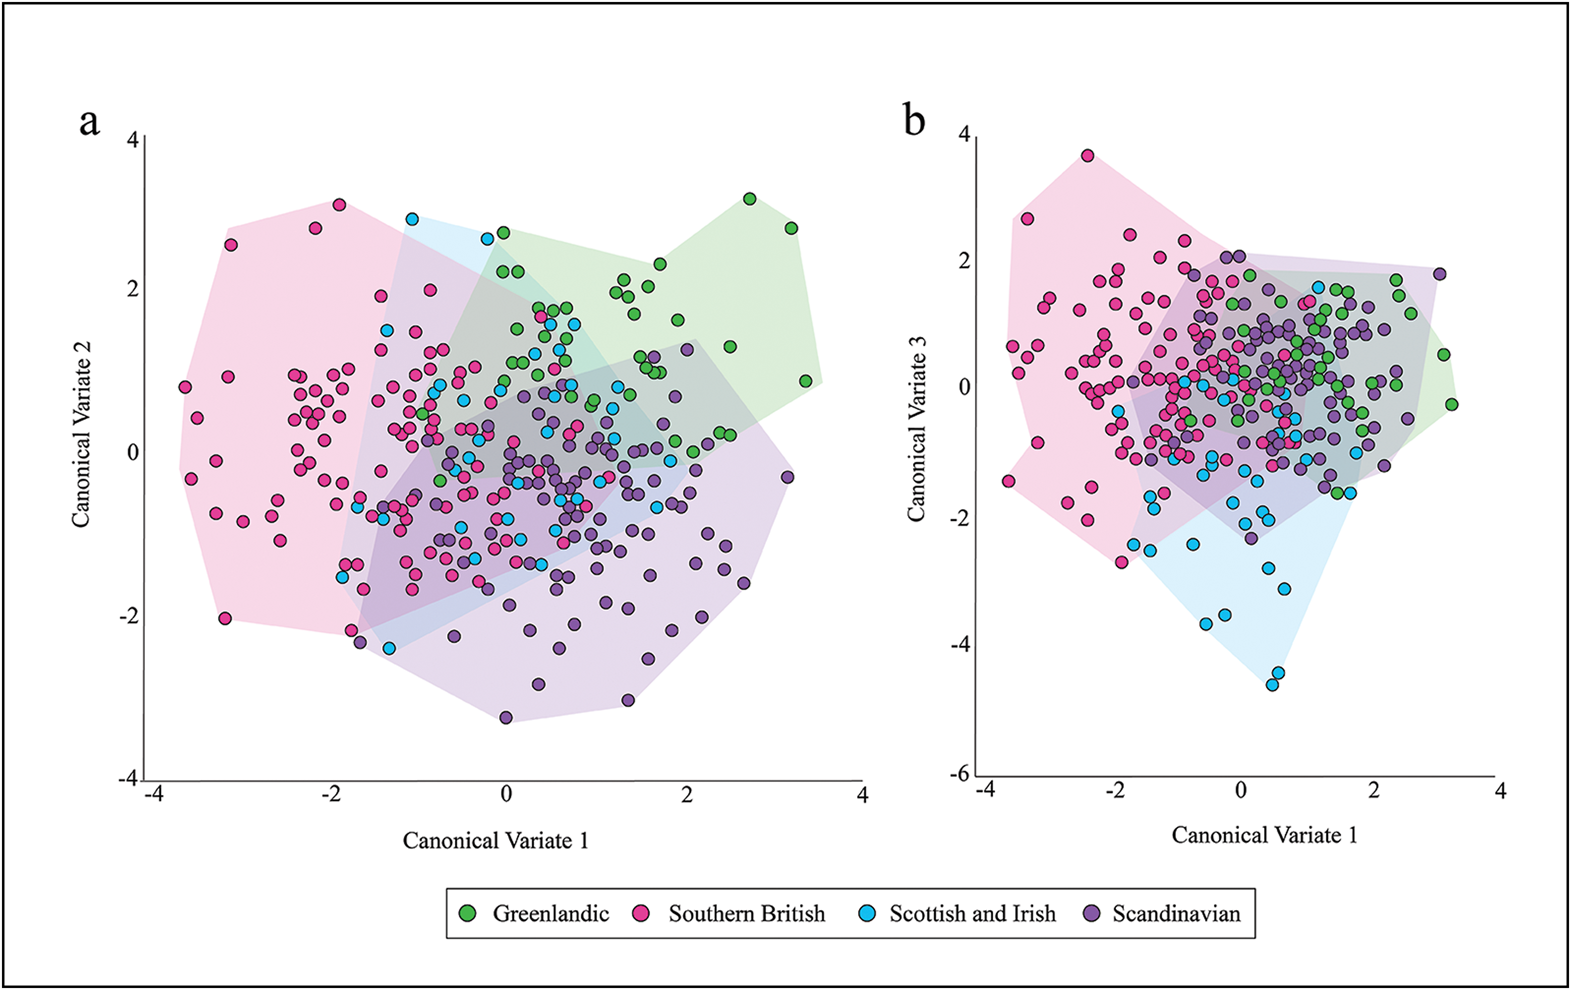
Figure 3. Scatterplots depicting the relationships among the four OTUs based on canonical variates analysis: a) CV1 versus CV2; b) CV1 versus CV3 (figure by K.A. Plomp).
The results of the linear discriminant analyses are provided in the OSM (Table S3). In the first analysis, where scores were used to indicate the potential source OTU to which each of the Greenlandic individuals most likely belonged, 37.5 per cent of the individuals from Greenland are assigned to the Scandinavian OTU, 42.5 per cent to the Scottish and Irish OTU, and 20 per cent to the southern British OTU (individual attribution percentages available in Table S3). In the second linear discriminant analysis—intended to avoid the ‘forced choice’ with respect to the potential source OTU—37 per cent of the ancestry of the Greenlandic OTU is attributable to the Scandinavian OTU, 39 per cent to the Scottish and Irish OTU, and 24 per cent to the southern British OTU.
Discussion
The results of the linear discriminant analyses suggest that the Greenlandic individuals included in this study are drawn from a population with diverse geographical ancestry. The analyses indicate that around 63 per cent of the ancestry of the Greenlandic sample is traceable to Britain and Ireland (i.e. southern British and Scottish and Irish results combined) and approximately 37 per cent to Scandinavia. This supports the hypothesis that people with British or Irish ancestry are well represented in the Norse colonies in Greenland and, by extension, in Iceland's founding population.
These findings add to previously published geometric morphometric results that suggest the founding population of Iceland was a roughly equal mix of immigrants with ancestry from Scandinavia and from Britain and Ireland (Plomp et al. Reference Plomp, Gestsdóttir, Dobney, Price and Collard2021). Morphological analyses based on the 3D shape of the cranial base therefore agree with the results of modern and ancient DNA studies, which indicate a substantial genetic contribution from Britain and Ireland to present-day populations in Iceland (Helgason et al. Reference Helgason, Sigurðardóttir, Gulcher, Ward and Stefánsson2000a, Reference Helgason, Sigurðardóttir, Nicholson, Sykes, Hill, Bradley, Bosnes, Gulcher, Ward and Stefánsson2000b), and to populations from the Viking Age in both Iceland and Greenland (Ebeneserdóttir et al. Reference Ebeneserdóttir, Sandoval-Velasco, Gundersdóttir, Jagadeesan, Guðmundsdóttir, Thordardóttir and Einarsdóttir2018; Margaryan et al. Reference Margaryan2020).
In contrast, the results of the study reported here are at odds with the available historical textual sources (Bjarnason et al. Reference Bjarnason, Bjarnason, Edwards, Friðriksson, Magnússon, Mourant and Tills1973; Pálsson Reference Pálsson, Bernhard and Kandler1974), the results of comparative osteological analyses of cranial non-metric traits (Steffensen Reference Steffensen1953, Reference Steffensen1975; Berry Reference Berry1974; Lynnerup Reference Lynnerup1998; Hallgrimsson et al. Reference Hallgrímsson, Donnabháin, Walters, Cooper, Guðbjartsson and Stefánsson2004), and the close affinity of ancient mtDNA from Norway with modern mtDNA from Iceland (Krzewińska et al. Reference Krzewińska, Bjørnstad, Skoglund, Olason, Bill, Götherström and Hagelberg2013). These lines of evidence suggest that the early Icelandic population and its Greenlandic offshoots were predominantly of Scandinavian ancestry.
There are several potential explanations for the discrepancy between the historical documents and the geometric morphometric results presented here. One is that the historical accounts were written long after the settlement of Iceland and may, therefore, be subject to inaccuracies and bias. It is also possible that the historical accounts reflect either the successful assimilation of individuals with ancestry from Britain and Ireland into Scandinavian society prior to emigration to Iceland, or the socio-political dominance of Scandinavians over people from Britain and Ireland in terms of who and what was recorded. It has been suggested that many of the people with British and Irish ancestry in Iceland's founding population were thralls (slaves; Helgason et al. Reference Helgason, Sigurðardóttir, Nicholson, Sykes, Hill, Bradley, Bosnes, Gulcher, Ward and Stefánsson2000b). If this were the case, then the focus on people of Scandinavian ancestry in the historical documents would be unsurprising.
Perhaps more unexpected is the discrepancy between the results reported here and those of previously published osteological analyses (Steffensen Reference Steffensen1953, Reference Steffensen1975; Berry Reference Berry1974; Lynnerup Reference Lynnerup1998; Hallgrimsson et al. Reference Hallgrímsson, Donnabháin, Walters, Cooper, Guðbjartsson and Stefánsson2004). A sampling bias in previous studies, whereby individuals with British and Irish ancestry were excluded due to the vagaries of preservation and/or sampling, may provide a simple explanation. Another possibility concerns the reliance on non-metric traits in these studies (Steffensen Reference Steffensen1953, Reference Steffensen1975; Berry Reference Berry1974; Hallgrimsson et al. Reference Hallgrímsson, Donnabháin, Walters, Cooper, Guðbjartsson and Stefánsson2004). The use of such traits has been questioned on the grounds that their identification and classification are highly subjective (e.g. De Stefano et al. Reference De Stefano, Hauser, Guidotti, Rossi, Rossi and Gulandi1984; Tyrell Reference Tyrell, Cox and Mays2000; L'Abbe et al. Reference L'Abbe, Rooyen, Nawrocki and Becker2011). A third possibility is that some non-metric traits are misleading about relatedness among certain human populations; enough of these traits could have been included in the studies that found only Scandinavians among the settlers as to obscure any contribution from Britain and Ireland to Iceland's founding population.
The results reported here suggest that 20–24 per cent of the ancestry of the Greenlandic sample is traceable to southern Britain (depending on which method for estimating ancestry is employed). This finding is echoed in the 30–38 per cent of tenth- to thirteenth-century individuals from Iceland previously estimated to have shown southern British ancestry (Plomp et al. Reference Plomp, Gestsdóttir, Dobney, Price and Collard2021). Other studies in which genetic or cultural contributions from outside Scandinavia have been identified amongst settlers have tended to conclude that the people in question were from Scotland and Ireland (Helgason et al. Reference Helgason, Sigurðardóttir, Gulcher, Ward and Stefánsson2000a, Reference Helgason, Sigurðardóttir, Nicholson, Sykes, Hill, Bradley, Bosnes, Gulcher, Ward and Stefánsson2000b; Als et al. Reference Als, Jorgensen, Børglum, Petersen, Mors and Wang2006), Britain (Karras Reference Karras1990), or Britain and Ireland in general (Ebeneserdóttir et al. Reference Ebeneserdóttir, Sandoval-Velasco, Gundersdóttir, Jagadeesan, Guðmundsdóttir, Thordardóttir and Einarsdóttir2018; Margaryan et al. Reference Margaryan2020); southern Britain is not specifically identified as a source of immigrants. Although the finding that people of southern British ancestry participated in the settlement of Iceland and Greenland is novel, it is not implausible. It is well-established that southern Britain (i.e. modern day England and Wales) was raided by Vikings during the early part of the Viking Age (Pälsoon Reference Pälsoon1932; Karras Reference Karras1988; Gore Reference Gore, Lavelle and Roffey2016; Downham Reference Downham2017). In fact, the AD 793 Viking attack on Holy Island, Northumberland, was long considered to mark the start of the Viking Age (Karlsson Reference Karlsson2000). It has been suggested that obtaining slaves may have been a major goal of the Viking raids (Downham Reference Downham2009; Raffield et al. Reference Raffield, Price and Collard2017). If this were the case, it follows that a large number of people could have been enslaved during the many raids on southern Britain. Some of these individuals could then have been transported to Norway and Iceland and their descendants could have participated in the establishment of the Icelandic colonies in Greenland.
Regarding future research, there are three obvious next steps. One is to repeat the study with a larger and more comprehensive sample. It would be particularly useful to include crania from other regions of Britain and Ireland. Orkney and Shetland are obvious gaps in our current sample. Both archipelagos were under Norse control for several centuries (approximately between AD 700 to 1300) and are geographically close to Iceland and Greenland, making them a potential point of origin for settlers. It would also be helpful to include crania from other regions of Norway. South-west Norway would be an especially good area to target for samples as the ‘Book of Settlements’ suggests that many settlers departed from that region (Karlsson Reference Karlsson2000).
A second step would be to repeat the study with data from other parts of the skull. The present study has focused on the cranial base because this area of the skull has previously been shown to correlate significantly with among-population genetic distances (e.g. Harvati & Weaver Reference Harvati and Weaver2006; Smith Reference Smith2009; von Cramon-Taubadel Reference von Cramon-Taubadel2009). The shape of the cranial vault has, however, also been found to align with population history (Harvati & Weaver Reference Harvati and Weaver2006; von Cramon-Taubadel Reference von Cramon-Taubadel2009, Reference von Cramon-Taubadel2014), and it would therefore be useful to repeat the analyses reported here with 3D data from the cranial vaults of a large sample of suitably dated individuals from Greenland, Iceland, Scandinavia, and Britain and Ireland.
Finally, the study reported here identified differences in the shapes of the cranial bases of Greenlandic individuals and those individuals from Scandinavia, and Britain and Ireland (Figure 3). These are principally observed when plotting CV1 against CV2. These differences may be the consequence of a founder effect and/or genetic drift, but it is also possible that they represent adaptive responses to novel environmental conditions. For example, the climate of Greenland is harsher than those of Scandinavia, and Britain and Ireland, so it is possible that the differences are, for example, temperature related. A study of individuals from the Greenland colonies that draws together investigative strands from archaeology, craniometrics, ancient DNA and stable isotope analysis could provide valuable insight into how humans adapted to new environments and how such transitions influenced human skeletal variation.
Conclusions
This study sought to shed light on the composition of the population that migrated from Iceland to Greenland at the end of the tenth century AD and, thereby, to add to the growing scientific evidence surrounding the colonisation of Iceland a century earlier. The picture painted by the famous Icelandic sagas and historical texts is one in which the majority of these settlers were purported to be of Scandinavian ancestry, whereas genetic analyses of modern and Viking Age individuals point to the presence of a substantial proportion of individuals with British and Irish ancestry in Iceland's founding population (e.g. Helgason et al. Reference Helgason, Sigurðardóttir, Gulcher, Ward and Stefánsson2000a, Reference Helgason, Sigurðardóttir, Nicholson, Sykes, Hill, Bradley, Bosnes, Gulcher, Ward and Stefánsson2000b; Margaryan et al. Reference Margaryan2020). Previously, it has been suggested that these individuals were taken to Iceland as thralls by wealthy Scandinavians (Vésteinsson Reference Vésteinsson, Sheehan and Corráin2010). Our results from 3D-shape analyses show that 63 per cent of the ancestry of the Greenlandic sample can be traced to Britain and Ireland and 37 per cent to Scandinavia. These findings add further weight to the suggestion that Iceland's founding population was one of mixed geographic origins, consisting of individuals of Scandinavian ancestry (some of whom may have been wealthy) and a large number of individuals with ancestry from Britain and Ireland (many of whom may have been enslaved). More broadly, the present study provides further evidence that 3D-shape analysis of the cranial base is a useful method for researchers who wish to reconstruct the population affinities of human skeletons from archaeological sites, not least in situations where ancient DNA analysis is impossible due to poor preservation, cost or ethical concerns about destructive sampling.
Acknowledgements
We offer special thanks to Eileen Murphy for her support of our project and assistance with locating appropriate collections. We are also grateful to Allowen Evin and Carly Ameen for their assistance with the analyses. In addition, we thank Neil Price, the associate editor and the reviewers for their advice, which greatly improved the paper. The following institutions kindly provided access to the collections used in the study: the University of Oslo; the University of Copenhagen; the Natural History Museum, London; the National Museum of Scotland, Edinburgh; the Tarbat Discovery Centre, Portmahomack; the Duckworth Laboratory, University of Cambridge; and Queen's University Belfast.
Funding statement
The study was supported by the European Union's Marie Skłodowska-Curie Actions program (Horizon 2020-748200), the Social Sciences and Humanities Research Council of Canada (895-2011-1009), the Canada Research Chairs Program (228117 and 231256), the Canada Foundation for Innovation (203808), the British Columbia Knowledge Development Fund (862-804231) and Simon Fraser University (14518).
Supplementary material
To view supplementary material for this article, please visit https://doi.org/10.15184/aqy.2023.131.


 Open access