


Severe mental disorders such as recurrent major depression, bipolar disorder and schizophrenia are devastating illnesses. Affected individuals are at high risk of a number of negative outcomes, including reduced quality of life and premature mortality. For example, depression is the third leading cause of all-age years lived in disability, with an increase of 14.4% between 2007 and 2017.Reference James, Abate, Abate, Abay, Abbafati and Abbasi1 In absolute years, the life expectancy of individuals with schizophrenia decreases by an estimated 14.5 years on average.Reference Hjorthøj, Stürup, McGrath and Nordentoft2 Understanding the course of these illnesses is an urgent global need.
How behaviour is measured and how observed effects can be controlled for other influences are two crucial aspects in mental health research. Important instruments in research on severe mental disorders include cognitive tests, psychiatric rating scales and self-rating questionnaires to assess complex aspects of these illnesses. To date, a large variety of these instruments are employed in both clinical practice and research; choosing the assessment most applicable to a specific setting is difficult. Accounting for other confounding effects is also challenging in longitudinal observations of severe mental disorders that may lack control groups altogether.Reference Heilbronner, Samara, Leucht, Falkai and Schulze3 Therefore, obtaining knowledge on the behaviour of control individuals over time is essential to interpreting biases in uncontrolled studies of severe mental disorders. In longitudinal studies, the course of symptoms assessed by rating scales and questionnaires has been assumed to remain at a low, stable level for healthy individuals, but so far, there is only little formal research on the effect of time on these measurements outside of test–retest reliability. More important, repeated administration of cognitive tests in non-clinical samples leads to well-known retest effects (i.e. performance improvements) that have the potential to distort valid measurements. For example, a large meta-analysis of cognitive ability tests containing over 150 000 individuals demonstrated significant retest effects, which plateau after the third test administration.Reference Scharfen, Peters and Holling4 Generally, performance improvements over time follow the power law of practice,Reference Snoddy5–Reference Crossman7 but there is variation, depending on the specific psychological test (e.g.Reference Donner and Hardy8). For cognitive tests used in research on severe mental disorders and in clinical practice, it is therefore crucial to assess both the magnitude and course of time effects. Our aim is to identify changes over time as opposed to the test–retest reliability of specific instruments.
The PsyCourse study presents the unique opportunity to observe variation over a relatively short period of time (18 months) with a comparatively large interval between administrations of the test battery to assess time effects and investigate the stability assumption of rating scales and questionnaires. The PsyCourse study is a multicentre observational study on the longitudinal course of disorders on the ‘psychotic-to-affective continuum’ in Germany and Austria. People with major depression, bipolar disorder and schizophrenia, as well as healthy individuals, were assessed on a variety of measures over the course of 18 months in four administrations.Reference Budde, Anderson-Schmidt, Gade, Reich-Erkelenz, Adorjan and Kalman9 Here, we estimated time effects of the longitudinal course as slopes or odds ratios (OR) in regression models and then tested their significance to investigate this stability assumption in healthy individuals.
Method
Participants and instruments
The control individuals were recruited at three centres: Ludwig Maximilian University (LMU) Munich, University Medical Center Göttingen (both in Germany) and the Medical University of Graz (Austria). The longitudinal course was measured at up to four assessments, each about 6 months apart. Metadata on the assessments are available online.Reference Heilbronner, Adorjan, Anderson-Schmidt, Budde, Comes and Gade10 Control participants of the PsyCourse study underwent a screening for lifetime occurrence of mental disorders at the first assessment, using a modified version of the MINI-DIPS, which is a brief version of the German DIPS (Diagnostic Interview for Mental Disorders).Reference Margraf11 Participants who had ever been treated as in-patients for one of the diagnoses researched in the patient arm of the study were excluded. At each follow-up visit, it was also assessed whether there had been any psychiatric hospital admissions since the last study visit. This was the case for two individuals at the third visit and for one individual at the fourth visit. Interviewers were extensively trained.Reference Budde, Anderson-Schmidt, Gade, Reich-Erkelenz, Adorjan and Kalman9
At the initial test battery administration 466 healthy individuals participated; 326 of these provided longitudinal information by participating twice or more often, and 224 individuals received all four administrations. We excluded participants with only one administration. Tables 1 and 2 display sample sizes for each number of administrations, as well as distributional characteristics of age, gender and study centre for the total study populations in the analysis. The age distribution is skewed and bimodal, with one peak in the younger age range and one in the middle range. In total, 50% of all participants were 32 or younger, 60.7% were female, 72.1% were recruited in Munich and 6.4% in Graz. The comparatively large percentage of younger participants is a result of recruiting university students.
Table 1 Characteristics of study population (n = 326) and number of participants with specified number of assessments available

Table 2 Age data from study population

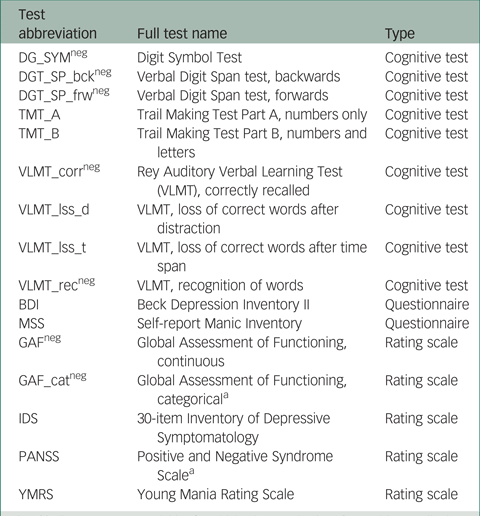
In total, scores on 16 instruments (giving 16 outcome variables) from the PsyCourse study were analysed longitudinally. Details and specific references for each instrument may be found in the PsyCourse main publication and the code book.Reference Budde, Anderson-Schmidt, Gade, Reich-Erkelenz, Adorjan and Kalman9,Reference Heilbronner, Adorjan, Anderson-Schmidt, Budde, Comes and Gade10 The cognitive tests considered were: the Digit Symbol Test (abbreviated as DGT in this paper), two parts of the verbal Digit Span test (DGT_SP), four performance scores of the German version of the Rey Auditory Verbal Learning Test (Verbaler Lern- und Merkfähigkeitstest, abbreviated as VLMT), and the Trail Making Test (TMT) Part A and B. The questionnaires selected were the German edition of the Manie-Selbstbeurteilungsskala (Self-Report Manic Inventory, abbreviated as MSS) and the Beck Depression Inventory II (abbreviated as BDI). As rating scales we chose the Global Assessment of Functioning (GAF), the 30-item Inventory of Depressive Symptomatology scale (abbreviated as IDS), the three scales of the Positive and Negative Syndrome Scale (PANSS), and the Young Mania Rating Scale (YMRS). These outcome variables are listed in Table A1 in the Appendix, with abbreviations and the respective grouping used in this paper. For most symptom rating scales, higher values indicate more severe symptoms, but this differs from variable to variable in cognitive tests. Table A1 also indicates the effect direction, which is important for interpretation.
The PANSS total score is the sum of three variables that represent the subscales for positive, negative and general symptoms. The GAF is a continuous scale that allows scores from 1 to 100, representing severe to no impairment in functioning. However, some interviewers used the GAF scale strictly categorically and assigned a score according to symptomatic categories. This creates spikes at the margin of each category, as there is no universal guideline for the scale.Reference Aas12 Thus, we also created and analysed a categorical version of the GAF variable, which avoids these artefacts but also loses some information. With respect to the original GAF scale, this ordinal version (GAF_cat) comprises the values from 1 to 10, with 10 indicating perfect psychosocial functioning.
Ethics and consent
Written informed consent was obtained from all participants, and the relevant ethics committees and review boards approved the study. For details, see Budde et al.Reference Budde, Anderson-Schmidt, Gade, Reich-Erkelenz, Adorjan and Kalman9
Statistical analysis
Where appropriate, we modelled the longitudinal course of the considered outcome variable using a linear mixed model (LMM). If the distributional shape did not allow an LMM because of violations of the model requirements, we dichotomised the outcome into two performance groups and applied logistic regression in a mixed model. We then assessed the robustness of the LMM or logistic regression results using a longitudinal non-parametric test (LNPT).Reference Brunner, Domhof and Langer13 Ultimately, the goal of the modelling was to test for a slope effect over time βtime for the longitudinal course with the LMM, i.e. the time effect or trend, while adjusting for other effects. For both regression models, the null hypothesis of stability implies a slope of βtime = 0, for logistic regression transformed to OR = exp(βtime) = 1.
The LMM includes fixed and random effects. With fixed effects, estimated globally, we modelled the longitudinal course using a regression line for the number of administrations (time) with intercept and slope, adjusted for gender and age. Study centre as a covariate was ultimately not considered, as it neither contributed significantly nor notably changed the time estimate in the LMM (data not shown). In addition to a fixed global intercept, we modelled a random intercept using the participant ID to account for individual baseline levels and correlations between data points for the same individual. We also considered including a random slope over time modelled by the number of the administration in addition to the random intercept. However, this did not provide a better fit overall. The general model equation is as follows:

where X and Z are the covariates, and β and γ are the fixed and random effects regression coefficients respectively. The latter and the residuals independently follow a normal distribution.
Our main interest is the trend in the longitudinal course over time, i.e. the slope of the modelled regression line represented by βtime. The LMM estimates the regression parameters β for each covariate as the linear influence of the fixed effect on the outcome variable by trying to minimise the error of the predicted values according to the available data. The estimated βtime may be interpreted as the average change in performance in the unit of the outcome variable from one point in time to the next. TMT_A, TMT_B, VLMT_corr, VLMT_lss_d, VLMT_lss_t and GAF scores (see Table A1 for definitions) were transformed beforehand to enhance model fit. However, stability over time will still correspond to a βtime estimate not significantly different from zero.
The LMM is not appropriate for outcome variables with a large spike, i.e. a very sharp peak, at one end of the distribution. We dichotomised these variables using a cut-off value. We then modelled the probability of yielding an outcome of improved performance or fewer symptoms by logistic regression, using the same fixed and random effects as above for LMM. Choosing cut-off values is arguably arbitrary, so we used symptom-based and empirical methods. In this cohort of healthy individuals, we chose the first cut-off by identifying whether the individual had mild clinical symptoms (clinical = 0) or no clinical symptoms (non-clinical = 1). For several outcome variables, all individuals fall into the non-clinical category. The observed spike occurs at one end of the distribution at values corresponding to minimal symptoms for scales and questionnaires and good performance on the VLMT_rec. Thus, for the second cut-off we assigned this ‘minimal symptom spike’ the value 1 and others the value 0. In both logistic regression models an OR > 1 for the time effect indicates an improvement over time. The spike cut-off divides the measurements more evenly than the clinical cut-off, although the majority naturally is still contained in the group with fewer symptoms or improved performance.
We conducted a longitudinal non-parametric test as the final step of the analysis. An LNPT corresponds to an ANOVA-like test for the factor time, using ranks instead of original measurements. Thus, it tests whether time has an influence on the longitudinal course. As other rank-based tests, an LNPT does not rely on distributional assumptions as LMM and logistic regression, so we use it to assess the robustness of the results on the time effect estimates of the parametric regressions. Therefore the LNPT functions as a sensitivity analysis to provide qualitative confidence in the validity of the parametric results. However, a direction or size of the time effect cannot be estimated. We adjusted for the factors age (younger and older age split by the median) and gender by incorporating them as subgroups in this rank-based test. The null hypothesis implies that there are no differences in the distribution of the outcome variable within the subgroups between time points.
We conducted an explorative analysis of the influence of time (and covariates) on the different cognitive tests, rating scales and questionnaires for severe mental disorders. The assumption of stable outcome variables is strong and needs to be verified. We therefore used a liberal approach and chose a significance level of 0.05 without adjustments for the number of statistical tests conducted. For sensitivity analysis with the LNPT, we consider P < 0.1 to support evidence for a previous significant effect estimate, as it has inherently less power than the LMM or logistic regression. This ensures that no effect is missed, thus providing information for other researchers, whose work is dependent on the stability assumption.
We conducted the analysis with R version 4.0.3 on Linux.14
Results
Table 3 shows the means and standard deviations for the cognitive tests or the medians and interquartile ranges (IQR) for questionnaires and rating scales. Most cognitive tests tend to follow a normal distribution, whereas questionnaires and rating scales contain spikes. Therefore, the mean and standard deviation are not as informative for the questionnaires and rating scales as the median and IQR. Note that the VLMT was added to the test battery at the second assessment. Further, we listed both mean and median for the GAF and VLMT_rec, as they are the distributional exceptions. The VMLT_rec suffers from truncated values, because there is a limited number of words to be recognised in the test and perfect scores are not uncommon. It is therefore a spiked distribution rather than a normal distribution. The GAF contains several spikes because of the mix of categorical and continuous input, but shows an underlying normal distribution, most likely because psychosocial functioning varies from person to person even in absence of mental illness.
Table 3 Mean and standard deviation (s.d.) for the cognitive tests, and median and interquartile range (IQR) for rating scales and questionnaires for each administration

DG_SYM, Digit Symbol Test; DGT_SP, verbal Digit Span test; bck, backwards; frw, forwards; TMT, Trail Making Test, Parts A and B; VLMT, German version of the Rey Auditory Verbal Learning Test; corr, correctly recalled; lss_d, loss of correct words after distraction; lss_t, loss of correct words after time span; rec, recognition of words; BDI, Beck Depression Inventory II; GAF, Global Assessment of Functioning; cat, categorical; IDS, 30-item Inventory of Depressive Symptomatology; MSS, Self-Report Manic Inventory [in German]; PANSS, Positive and Negative Syndrome Scale; YMRS, Young Mania Rating Scale.
Individual courses reveal greater variability than the relatively stable means and standard deviations in Table 3 suggest. In general, cognitive tests reveal a greater variability, since they measure the performance on a task and not the presence of symptoms, where the latter should naturally not occur regularly in control participants. Fig. 1 displays courses for the TMT_B cognitive test and the IDS rating scale as an example.

Fig. 1 Courses of the Trail Making Test Part B (TMT_B) and Inventory of Depressive Symptomatology scale (IDS) with means and standard deviations of cognitive tests over time.
The vertical black bars depict one unit of the standard deviation in each direction. TMT_B serves as an example of cognitive tests, IDS of rating scales. To illustrate differences in variability, we plotted both TMT_B and IDS on the same scale.
For each of the groups of outcome variables, Table 4 displays the average number of individuals with measurements per administration. In a preliminary test, we confirmed that participants who dropped out did not have significantly better or worse outcomes than the participants who continued with the study. The data are shown in supplementary Fig. 1, available at https://dx.doi.org/10.1192/bjo.2022.17. We therefore assume them to be missing at random.
Table 4 Average number of assessed individuals for each type of instrument per administration

a. Note that the Rey Auditory Verbal Learning Test (VLMT) was included only at the second assessment and beyond for the cognitive tests.
We modelled each outcome variable in turn by random intercept LMM or logistic regression adjusted for age and gender as described in the Method section, and estimated time effects in the form of slope or OR respectively. We then examined those estimates for robustness by the LNPT. Table 5 shows the results.
Table 5 Overview of time effectsa detected, with P-values and 95% CIs

LNPT, longitudinal non-parametric test; DG_SYM, Digit Symbol Test; DGT_SP, verbal Digit Span test; bck, backwards; frw, forwards; TMT, Trail Making Test, Parts A and B; VLMT, German version of the Rey Auditory Verbal Learning Test; corr, correctly recalled; lss_d, loss of correct words after distraction; lss_t, loss of correct words after time span; rec, recognition of words; BDI, Beck Depression Inventory II; MSS, Self-Report Manic Inventory [in German]; GAF, Global Assessment of Functioning; cat, categorical; IDS, 30-item Inventory of Depressive Symptomatology; MSS, Self-Report Manic Inventory [in German]; PANSS, Positive and Negative Syndrome Scale; YMRS, Young Mania Rating Scale.
a. The time effect was estimated using a linear mixed model (LMM) or logistic regression including age, gender and a random intercept, and checked for robustness using an LNPT. Estimated effects are reported as slopes for the LMM and OR for the logistic regression.
b. Summary of the results regarding the stability assumption. Positive indicates improved performance over time for the participants or fewer symptoms.
c. Cut-off for good function (could be interpreted as few symptoms).
d. Cut-off for perfect function (could be interpreted as no symptoms).
e. Clinical cut-off in logistic regression. Note that for VLMT_rec and GAF/GAF_cat one or two of the cut-offs fall together and are not listed twice.
Most variables fitted with the LMM are cognitive tests, with the exceptions of the GAF and GAF_cat. The VLMT_rec could not be fitted by LMM because of its distributional shape. The additive interpretation of the LMM is then applicable only for the transformed variable. For the GAF and VLMT_corr, the transformation changes the direction of interpretation of the outcome variable. All estimated effects for the cognitive tests are significant except for DGT_SP_frw, which comes close to significance, nevertheless. Most effect sizes are small and, with the exception of GAF_cat, all of the effects point towards performance improvement over time. Fig. 2 illustrates this trend with means and standard deviations for the cognitive test variables. Although the descriptive statistics mostly coincide with the slight improvements from one point in time to the next, the performance of some individuals still varies drastically over time, as illustrated in Fig. 1. Effect estimates in the LMM are highly influenced neither by extreme single performance outliers, nor by participants with extreme performance differences between administrations (data not shown).

Fig. 2 Means and standard deviations of cognitive tests over time.
The vertical bar depicts one unit of the standard deviation in each direction. TMT, Trail Making Test, Parts A and B; DG_SYM, Digit Symbol Test; DGT_SP, verbal Digit Span test; frw, forwards; bck, backwards; VLMT, German version of the Rey Auditory Verbal Learning Test; lss_d, loss of correct words after distraction; lss_t, loss of correct words after time span; rec, recognition of words.
Logistic regression was used to estimate time effects of the questionnaires, rating scales and VLMT_rec, which contain spikes at one end of their distributions. The recoding of data points for clinical symptoms and the spike cut-offs resulted in 13 logistic regression models. The PANSS and YMRS data could not be analysed with the clinical cut-off, as all measurements fall into the non-clinical symptom category. For the GAF and GAF_cat, both cut-off strategies resulted in the same dichotomous distribution. Thus, the effect estimate is only reported once. Seven of the thirteen models did not yield significant estimates. There is no clear direction of effects, most evident in the GAF variable, for which different cut-offs yielded two significant estimates in opposite directions. Effect sizes are small to moderate.
We used the LNPT to check the robustness of the estimated effects in a sensitivity approach. LMM effect estimates are based on normality assumptions, whereas the logistic regression effect estimates are highly dependent on the chosen cut-off, here resulting in very unbalanced groups. The dichotomisation also leads to a loss of information. For six out of nine cognitive tests, the LNPT detected consistent effects. For the cognitive tests that revealed significant estimates in the LMM, but not in the LNPT, the P-values for the LNPT are still supportive of our initial findings (P < 0.1). Regarding the questionnaires and rating scales, the LNPT did not reach significance, with the exception of the MSS. Despite significant effects in the logistic regression, the P-values for the LNPT are rather large (P > 0.1).
We observed small improvements in almost all the cognitive tests over time. Most effect estimates proved to be robust, as indicated by the LNPT. Therefore, we cannot assume the corresponding measurement variables to remain stable over time. Although most of the effect sizes are small, they should not be overlooked, since the sizes of effects are in line with, for example, genetic effects.
Discussion
Behavioural symptom measurements and cognitive tests are important variables assessed in longitudinal psychiatric studies (e.g.Reference Budde, Anderson-Schmidt, Gade, Reich-Erkelenz, Adorjan and Kalman9,Reference Kircher, Wöhr, Nenadic, Schwarting, Schratt and Alferink15 ). Cognitive symptoms in particular are nowadays recognised as hallmarks of severe mental disorders (e.g.Reference Millan, Agid, Brüne, Bullmore, Carter and Clayton16–Reference Cipriani, Danti, Carlesi, Cammisuli and Di Fiorino20) associated with functional outcome (e.g.Reference Bowie and Harvey21,Reference Green22 ). In this analysis, we investigated the time course for healthy (control) participants on cognitive tests, rating scales and questionnaires used in research on severe mental disorders. We modelled time effects using either LMM or logistic regression allowing for a random intercept, and assessed for robustness using LNPT.
Psychiatric questionnaires and rating scales
For the questionnaires and rating scales, the course appears to be steady despite the detection of significant time effects in some instances. The only scale with a consistently detected effect is the MSS. Note that for the YMRS, which also assesses mania symptoms, an effect in the opposite direction is detected, albeit not confirmed by the LNPT. The MSS is assumed to be consistent in its assessment with other self-rating scales for mania.Reference Meyer, Crist, La Rosa, Ye, Soares and Bauer23 The test–retest reliability with one month apart is stable,Reference Shugar, Schertzer, Toner and Di Gasbarro24 and the YMRS was used as an external validator for MSS in other research.Reference Bräunig, Shugar and Krüger25 The time effect of the MSS may thus be a false-positive result. When comparing how the MSS and YMRS quantify mania symptoms, both cover the same aspects. However, the YMRS employs fewer questions, rating symptoms on a scale from 1 to 5, whereas the MSS uses more questions with dichotomous answers. The difference in the trends could be due to the YMRS allowing for more nuanced answers. Another reason could be a possible difference between self-evaluation and the evaluation of a professional or the different length of the time covered by the measures (the past 48 h in the YMRS and the past month for the MSS). Regarding psychosocial functioning, the GAF presents itself as a special case, most likely because of the mix of categorical and continuous input in the variable. The detected effects have opposite directions, but are overall very small and only partially significant. The LNPT deems an actual difference unlikely as well, with P-values close to 1. It can be assumed that time has little if any effect on GAF results, which makes sense in the context of the analysed data-set, since the results of the logistic regression are highly dependent on the cut-off point and no other significant effect could be detected. In general, it is reasonable to expect that specific symptoms in unaffected individuals reveal little change over time if the group does not develop the mental illnesses in question, which is supported by our findings.
Cognitive tests
For the cognitive tests, we found that we cannot assume the course to stay at the same level over the time span of 18 months. There is an expected power loss comparing rank-based tests such as the LNPT with regression modelling, so we still deem non-significant results in the non-parametric test with P < 0.1 as supportive evidence in the sensitivity analysis for a significant parametric result. This is the case for the VLMT variables. For the DG_SYM, a rather large effect was detected, resulting in an average improvement of around three more correctly assigned symbol–digit pairs on every administration compared with the preceding administration. The DG_SP_frw is the only cognitive test with no significant effects detected, although the LMM missed the significance level only narrowly. Most likely this is due to the decline in performance between the third and fourth administration and the narrow range of the mean at each administration, as can be observed in Fig. 2. Since the fourth assessment also suffers from the greatest number of missing values, this unexpected decline might have been mitigated by a more complete data-set. The effect on the VLMT_rec was not significant in all instances, most likely owing to its truncated nature, but the effect clearly leans towards a better performance as well. The nearly consistent positive time effects across the cognitive tests are well-known in longitudinal studies assessing cognition as retest effects.Reference Scharfen, Peters and Holling4 Most research into retest effects uses only one further administration. In studies with more than two administrations, the effect sizes decrease with each additional administration until a plateau is reached. Furthermore, the performance improvements decrease with greater time spans between administrations. It has also been suggested that harder or more complex tests are associated with greater effects, which was not supported by available data.Reference Scharfen, Peters and Holling4 Our analysis results cannot support this suggestion either, since we found both smaller and larger effects in the arguably harder test variation for the Trail Making Test and the Digit Span test respectively. In general, studies including cognitive tests with more than two test administrations are scarce.Reference Scharfen, Peters and Holling4 Bartels et al conducted a study similar to our analysis with a considerably smaller cohort at seven time points, five of which were conducted with a higher test frequency and the last two concurring with the PsyCourse 6-month test schedule.Reference Bartels, Wegrzyn, Wiedl, Ackermann and Ehrenreich26 In that study, most of the improvement was found within the first five time points in 3 months. Since the course already reached the plateau by the time the second administration was conducted in the PsyCourse study, it leads to the assumption that the number of administrations has a greater influence on the effect size than the time span between assessments. Similar to our analysis, Bartels et al did not find an effect of most covariates on the slope of time.Reference Bartels, Wegrzyn, Wiedl, Ackermann and Ehrenreich26 In tests on general cognitive ability, three different theories are suggested as the cause of these effects: actual improvement of cognition by participating in the test, a reduction of outside negative influences such as nervousness and test anxiety, or an improvement in test-specific abilities such as forming strategies or increased familiarity.Reference Lievens, Reeve and Heggestad27 Cognitive function itself reflects multiple subcategories of cognitive domains. It is also difficult to disentangle cognitive test results completely from other factors, such as motor abilities.Reference Sánchez-Cubillo, Periáñez, Adrover-Roig, Rodríguez-Sánchez, Ríos-Lago and Tirapu28 However, the consistency of detection and direction suggests that the effect reflects commonly assessed characteristics of cognitive tests. In a study with a high-stake environment for the participants (medical school admission test), it was found that the results fit best with improvement of test-specific abilities, for example familiarity or strategy.Reference Lievens, Reeve and Heggestad27
A learning effect for the Trail Making Test is supported by other research with an even smaller sample in an elderly population.Reference Oliveira, Trezza, Busse and Jacob-Filho29 Age itself has a slightly negative effect on the performance in our models, not further reported here. Other research suggests worsening results in cognitive tests assessing the working memory span after other working-memory-span exercises.Reference Lustig and Hasher30 This should be considered in further research, if more than one cognitive test is administered on the same day.
Variability in cognitive tests compared with psychiatric instruments
The higher variability in cognitive tests compared with questionnaires and rating scales is expected. Research on memory speed performance in older adults characterised the intra-person variability as normally distributed noise with no systematic structure, although higher IQ and practice reduces variability.Reference Ram, Stollery, Rabbitt and Nesselroade31 Further, performance variability across the lifespan increases for age groups past their mid-30s.Reference Rutter, Vahia, Forester, Ressler and Germine32 Intra-person variability in older adults with mild dementia for reaction-time and episodic-memory tasks was found to be higher than in both healthy participants and participants with arthritis, whereas the variability appeared stable across cognitive domains.Reference Hultsch, MacDonald, Hunter, Levy-Bencheton and Strauss33 Within our data-set, we also found that participants with higher variability are significantly older and perform significantly worse in eight out of nine cognitive tests (supplementary Table 1 and supplementary Fig. 2). The performance of a single participant on cognitive tests may be highly individual and does not necessarily adhere to the trend found in the whole participant group because of this variability, which is also exemplified in Fig. 1. The reported effect sizes found for the different cognitive tests should therefore not be used to assess the improvements over time of a single individual.
Limitations
Regarding the model selection, we did not find significant improvements in the model fit by including more variables, or changes in size or significance of the estimated time effect. In a larger study sample, including more covariates might prove more favourable. Possible covariates could include substance use or misuse, family history of mental illnesses, proxies for socioeconomic status and language skill. Significant influences of job and education on some cognitive tests have been detected in other research already.Reference Amodio, Wenin, Del Piccolo, Mapelli, Montagnese and Pellegrini34
As mentioned before, the control sample of the PsyCourse study contains a non-negligible number of students, which leads to a younger study population with a possibly higher educational and socioeconomic level than the general population. Although the possibility of too healthy controls cannot be completely disregarded, the presence of students alone is unlikely to contribute to it, since declining mental health of students is a growing problem in society.Reference Wege, Muth, Li and Angerer35–Reference Storrie, Ahern and Tuckett37 Despite the initial MINI-DIPS screening and the exclusion of individuals from the control group if they had hospital admissions resulting from the conditions monitored in the PsyCourse study, it is also possible that some participants in the control group might have experienced mild to moderate symptoms, for which they were not admitted and therefore not excluded from the group.
The attrition of participants is typical for longitudinal studies. There are fewer data points available for the rating scales, as illustrated in Table 4, most likely because collecting this type of data is more time-consuming and thus more cost intensive. The majority of trained raters in the PsyCourse study were psychologists or psychiatrists.Reference Budde, Anderson-Schmidt, Gade, Reich-Erkelenz, Adorjan and Kalman9
Implications for future research
According to our data and analysis, one can generally assume the results of rating scales and questionnaires for severe mental disorders in controls to vary little over the time span researched in the present study, in which they remained at low levels. Thus, recruiting a control group solely for rating scales and questionnaires might prove not to be justifiable from a cost perspective. Nevertheless, control groups may be very important to account for general environmental effects at population level, such as the current COVID-19 pandemic. Administering rating scales and questionnaires additionally to control groups in clinical trials with other end-points may identify individuals developing psychiatric disorders during the trial to avoid selection bias. However, studies using cognitive tests on individuals with severe mental disorders should recruit control groups for comparison to correct for time effects. This is especially the case in clinical settings, since it generally remains unclear to what degree improvements in cognitive test performance are only a result of repeated administration. If controls are not available, any improvement over time should be treated very carefully. For those studies unfortunately lacking a control group this study may serve as a crude benchmark with regard to the particular tests and time intervals researched, but should nevertheless be used with caution.
Supplementary material
Supplementary material is available online at https://doi.org/10.1192/bjo.2022.17.
Data availability
Data and analysis scripts are available from the corresponding author on reasonable request.
Acknowledgements
We would like to acknowledge and thank all participants in the PsyCourse study and all other researchers contributing to the PsyCourse project. We also thank Andrew Entwistle for proofreading this paper.
Author contributions
U.H. and H.B. conceptualised the topic of this analysis. K.S. performed the analysis and wrote the draft manuscript. U.H., H.B. and K.S. contributed to the design of the analysis and revised the manuscript. K.A., H.A.-S., M.B., A.C., K.G., M.H., J.K., F.K.-S., S.S., E.S., F.S., T.V. and U.H. collected the data used in this analysis and conducted data quality control. All authors contributed to critical manuscript revision and read and approved the submitted version.
Funding
T.G.S. and P.F. are supported by the Deutsche Forschungsgemeinschaft (German Research Foundation; DFG) within the framework of the projects described at www.kfo241.de and www.PsyCourse.de (SCHU 1603/4-1, 5-1, 7-1; FA241/16-1). T.G.S. received additional support from the German Federal Ministry of Education and Research (BMBF) within the framework of the BipoLife network (01EE1404H) and the Dr. Lisa Oehler Foundation (Kassel, Germany). H.B. is supported by the DFG (KFO241, BI576/5-1). S.P. was supported by a 2016 NARSAD Young Investigator Grant (25015) from the Brain and Behavior Research Foundation. U.H. is supported by the European Union's Horizon 2020 research and innovation programme under grant agreement No. 945151 (PSY-PGx).
Declaration of interest
T.S. is a member of the BJPsych Open editorial board and did not take part in the review or decision-making process of this paper.
Appendix
Table A1 Outcome (instrument) variables with abbreviations and the corresponding instrument type


 Open access
eLetters
No eLetters have been published for this article.