


Diet quality has been highlighted as a key target for interventions aiming to reduce population disease risk(Reference Verghese, Raber and Sharma1,Reference Burden, Jones and Sremanakova2) . Better diet quality has been associated with having lower risk of CVD(Reference Xu, Steffen and Selvin3), diabetes(Reference Conklin, Monsivais and Khaw4,Reference De Koning, Chiuve and Fung5) , and cancer(Reference Park, Boushey and Wilkens6), as well as overweight and obesity(Reference Asghari, Mirmiran and Yuzbashian7). One approach used to indicate diet quality is the calculation of dietary variety/diversity scores (i.e. number of different food items consumed in a recall period(Reference Drewnowski, Henderson and Driscoll8)), as variety is believed to be an effective indicator of nutritional adequacy(Reference Nair, Augustine and Konapur9,Reference Meng, Wang and Li10) .
In addition to diet quality, several epidemiological studies have reported positive associations between dietary variety scores (DVS) and food intake(Reference Vadiveloo, Dixon and Parekh11), indicating increased energy or weight of food consumed in relation to variety(Reference Gregory, McCullough and Ramirez-Zea12–Reference Marshall, Stumbo and Warren21). This association likely benefits the consumer when dietary variety consists of typically low energy density, nutrient-dense foods (reflecting better diet quality) but highlights potential risk of overconsumption in response to highly palatable, high energy density foods that more often characterise dietary patterns today(Reference Popkin, Adair and Ng22–Reference Johnson and Wardle24). For example, where greater overall dietary diversity was associated with poor diet quality, data from the Multi-Ethnic Study of Atherosclerosis (MESA) cohort showed that waist circumference measurements more than doubled for US adults with the highest food dissimilarity scores during a 5-year period(Reference De Oliveira Otto, Padhye and Bertoni25).
For these reasons, multiple reviews have highlighted a nuanced relationship between dietary variety and body weight whilst accounting for energy density, whereby consuming a greater variety of low (high) energy density foods is negatively (positively) associated with body adiposity(Reference Vadiveloo, Dixon and Parekh11,Reference McCrory, Burke and Roberts26–Reference Raynor and Vadiveloo28) . In particular, such an effect has been supported when measuring consumption of variety within specific food groups that differ in energy density (e.g. ‘sweets, snacks and carbohydrates’ v. ‘vegetables’)(Reference McCrory, Fuss and McCallum29). In a key cross-sectional study of seventy-one ‘healthy’ men and women in the USA, McCrory and colleagues(Reference McCrory, Fuss and McCallum29) found that variety was significantly and positively related to energy intake across food groups but showed that greater variety from within vegetables was significantly associated with lower body adiposity, despite positive associations for all other food groups. Since then, dietary intake studies have specifically highlighted the significant relationship between variety within ‘recommended’ food groups and lower body weight/body adiposity(Reference Azadbakht and Esmaillzadeh13,Reference Vadiveloo, Dixon and Mijanovich16,Reference Tande, Magel and Strand30–Reference Vadiveloo, Sacks and Champagne32) , though the most consistent evidence has been reported for opposing associations within ‘non-recommended’ food groups(Reference Vadiveloo, Dixon and Parekh11). Similar conclusions have been drawn from intervention studies, where greater variety in response to fruits and vegetables(Reference Epstein, Kilanowski and Paluch33), and/or restricted variety for ‘less healthful’ foods(Reference Epstein, Kilanowski and Paluch33–Reference Raynor, Niemeier and Wing35), have both been highlighted as a means to reduce energy intake and support weight loss(Reference Haws, Liu and Redden36).
Experimental studies in the laboratory also suggest that variety may drive the selection of larger portions. Including a greater variety of foods within and across meals – that differ in their sensory characteristics – has consistently been shown to increase consumption across food types(Reference Embling, Pink and Gatzemeier37). Repeated exposure to foods (and less variety) appears to result in faster habituation overtime, as individuals behaviourally and physiologically respond less to foods that are sensorially the same or similar to those previously eaten(Reference Epstein, Carr and Cavanaugh38–Reference Wilkinson and Brunstrom40). As such, variety has also been shown to increase the size of planned portions when selecting foods before eating(Reference Wilkinson, Hinton and Fay41), and portion size itself is known to significantly influence food intake(Reference Zlatevska, Dubelaar and Holden42). Over a longer period, such evidence suggests that dietary variety may influence body weight outcomes if significant effects on cumulative portion size are observed across eating occasions (akin to the variety effect in a mealtime context). Roberts and colleagues(Reference Roberts, Hajduk and Howarth19) in particular have highlighted energy intake as a factor that reduces the strength of dietary variety as a predictor of BMI when included in models. However, though DVS have been associated with increased energy intake using self-report measures in observational studies (see also above)(Reference Vadiveloo, Dixon and Parekh11), to our knowledge, no study has directly explored cumulative portion size as a mediating factor by which dietary variety may also influence body weight outcomes at a population level, particularly when considering the moderating role of energy density discussed across these literatures.
Therefore, this study aimed to further explore the relationship between dietary variety and body weight in a large cohort using secondary data from the UK Biobank (https://www.ukbiobank.ac.UK/) (see Fig. 1). It was predicted that higher DVS would be associated with increased body weight and body fatness when energy density was high. It was also predicted that portion size would mediate this relationship, meaning higher DVS would be associated with a higher body weight and body fatness when individuals reported greater food intake (when energy density was high), constituting a moderated mediation effect.

Fig. 1. Overview of proposed mediated moderation model predicting body weight outcomes (Y), including dietary variety (X), cumulative portion size (M), and energy density (W) in direct and mediated pathways. DVS, dietary variety scores.
Method
UK Biobank procedures
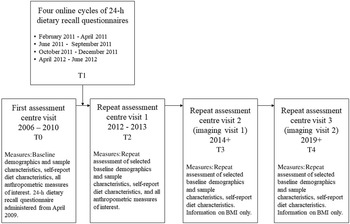
Prospective data from the UK Biobank were used in this study to analyse associations between dietary variety, portion size and body weight outcomes (Project ID: 53 159). The UK Biobank is a large-scale, cohort study including > 500 000 participants aged 40–69 years old, living within the UK(Reference Allen, Sudlow and Downey43). During baseline assessment centre visits, written informed consent was obtained from all participants. Participants completed questionnaires via a touch-screen and verbal interview, and physical measures were collected by Biobank staff. Demographic information including participant sex, age (in years), age completing full-time education (in years), employment status, ethnicity and Index of Multiple Deprivation (IMD) scores were recorded. The initial recruitment phase occurred between 2006 and 2010, and additional follow-up assessments were completed in-person and online. For an overview of the assessment timeline, see Fig. 2.

Fig. 2. Overview of the data collection timeline for the UK Biobank, including measures of interest.
UK Biobank data collection and access were conducted according to the guidelines laid down in the Declaration of Helsinki, and all procedures involving human subjects/patients were approved by the Northwest Multi-centre Research Ethics Committee (MREC). Use of data for secondary data analysis was approved by the UK Biobank and received departmental ethical approval from Swansea University’s School of Psychology Research Ethics Committee (no. 1515). The data analysis plan was preregistered on the Open Science Framework (OSF) prior to conducting main analyses (https://osf.io/hfrej/).
Participant eligibility
Participants were eligible for this study if they had both dietary recall questionnaire data and BMI recorded at baseline. Participants were included if they had self-reported experiencing no major dietary changes in the preceding 5 years, had no recent experiences of poor appetite or overeating, were not currently pregnant, had not been previously or currently diagnosed with cancer, and had not reported any ongoing behavioural addictions or substance dependencies. Participants were excluded if they self-reported having a current or history of professionally diagnosed eating disorders. Participants were also excluded if credibility of dietary intake was flagged by the Biobank (> 20 MJ/4780 kcal for males, > 18 MJ/4302 kcal for females), or if daily energy intake may otherwise be ‘implausible’ (< 2 MJ/500 kcal)(Reference Banna, McCrory and Fialkowski44,Reference Rhee, Sampson and Cho45) . Where information relevant to eligibility criteria and data credibility had been reassessed during follow-up visits, participant data were removed from additional time points if eligibility criteria were no longer met. For full code and data cleaning steps to identify eligible participants, please see the OSF: https://osf.io/ktqd6.
Measures
24-h dietary recall questionnaires
The Oxford WebQ 24-h dietary recall questionnaire(Reference Liu, Young and Crowe46) was first administered to participants at baseline, before participants were invited to complete up to four follow-up assessments via email(47). Participants were asked to report their consumption of > 200 individual foods and beverages during the previous day. For each item, participants were asked to estimate the number of servings consumed from multiple-choice lists. Where possible, servings related to standard units (e.g. ‘a slice of bread’). For an item to be reported, participants consumed ≥ 0·25 serving (self-assessed).
Participants provided information about their general diet and physical activity during the recall period using multiple-choice lists. Participants self-reported dietary restrictions (relating to eggs, dairy products, wheat and sugar), and whether or not they followed any type of special diet (including gluten-free, lactose-free, low-calorie, vegetarian and vegan). Participants self-reported time spent doing vigorous (e.g. fast running/cycling), moderate (e.g. brisk walking/jogging) and light exercise (e.g. leisurely walking) for the recall period. As a data check at the end of the survey, participants were asked ‘Would you say that what you ate and drank yesterday was fairly typical for you?’.
Dietary variety scores
For each 24-h dietary recall questionnaire, an overall DVS was calculated by summing the number of individual foods and energy-containing beverages consumed. Condiments, breakfast food condiments and beverage condiments (see Table 1) were excluded from this count to avoid repetition of items (e.g. oil for cooking and sugar in tea/coffee). Scores had a possible range between 1 and 203 items (reflecting the number of individual coded items), with higher scores indicating greater variety.
Table 1. Foods and beverages included in the Oxford WebQ 24-h dietary recall questionnaire, with assignment to ten food groups*

* In line with the approach of McCrory et al. (Reference McCrory, Fuss and McCallum29), individual foods and beverages were categorised into ten food groups.
Additional scores were calculated to assess dietary variety between food groups (DVS-B) and dietary variety within food groups (DVS-W). Individual items were categorised into ten food groups(Reference McCrory, Fuss and McCallum29) (see Table 1). To calculate DVS-B, participants were assigned a score from 1 to 10 based on the number of food groups from which they had consumed at least one item, with higher scores indicating consumption from across a greater variety of food groups. To calculate DVS-W, the percentage of individual items consumed from within each defined food group was determined (excluding condiment groups due to limited data for serving size). For each food group, a higher percentage indicated a greater variety of items consumed.
Portion size and energy density
Overall intake values were available in the dataset. Total weight of foods/beverages consumed (g) was used to indicate cumulative portion size, and energy density (kJ/g) across items was calculated. To estimate intake of individual items, standard portion sizes were used to calculate weight consumed(48), and standard food composition tables were used to calculate energy intake(Reference Holland, Welch and Unwin49). Total intake was then derived for each individual food group. Values > 16 kJ/g (4 kcal/g) indicate ‘high’ energy density (see ref. 50, as reported in ref. 51).
Anthropometric outcome measures
Anthropometric measurements were collected from participants during assessment centre visits (for further information, see ref. 52). Standing height and waist circumference were measured using a Seca 240 cm height measure and Seca 200 cm tape measure, respectively. Body weight (kg), whole-body fat (%) and fat-free mass (kg) were collected using a Tanita BC418MA body composition analyser or manually recorded using standard weighing scales where required. Height and weight measurements were used to calculate BMI (kg/m2).
Data analyses
At baseline, 35 449 participants were eligible for inclusion in the study, had completed the 24-h dietary recall questionnaire and had BMI recorded. Of these participants, 34 974 and 34 992 had body fatness and fat-free mass measured, respectively. Initial data cleaning was conducted in Python; this included identifying eligible participants for the study, removing unnecessary columns from the dataset, creating variable scores for multiple time points (including energy density and DVS) and reshaping data for analyses. Moderated mediation models were conducted using PROCESS v3.5.3 (Reference Hayes53), and remaining data analyses were conducted in Stata 16.0 (54). For access to data analysis logs, see the OSF (https://osf.io/hfrej/).
A series of bivariate correlation analyses (Spearman’s) were used to identify associations between potential covariates and outcome variables (online Supplementary Tables A.1 and A.2). Where relevant, categorical covariates were dummy-coded to produce binary variables, and all significant covariates were entered at baseline (T0). If covariates were significant but had missing data, models were repeated with these variables included as part of sensitivity analyses to check for differences in effects (online Supplementary Tables A.3 and A.4).
To test hypothesised relationships, a series of second-stage moderated mediation models were conducted at baseline (T0). DVS were included as the predictor (X), cumulative portion size was entered as the mediator (M) and overall energy density was entered as the moderator (W) of both the direct and mediated pathways. BMI, body fat percentage and fat-free mass were included as the outcome (Y). Participant sex was included as a significant covariate across models (rpb = 0·185–0·842), and effects of controlling for age completing full-time education (n 21 068, rs = –0·100) were explored in sensitivity analyses due to missing data. Across models, predictors were mean-centred, CI were adjusted using bias-corrected bootstrap approaches (5000 samples) and HC3 was used to adjust standard errors for heteroscedasticity(Reference Hayes and Cai55).
To explore longitudinal changes in body weight outcomes, a series of Wilcoxon signed-rank tests were used to check for differences in dietary intake and body weight outcomes between time points. Second-stage moderated mediation models conducted at baseline were repeated with DVS entered at T0, and composite scores for cumulative portion size and energy density entered at T1 (averaged across completed follow-up questionnaires). BMI was included as the outcome at T2 and T3, and body fat percentage and fat-free mass at T2. As < 50 participants had both dietary data and BMI collected at T4, this time point was dropped from analyses. Participant sex (rpb = 0·177–0·848), age (rs = 0·143), IMD score for England (rs = 0·105) and time spent doing vigorous physical activity (rpb = –0·158) were included as significant covariates. Baseline measures of BMI, body fat percentage and fat-free mass were controlled in the appropriate model. Effects of controlling for age completing full-time education (rs = –0·160) were explored in sensitivity analyses.
Unless otherwise stated, effects were significant if CI did not cross zero, and P < 0·05. However, given the large sample size and increased risk of finding significant but ‘trivial’ effects across multiple models(Reference Lantz56,Reference Kaplan, Chambers and Glasgow57) , overall model and coefficient effects were considered meaningful if equivalent to a ‘small effect size’ (observed R2 ≥ 0·02; r ≥ 0·10)(Reference Cohen58). To align with reported longitudinal trends in weight gain and development of overweight(Reference Katan and Ludwig59), change in dietary intake was identified as significant if it indicated ≥ 13 kcal increase in daily food consumption per unit (≈ 2·7 g(Reference Holland, Welch and Unwin49)). Change in BMI was identified as significant if it increased by at least 0·10 kg/m2(Reference Rosell, Appleby and Spencer60–Reference Guo, Zeller and Chumlea62), and body fat if it increased by at least 0·3 %(Reference Guo, Zeller and Chumlea62).
As part of exploratory sensitivity checks (online Supplementary Tables A.5 and A.6), estimated values for energy intake and weight of food consumed within food groups were used to calculate energy density after removing estimated beverage scores. Overall energy density scores (kJ/g) were lower than estimated energy density scores (without beverages) at baseline (mean difference = –3·38, sd = 1·81) and follow-up (mean difference = –3·12, sd = 1·33). However, mean scores across measures were < 6·6 kJ/g, indicating generally ‘low’ energy density(Reference Rolls51). See Table 2.
Table 2. Dietary intake at baseline (T0) and follow-up (T1)

* Energy density displayed as kcal/g in brackets for the mean and range.
† Dietary variety score calculated as the count of individual foods and beverages consumed across food groups.
‡ Dietary variety score calculated as the count of food groups from which items were consumed, scored from 1 to 10.
§ Dietary variety score calculated as the percentage of items consumed from within each food group.
Results
Cross-Sectional analyses at baseline
Participant characteristics
Table 3 displays sample characteristics. Of those included in the sample, 52·3 % were female. Most participants identified themselves as British (87·9 %) or Irish (2·7 %), or other White background (3·8 %), and were either in paid employment (59·6 %) or retired (32·7 %). Specific dietary restrictions were reported by 16·7 % of participants, 13·6 % followed a special diet and 39·1 % were users of vitamin supplements. Most participants reported doing 0–60 min of vigorous (92·5 %) or moderate (83·7 %) physical activity, and 0–5 h of light physical activity (93·1 %). 83·2 % reported that recall of their diet was representative of their typical eating habits. See Table 2 for dietary intake.
Table 3. Overview of sample characteristics at baseline (T0)*

* Mean ± sd (range).
† Higher scores indicate residential areas have greater levels of deprivation.
‡ Statistics not reported for Scotland as IMD score was available for < 50 participants.
Dietary variety scores as predictors of body weight outcomes
After controlling for effects of participant sex, models conducted at baseline (Fig. 3) showed that contrary to predictions, higher DVS was a significant and negative predictor of BMI and fat-free mass. Though greater dietary variety also significantly predicted increased daily food intake and the consumption of larger portions overall, cumulative portion size did not directly predict BMI, body fatness or fat-free mass. Energy density did not significantly moderate the influence of DVS – or portion size – on BMI, body fatness or fat-free mass. Moderated mediation effects of DVS on BMI (Index = 0·007, bootstrap se = 0·003, bootstrap 95 % CI = 0·001, 0·013) and fat-free mass (Index = 0·035, bootstrap se = 0·005, bootstrap 95 % CI = 0·026, 0·044) were significant but relatively small, as the conditional indirect effect of DVS increased at higher levels of energy density for both BMI (–1SD Effect = 0·037 v. +1SD Effect = 0·048, bootstrap se = 0·005, bootstrap 95 % CI = 0·002, 0·021) and fat-free mass (–1SD Effect = 0·098 v. +1SD Effect = 0·156, bootstrap se = 0·008, bootstrap 95 % CI = 0·042, 0·073). The moderated mediation effect of DVS on body fatness was not supported (Index < 0·001, bootstrap se = 0·004, bootstrap 95 % CI = –0·009, 0·009).

Fig. 3. Baseline models of overall dietary variety (DVS) as a predictor of BMI (R2 = 0·035), body fatness (BF) (R2 = 0·434) and fat-free mass (FFM) (R2 = 0·718). Unstandardised regression coefficients (b), adjusted standard error in brackets (se) and bootstrap CI are displayed (LLCI and ULCI). Pathways including the moderator are indicated with a dashed line. Significant coefficients are indicated in bold (P < 0·001). DVS, dietary variety scores.
A similar pattern of results was observed when DVS-B and DVS-W were included as predictors (online Supplementary Table A.7), and when ‘age completing full-time education’ was included as a covariate (online Supplementary Table A.3), with little evidence to support associated pathways between dietary variety and body weight outcomes.
Longitudinal analyses at follow-up
Data availability and participant characteristics
Of 17 272 participants who had completed at least one 24-h dietary recall questionnaire at follow-up (T1), up to 738 participants had body weight outcomes recorded at T2 (46·7 % female) and 1563 at T3 (47·3 % female).
Changes in dietary intake and body weight outcomes across time points were small. Compared with baseline, participants were consuming a smaller cumulative portion size at T1 (T0 M = 3·3 kg, sd = 0·8 v. T1 M = 3·2 kg, sd = 0·7; Z = 5·690, P < 0·001, r = 0·13), but energy density was significantly higher overall (T0 M = 2·8 kJ/g, sd = 0·8 v. T1 M = 2·9 kJ/g, sd = 0·7; Z = –4·660, P < 0·001, r = 0·10) (see Table 2 for dietary intake at follow-up). BMI (T0 M = 25·7 kg/m2, sd = 3·9 v. T2 M = 26·0 kg/m2, sd = 4·1; Z = –3·639, P < 0·001, r = 0·13) and body fatness (T0 M = 28·6 %, sd = 8·0 v. T2 M = 29·5 %, sd = 8·2; Z = –5·175, P < 0·001, r = 0·19) had increased at T2, whilst fat-free mass had decreased (T0 M = 53·6 kg, sd = 11·1 v. T2 M = 52·8 kg, sd = 10·9; Z = 7·165, P < 0·001, r = 0·27). All other differences between time points for dietary intake and body weight outcomes were either not significant or trivial effects.
Time-Lagged associations between dietary variety and weight-related outcomes
After controlling for effects of participant sex, age, IMD score for England and time spent doing vigorous physical activity, time-lagged moderated mediation models (Fig. 4) showed similar results as baseline models. DVS (T0) remained a significant and positive predictor of cumulative portion size (T1) but was no longer directly associated with body weight outcomes (T2 and T3). Portion size did not significantly predict BMI (T2 and T3), body fatness (T2) or fat-free mass (T2). Energy density (T1) did not significantly interact with portion size or DVS to predict body weight outcomes at follow-up, and the moderated mediation effects of DVS on BMI (T2 Index < 0·001, bootstrap se = 0·004, bootstrap 95 % CI = –0·007, .008; T3 Index < 0·001, bootstrap se = 0·003, bootstrap 95 % CI = –0·006, .006), body fatness (Index = 0·007, bootstrap se = 0·010, bootstrap 95 % CI = –0·012, .027) and fat-free mass (Index = –0·001, bootstrap se = 0·007, bootstrap 95 % CI = –0·014, .012) were not supported.

Fig. 4. Time-lagged models of overall dietary variety (DVS) as a predictor of outcomes at follow-up, including BMI (T2 R2 = 0·926; T3 R2 = 0·872), body fatness (BF) (R2 = 0·899) and fat-free mass (FFM) (R2 = 0·971). Unstandardised regression coefficients (b), adjusted standard error in brackets (se) and Bootstrap CI are displayed (LLCI and ULCI). Pathways including the moderator are indicated with a dashed line. Significant coefficients are indicated in bold (P < 0·001). All models included baseline measures of body weight outcomes as predictors. DVS, dietary variety scores.
A similar pattern of results was found when DVS-B and DVS-W were included as the predictor at T0 (online Supplementary Table A.8) and when ‘age completing full-time education’ was included as a covariate (online Supplementary Table A.4).
Discussion
This study sought to further explore the relationship between dietary variety and body weight outcomes, whilst considering the intermediate roles of cumulative portion size and energy density. First, contrary to predictions, DVS was directly associated with a lower BMI and fat-free mass at baseline, providing further population-level evidence to support a potentially beneficial role of variety in the consumer diet. In this study sample, energy density overall was noticeably low(Reference Rolls51). Though there was little evidence to support significant associations between DVS within food groups and body weight outcomes in supplementary analyses (with the exception of the largest group containing ‘sweets, snacks, and carbohydrates’), participants were consuming foods from across a wide range of food groups (including fruits and vegetables). This appears to reflect prior research that has associated dietary variety with higher diet quality(Reference Drewnowski, Henderson and Driscoll8–Reference Meng, Wang and Li10,Reference Kennedy27) . Indeed, evidence suggests that moderating variety appropriately across foods can be helpful to consumers when utilised in dietary interventions(Reference Epstein, Kilanowski and Paluch33,Reference Raynor, Steeves and Hecht34,Reference Epstein, Fletcher and O’Neill39) .
Second, as predicted, consuming a greater variety of foods (including scores across and within food groups) was significantly associated with increased weight of food consumed. In an important step towards triangulation(Reference Munafò and Davey Smith63), these results further corroborate findings from short-term experimental studies conducted in a mealtime context(Reference Embling, Pink and Gatzemeier37), supporting variety as a factor that may be significantly associated with food intake at a broader level. Past studies exploring relationships between dietary variety and consumption have typically focused on cross-sectional effects at a single time point, in relation to energy intake(Reference Vadiveloo, Dixon and Parekh11). By adopting a time-lagged modelling approach, this study specifically highlights consistent effects of variety on weight of food consumed over a longer period of time, outside of a single mealtime context, and across several potential eating sessions. Results also highlight a level of consistency between dietary variety scores in relation to food intake, as scores based on the overall count of individual items, number of food groups from which items were consumed and percentage of items consumed within food groups were all significantly associated with cumulative portion size.
However, energy density scores had less variability across participants in this study, potentially accounting for the non-significant moderated mediation effect of DVS on body weight outcomes (via cumulative portion size). One explanation is that dietary data may have been susceptible to ‘underreporting’, though data credibility was checked to reduce this bias. Previous research also suggests that including beverages within calculations of energy density can reduce overall estimates(Reference Wrieden and Barton64–Reference Cox and Mela66). Though sensitivity analyses indicated that energy density calculated from estimates of energy intake and weight consumed – when all beverages were excluded – was still low across participants, justification for removing beverage intake from analyses may be of interest particularly when energy density is high for foods alone. It is also important to acknowledge that cumulative portion size within a single recall period may not be expected to significantly influence body weight stability, particularly if energy density is low(Reference Rolls51). Indeed, research suggests that cumulative dietary recall measures, that are collected over several days or weeks, may provide more comprehensive self-report data(Reference Raynor, Thomas and Cardoso67).
Some additional limitations of data analyses in this study should be addressed. Missing data across time points meant that models were cross-sectional at baseline, and only a single time point was included for dietary data at follow-up (averaged across available reports). Dietary data were also derived from self-report 24-h recall questionnaires. Though this specific measure has been validated within the Biobank(Reference Liu, Young and Crowe46,Reference Galante, Adamska and Young68) , there was a lack of specificity when reporting serving sizes (as this was defined by multiple-choice lists). Participants were instructed to use an ingredient-based approach to reporting food intake, whereby mixed meals/dishes were disaggregated into component parts (e.g. ‘Spaghetti bolognaise’ was reported as ‘pasta’, ‘beef’ and ‘tomato-based sauce’(47)). Recent evidence has highlighted that this can improve sensitivity when estimating nutritional intake(Reference Carter, Hancock and Albar69,Reference Marconi, Durazzo and Camilli70) , and consideration of multiple components included within mixed dishes/foods may be particularly important when considering effects of ‘sensory’ variety on food intake(Reference Raynor and Vadiveloo28,Reference Wilkinson, Embling and Raynor71) . However, information about specific flavours and brands may be relevant to calculations of dietary variety when measuring food intake across several days(Reference Raynor, Thomas and Cardoso67).
Food groups were also constructed in line with previous food categories used for FFQ data(Reference McCrory, Fuss and McCallum29), meaning the number of items included to indicate variety differed between groups. DVS-W was included as an exploratory measure in addition to overall DVS (and energy density) in models, as previous studies have reported negative v. positive associations with body adiposity when scoring variety separately for groups of ‘healthful’ foods (typically fruits, vegetables and low energy density foods) and ‘energy-dense’ foods, respectively (for a review, see ref. 11). As McCrory and colleagues highlighted a key difference in the direction of associations between vegetables and other food groups specifically(Reference McCrory, Fuss and McCallum29), this food group approach was adopted in the current study. However, ‘sweets, snacks, and carbohydrates’ included a comparatively greater number of items than others, potentially allowing for more scope to indicate ‘variety’ within a limited recall period. It is also acknowledged that the categories used for the purpose of this study were generally broad and collapsed across foods that may be further distinguished based on nutritional content, particularly where diet quality specifically is of interest (for a more recent example with UK Biobank dietary data, see ref. 72).
Considering the findings of this study, two key issues are acknowledged. First, it is important to consider the possibility of a bidirectional relationship between dietary variety and body weight outcomes, whereby having a lower body weight (and body fatness) can predict healthier eating patterns. Bidirectionality has previously been discussed in relation to other predictors of body weight outcomes and food intake, such as weight stigma(Reference Major, Tomiyama and Hunger73) and social effects on eating(Reference Robinson, Benwell and Higgs74). Though this was not directly explored within models presented here, results do support relevant negative associations between intake of dietary variety for low energy density food groups and body weight outcomes. In light of these associations, future research should explore the direction of possible ‘causality’, whereby potential reciprocal predictive pathways between body weight and dietary variety are observed in cross-panel, time-lagged models of effects over a longer period with more frequent time points (e.g. a similar approach has been adopted to explore longitudinal associations between BMI and internalising symptoms in a cohort study(Reference Patalay and Hardman75)).
Second, results of this study further highlight potential sample bias. Though educational attainment generally aligns with trends in the UK population for this age group(Reference Davies, Dickson and Davey Smith76), and we note the variability of the eligible sample for BMI (including participants with potential underweight and obesity), UK Biobank participants in particular have been found to be more likely to live in areas with less deprivation, have a lower average BMI, be less likely to have obesity and have lower incidence of self-reported health conditions, such as CVD, diabetes and cancers(Reference Fry, Littlejohns and Sudlow77). Therefore, it is important to acknowledge potential limitations of generalisability for such population samples that may be susceptible to ‘healthy’ volunteer bias (particularly when using a subset of the sample).
Conclusions
Contrary to predictions, findings of this study highlight a direct association between overall dietary variety and body weight, that indicates lower BMI and body adiposity in relation to greater variety, and may have particular implications for assisting body weight management and diet quality. Though there was little evidence to support the predicted moderated mediation effect of dietary variety on body weight outcomes when considering the role of cumulative portion size and energy density in this relationship, this study also further supports dietary variety as a factor associated with increased food intake. Further research is needed to explore the influence of these associations over a longer period, particularly as this relates to variability in energy density across the consumer diet.
Acknowledgements
This research has been conducted using the UK Biobank Resource under Application Number 53159.
This work was supported by the ESRC Wales Doctoral Training Partnership (Project Reference: ES/P00069X/1, Studentship 1 947 139). For the purpose of Open Access, the author has applied a CC BY public copyright licence to any Author Accepted Manuscript version arising from this submission.
R. E.: Conceptualisation, Methodology, Formal analysis, Writing – original draft, Writing – review and editing, and Project administration. M. P.: Conceptualisation, Methodology, and Writing – review and editing. M. D. L.: Conceptualisation, Methodology, and Writing – review and editing. A. J.: Conceptualisation, Methodology, Formal analysis, and Writing – review and editing. L. L. W.: Conceptualisation, Methodology, Writing – original draft, Writing – review and editing, Supervision, and Project administration.
The authors declare that they have no competing interests.
Supplementary material
For supplementary material/s referred to in this article, please visit https://doi.org/10.1017/S0007114523000156


 Open access