


The persistence and growth of socio-economic health inequalities continue to attract researchers, clinicians and politicians( Reference Viner, Ozer and Denny 1 – Reference Bleich, Jarlenski and Bell 3 ). These differences can arise during childhood and determine future health( Reference Gupta, de Wit and McKeown 4 ); thus, it is very important to identify them at early stages. Even though it is well recognised that lower socio-economic groups have poorer health( Reference Pampel, Krueger and Denney 5 ), its determinants are complex. Diverse theories have been developed to explain the mechanisms behind the inequalities in health, such as material conditions, occupational, psychosocial, behavioural and biomedical factors( Reference Aldabe, Anderson and Lyly-Yrjanainen 6 – Reference Due, Krolner and Rasmussen 9 ). Quality of diet has been observed to be associated with indicators of socio-economic status (SES), such as parental education, household income and parental occupation( Reference Johansson, Thelle and Solvoll 10 – Reference James, Nelson and Ralph 12 ). There is consistent evidence that lower SES individuals are more likely to follow diets that are associated with lifestyle-related diseases( Reference Shahar, Shai and Vardi 13 , Reference Dekker, Nicolaou and van Dam 14 ). Children of parents from the lowest income, occupation and education groups tend to consume more sweets, soft drinks and processed meat and less fruits and vegetables than their counterparts( Reference Vereecken, Inchley and Subramanian 15 , Reference Vereecken, Legiest and De Bourdeaudhuij 16 ). In general, researchers are interested in dietary patterns to assess the overall diet of an individual rather than the consumption of single food items( Reference Kell, Judd and Pearson 17 ). Only when the entire pattern is considered, combined effects of various nutrients and foods can be observed, allowing the establishment of a relationship between diet and disease risk( Reference Fung, Rimm and Spiegelman 18 ).
Principal component analysis (PCA) and cluster analysis (CA) are two common methods used to derive dietary patterns. PCA identifies common patterns of food consumption on the basis of linear combinations of foods, whereas CA allows for grouping individuals according to their overall diet. For this reason, CA allows for a better understanding of dietary patterns in children and for identification of possible groups of children with an overall unhealthy/healthy diet.
Using this technique, a recent analysis based on the data of the European IDEFICS study (Identification and prevention of Dietary- and lifestyle-induced health EFfects In Children and infantS) explored the associations between dietary patterns and classical SES indicators over a 2-year period. Children with higher educated parents and higher household income were found to be more likely in a healthy cluster (higher frequency of consumption of fruits, vegetables and wholemeal products) and less likely in a sweet cluster (higher frequency of consumption of sweet foods and sweetened drinks) at baseline and 2 years later, whereas migrants were more likely to be in a processed cluster (higher frequency of consumption of snacks and fast foods). To better understand the relationship between social inequalities and dietary patterns, the present study goes beyond the previous IDEFICS investigation( Reference Fernandez-Alvira, Bornhorst and Bammann 19 ) and studies not only the association between classical SES and dietary patterns but also the indicators of social vulnerability and the influence of accumulated vulnerability( Reference Parikka, Maki and Levalahti 20 ). These are less frequently explored in the literature. Given the evidence on the social gradient in health, this study focuses on vulnerable groups compared with non-vulnerable groups( Reference Marmot 21 ). Most previous studies have investigated the association between family structure( Reference Formisano, Hunsberger and Bammann 22 , Reference Chen and Escarce 23 ), social support( Reference Oliveira, Rostila and de Leon 24 ) and employment status( Reference Hope, Pearce and Whitehead 25 ) with obesity. Nevertheless, there have been several investigations that have looked into these variables and their relationship with children’s dietary patterns. In particular, family structure has been found to have a relationship with children’s dietary patterns. Children from single-parent families were shown to be at higher risk of adopting unhealthier dietary patterns than children living with two parents( Reference Strauss and Knight 26 , Reference Nobre, Lamounier and Franceschini 27 ) because of the absence of adults in the home to monitor mealtimes( Reference Stewart and Menning 28 ). Having a small social network has also been shown to be associated with a reduced consumption and lower variety of vegetables and fruits( Reference Conklin, Forouhi and Surtees 29 ). Regarding vulnerabilities related to migrant status, children whose parents had a migrant background were found to have a more sedentary way of life and adverse dietary patterns, as compared with non-migrant children, owing to socio-economic and cultural factors( Reference Labree, van de Mheen and Rutten 30 ). Finally, children of unemployed mothers have been thought to be related to a higher consumption of energy-dense drinks than children of employed mothers( Reference Gevers, Kremers and de Vries 31 ). Studying these vulnerabilities in relation to dietary patterns may give further insights into the association between vulnerabilities and children’s overall eating habits and into the possibly increased adverse influence on dietary patterns when co-occurrence of vulnerabilities exists.
In this regard, four vulnerable groups were investigated in the present study: (1) children from single-parent families, (2) children whose parents lacked a social network, (3) children of migrant origin and (4) children with either one or both parents unemployed( Reference Bammann, Gwozdz and Lanfer 32 ). The present study aimed to explore (i) the cross-sectional and prospective associations between being a member (v. non-member) of a vulnerable group and dietary patterns in European children and to study (ii) the association of accumulated vulnerability with dietary patterns.
Methods
Study population
IDEFICS is a multi-centre, prospective cohort study, conducted with a school and community-based obesity prevention intervention embedded in two selected regions comparable in their infrastructural, socio-demographic and socio-economic characteristics( Reference Gwozdz, Sousa-Poza and Reisch 33 ) in eight European countries (Belgium, Cyprus, Estonia, Germany, Hungary, Italy, Spain and Sweden). The IDEFICS study was conceived to collect information on risk factors and habits and to design, implement and evaluate an obesity prevention intervention. For comprehensive information about IDEFICS, a detailed description is given by Ahrens et al.( Reference Ahrens, Bammann and Siani 34 ). In brief, a total of 16 228 children aged 2–9 years were examined from September 2007 to June 2008 in the different countries at baseline (T0). The first follow-up (T1) took place 2 years later (September 2009–June 2010), where 11 038 children aged 4–11 years were re-examined. After excluding children with >50 % of missing values in the food frequency section of the Children’s Eating Habits Questionnaire (CEHQ-FFQ) and children with no socio-economic data at T0 and T1, the present analysis finally included 9301 children (50·3 % boys, 49·7 % girls) (see also Fig. 1).
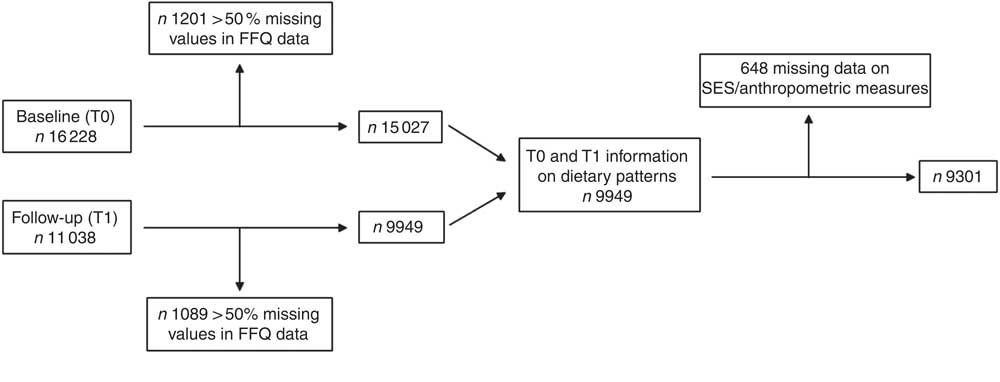
Fig. 1 Final study sample. SES, socio-economic status.
Parents or legal guardians gave their written informed consent for examinations and data collection for their children, whereas children expressed oral consent. Ethics approval was obtained from the research ethics authority of each participating centre.
Measurements
Dietary data
Dietary data were collected at both T0 and T1 from the food frequency section of the CEHQ-FFQ. This FFQ was a self-administered screening tool in which parents were asked to report usual at-home consumption frequencies of forty-two food items of fourteen food groups, being shown to be positively or negatively associated with obesity and overweight in the preceding 4 weeks, not referring to meals at the school canteen or childcare centres. Therefore, this method did not include quantitative intakes and did not capture foods eaten out of parental control( Reference Lanfer, Hebestreit and Ahrens 35 ). Results from previous IDEFICS investigations indicate that the CEHQ-FFQ gives reproducible estimates of consumption frequencies in European children( Reference Bel-Serrat, Mouratidou and Pala 36 ). The relative validity of the food questionnaire was also tested, comparing estimates from the CEHQ-FFQ with the mean intakes from two repeated 24-h dietary recalls. Moderately strong correlations were observed for the most frequently consumed foods( Reference Huybrechts, Bornhorst and Pala 37 ). The categories of consumption were as follows: ‘never/less than once a week’, ‘1–3 times a week’, ‘4–6 times a week’, ‘1 time/d’, ‘2 times/d’, ‘3 times/d’, ‘4 or more times/d’ and ‘I have no idea’. By assigning frequencies to the different responses, these categories were converted to a continuous scale ranging from 0 up to 30 times per week.
Covariates
Weight categories
Anthropometric measurements were assessed at T0 and T1 according to standardised procedures in all participating countries. Barefoot body height was measured to the nearest 0·1 cm by trained staff using a portable stadiometer (SECA 225; Seca GmbH & KG). Body weight in kg was measured using a child-adapted version of the electronic scale TANITA BC 420 SMA, with the children in fasting state and wearing only light clothes. BMI was calculated by dividing body weight in kg by body height in m2 and then transformed into age- and sex-specific z-scores( Reference Cole, Freeman and Preece 38 ). Weight groups (thin/normal v. overweight/obese) were categorised using age- and sex-specific cut-off points according to criteria of the International Obesity Task Force( Reference Cole and Lobstein 39 ).
Demographic and socio-economic data were collected from a standardised parent report questionnaire at baseline and were used to define the variables of classical SES indicators and vulnerable groups.
Classical socio-economic status indicators
Education: parents were asked to indicate the highest level of education of both themselves and their partners. The particular response categories for each country were coded according to the International Standard Classification of Education (ISCED 1997) and re-categorised into the following three categories: low (ISCED level 0–2), medium (ISCED level 3–4) and high (ISCED level 5–6)( 40 ).
Income: parents also provided information on the monthly net income of the household after taxes and deductions responding to nine country-specific categories (1: from the lowest category to 9: the highest category). The category cut-off points were designed to be country specific according to a fixed scheme based on the median equivalent income, thus guaranteeing comparability between countries. The results were organised into three categories: low( Reference Viner, Ozer and Denny 1 – Reference Bleich, Jarlenski and Bell 3 ), medium ( Reference Gupta, de Wit and McKeown 4 – Reference Aldabe, Anderson and Lyly-Yrjanainen 6 ) and high income( Reference Skalicka, van Lenthe and Bambra 7 – Reference Due, Krolner and Rasmussen 9 ).
Occupation: parents were further asked to specify their occupational position with eighteen possible options, which were later transformed into the three-class version of the European Socio-economic Classification: working class, intermediate and salariat( Reference Harrison and Rose 41 ).
For occupation and education, the highest level of either the mother or the father was taken into account for the purpose of the study.
Definition of vulnerable groups
A total of four vulnerabilities were defined as our main exposures using baseline information:
Social network: three categories were used based on parental response to the question of how many persons they could rely on in case of need including their family: low (0–1 person), taken as the vulnerable category, medium (2–3 persons) and high (>3 persons), considering the last two categories as non-vulnerable.
Family structure: single-parent families (vulnerable group) were defined as such if only one adult was living in the household or if the child was mostly living with the mother or with the father. Other types of families were considered as non-vulnerable.
Origin of the parents: a migrant background (vulnerable group) was assumed if one or both parents were born in a country different from where the study took place. Children whose parents were born in the local country were considered as non-migrant, and therefore non-vulnerable.
Employment status: parents were asked to describe their main occupational status within ten given categories, finally recoded into the following five groups: at least one of the parents was unemployed or living on social assistance or welfare (considering only this group as vulnerable); at least one of the parents was a homemaker or on temporary leave (e.g. maternal or paternal leave); at least one of the parents was in a part-time job (<30 h a week), both parents were in a full-time job (>30 h a week) and other combinations (e.g. parents were attending school or university or they were retired, including early retirement).
A total vulnerability score was calculated by adding up the numbers of vulnerabilities a child was exposed to. In all, four vulnerability indicators (low social network, single-parent family, migrant background, unemployed) and two more vulnerabilities derived from classical SES indicators (low-income and low-education) were considered. Occupation status was not included as it was highly correlated with employment status. On the basis of this approach, the total vulnerability score ranged from 0 (the child had none of the six vulnerability indicators) to 6 (the child had all six vulnerability indicators) and was divided into four categories (three to six vulnerabilities, two vulnerabilities, one vulnerability and no vulnerability).
Statistical analyses
To identify clusters of children with common dietary patterns, K-means cluster analysis was applied, based on the relative frequencies of consumption. The relative frequency of consumption was calculated for each food item by dividing the frequency of consumption of a specific food item by the total frequency of consumption of all food items included in the CEHQ-FFQ.
A total of three consistent clusters were identified at both T0 and T1, as previously described( Reference Fernandez-Alvira, Bornhorst and Bammann 19 ): (1) a processed cluster characterised by a higher-than-average consumption frequency of snacks and fast foods compared with the whole study group including all countries; (2) a sweet cluster, showing a higher-than-average consumption frequency of sweet foods and sweetened drinks; and (3) a healthy cluster, characterised by a higher-than-average consumption frequency of fruits, vegetables and wholemeal products. Details on the CA procedure and validation are given in the study by Fernandez-Alvira et al.( Reference Fernandez-Alvira, Bornhorst and Bammann 19 ).
Multinomial mixed models were used to assess the cross-sectional and longitudinal associations between the four exposures (social network, family structure, migrant origin and employment status) and children’s dietary patterns (processed, sweet, reference category: healthy). In the cross-sectional analysis, for each exposure assessed at T0, a model with basic adjustment (baseline age, sex and BMI z-score) and with full adjustment (basic model plus classical SES indicators parental income, education and occupation) was estimated to assess the associations with T0 dietary patterns. All models included a random kindergarten/school and a random country effect to account for the clustered study design. Analogously, in the longitudinal analysis, dietary patterns assessed at T1 were related to the T0 exposures again with the basic and full adjustment, adding a variable indicating intervention v. control region and adjusting for baseline dietary patterns.
Before model building, correlations among SES indicators were checked, resulting in the exclusion of occupation status in models with employment status as the main exposure to avoid collinearity problems.
The significance level was set at 0·01 to account at least partially for multiple testing. The analyses were performed using Statistical Package for the Social Sciences (version 22.0; SPSS, Inc.).
Results
Table 1 summarises the distributions of age, sex, weight category, country, social network, family structure, migrant status, employment status and classical SES indicators in the three clusters at T0 and T1.
Table 1 Description of the study population, stratified by cluster membership at baseline (T0) and follow-up (T1) (Number of participants and percentages)

ISCED, International Standard Classification of Education; ESEC, The European Socio-economic Classification.
* Social network was assessed with a question regarding how many persons they could rely on in case of need including their family: low (0–1 person), medium (2–3 persons) and high (>3 persons).
Concerning T0, older children represented a lower percentage in the healthy cluster (29 %) compared with younger children (35·2 %). A higher percentage of both boys and girls were allocated to the processed cluster (47·8 and 47·4 %, respectively) compared with the other two clusters. Children who were obese had a higher percentage in the processed cluster (62·3 %) compared with the sweet (12·9 %) and healthy (24·8 %) clusters.
Regarding dietary patterns in the different countries, the processed cluster was mainly observed in Spain, Italy and Cyprus. The sweet cluster was mostly represented by Belgian and German children, whereas almost all the Swedish children were in the healthy cluster. The proportion of children whose parents reported to have a small social network was higher in the processed cluster. Children from single-parent families represented a lower percentage in the healthy cluster (27·8 %) than the other two clusters. Children with migrant origin represented a lower percentage in the sweet cluster (14·9 %) and a higher percentage in the processed cluster (52·6 %) compared with non-migrant children. The proportion of children with both parents in a full-time job was higher in the healthy cluster (36·9 %) compared with children whose parents were unemployed (22·1 %). Finally, children from families with low education, income or occupation were more often in the processed cluster compared with the other two clusters. The proportion of children whose parents did not answer these questions, represented as missing category, was higher in the processed cluster.
Regarding T1, results were similar to T0, except for the obese (56·4 %) and overweight (54·5 %) children who represented this time a higher percentage in the healthy cluster compared with the sweet or processed cluster. In general, the percentage of children allocated to the healthy cluster was much higher in T1 (51·7 %) than in T0 (31·9 %). Children’s BMI and socio-economic data of children lost to follow-up were analysed to study a possible selection bias. Children lost to follow-up showed a higher BMI and on average belonged to a lower SES group than those who were finally included in the present study.
Table 2 presents the OR and 99 % CI for the cross-sectional associations between the four vulnerability indicators and dietary patterns at T0 for the basic and fully adjusted models. In the basic models, children whose parents reported to have low (OR 1·31; 99 % CI 1·01, 1·70) or medium social network (OR 1·39; 99 % CI 1·17, 1·64) and children of migrants (OR 1·45; 99 % CI 1·15, 1·83) were more likely to be in the processed cluster than in the healthy cluster at T0. No statistically significant associations were observed for the other groups, but the associations still pointed to the expected directions. When adding the classical SES indicators to the models (full adjustment), the OR were slightly attenuated, but overall the results remained unaltered. Children with one or both parents considered as homemakers or on a parental leave (OR 0·74; 99 % CI 0·60, 0·92) were less likely to be in the processed cluster compared with the healthy cluster in the fully adjusted model only.
Table 2 Cross-sectional associations between the four vulnerability indicators and dietary patterns at baseline (T0) (reference: healthy) for the basic and fully adjusted modelsFootnote * (Multinomial linear mixed model: odds ratios and 99 % confidence intervals)
* All models included random effects (school, country) to account for the study design.
† Basic models at T0 were adjusted for baseline age, sex and z-scores of BMI by Cole & Lobstein(39).
‡ Fully adjusted models at T0 were additionally adjusted for baseline classical SES indicators (education, occupation and income).
§ Social network was assessed with a question regarding how many persons they could rely on in case of need including their family: low (0–1 person); medium (2–3 persons) and high (>3 persons).
Table 3 shows the OR and 99 % CI for the longitudinal associations between the four vulnerability indicators at study baseline T0 and dietary patterns after the 2-year follow up (T1) for the basic and fully adjusted models. Associations were slightly attenuated in the fully adjusted model but pointed to the same directions as in the cross-sectional models.
Table 3 Longitudinal associations between the four vulnerability indicators at baseline and dietary patterns at follow-up (T1) (reference: healthy) for the basic and fully adjusted modelsFootnote * (Multinomial linear mixed model: odds ratios and 99 % confidence intervals)
* All models include random effects (school, country) to account for the study design.
† Social network was assessed with a question regarding how many persons they could rely on in case of need including their family: low (0–1 person), medium (2–3 persons) and high (>3 persons).
‡ Basic models at T1 were adjusted for baseline age, sex and z-scores of BMI by Cole & Lobstein(39) and for study region (intervention v. control).
§ Fully adjusted models were additionally adjusted for baseline classical socio-economic indicators (education, income and occupation except for employment status model) and dietary pattern at T0.
Table 4 displays the association between the accumulation of vulnerabilities assessed at baseline and dietary patterns at T0 and T1. A higher number of vulnerabilities was associated with a higher probability of children being in the processed cluster compared with the healthy cluster in both T0 and T1, where the OR increased with the number of present vulnerabilities: one vulnerability (OR 1·19; 99 % CI 0·98, 1·45); two to three vulnerabilities (OR 1·70; 99 % CI 1·31, 2·23); and four to six vulnerabilities (OR 1·78; 99 % CI 1·21, 2·62). Similar results were found for the T1 dietary patterns with associations showing the same trend but being slightly attenuated.
Table 4 Association between the accumulation of vulnerabilities at T0 and dietary patterns at T0 and T1 (reference: healthy)Footnote * (Multinomial linear mixed model: odds ratios and 99 % confidence intervals)
* All models include random effects (school, country) to account for the study design.
† Models at T0. Basic models were adjusted for baseline age, sex and z-scores of BMI by Cole & Lobstein(39).
‡ Models at T1 were additionally adjusted for age, sex, z-score of BMI by Cole & Lobstein(39) and study region (intervention v. control).
§ A total vulnerability score was calculated by adding up the scores (1 v. 0) of the six vulnerability indicators (low social network, single-parent family, migrant background, unemployed, low income and low education). Total vulnerability score ranged from 0 (the child has none of the six vulnerability indicators) to 6 (the child has all six vulnerability indicators).
In order to check whether the effects of vulnerabilities are independent of each other, we also ran the model adding not only the classical SES indicators (education and income) but also the other four social vulnerabilities together into one model. However, the results remained similar (significance remained and OR were in the same magnitude). Therefore, only separate models for vulnerabilities are shown.
Discussion
The present study investigated the association between belonging to a vulnerable (v. non-vulnerable) group and dietary patterns (processed, sweet and healthy) over a 2-year period in children aged 2–9 years participating in a European study. This study found that children whose parents lack a social network and children with a migrant origin had a higher risk of having a processed dietary pattern at T0 and T1 compared with non-vulnerable groups, and this result was cumulative when adding up vulnerabilities. In particular, those showing four to six vulnerabilities at baseline were 65 % more likely to being in the processed cluster at follow-up when compared with those with no vulnerabilities. In the course of obesity, the importance of SES is well established, but there is a lack of research determining the impact of SES and interrelated factors such as vulnerable groups over dietary patterns( Reference Mechanic and Tanner 42 , Reference Ranjit, Wilkinson and Lytle 43 ). According to our results, for most vulnerabilities, when adding the classical SES indicators, associations with dietary patterns were slightly attenuated. This means that these associations may be partly explained by classical SES variables; however, associations of vulnerable groups independent of classical SES indicators were present. For children of parents who were homemakers and/or on parental leave, associations appeared only in the fully adjusted model at baseline.
Changes in vulnerability from T0 to T1 were quite rare between the vulnerable groups studied, which was the reason for not studying changes in vulnerabilities in the present analysis.
Respondents with missing socio-economic information may not be a random subset of population-based survey participants, and excluding records with missing income information from analyses may bias study results( Reference Kim, Egerter and Cubbin 44 ). For this reason, missing values of socio-economic data were coded as a separate category.
In a sensitivity analysis, models were additionally estimated stratified by country. For two countries, the model could not be estimated as most of the children were mainly allocated just in one cluster, particularly in the processed (Cyprus) and healthy cluster (Sweden). Moreover, in spite of the fact that in some countries the model could run satisfactorily, the small sample of some categories led to unstable results. For these reasons, no country-specific results were presented.
The findings of our study are in line with the results of previous studies despite some disparities being found. Several studies have explored the relationship between different socio-economic and cultural factors and dietary patterns( Reference Fernandez-Alvira, Bammann and Pala 45 ). A result from the IDEFICS study showed a strong inverse association of SES with the processed pattern, suggesting that children of parents with lower SES were at a higher risk of developing unhealthy dietary behaviours( Reference Neumark-Sztainer, Hannan and Story 46 ). According to our conclusions, family structure was not significantly associated with any dietary pattern in accordance with some studies( Reference Sweeting and West 47 ). However, different results can be found in the literature. A recent study concluded that children living with both parents had higher scores for ‘fruits’ and ‘milk and dairy products’ groups compared with children living with one parent( Reference Baek, Paik and Shim 48 ).
Regarding the relationship between social network and dietary patterns, we found a statistically significant association between children whose parents reported to have a low or medium social network with processed patterns, which are in consonance with previous studies that associated infrequent contact with friends and family with unhealthier patterns( Reference Conklin, Forouhi and Surtees 29 ).
Concerning children of migrant origin, the present study revealed that these children were more likely to have a processed dietary pattern and less likely to have a sweet dietary pattern. Similar to our results, a systematic review suggested that dietary habits of some migrant groups living in Europe were more likely to become less healthy as they increase the consumption of processed foods. In contrast to our results, they found that children of migrant origin consumed higher levels of sugar( Reference Gilbert and Khokhar 49 ).
We found no statistically significant associations between children’s dietary patterns and parental employment status, except for children whose parents were homemakers or on parental leave. In these cases, the children were more likely to be allocated to the processed cluster independently of classical SES indicators.
This outcome contradicted the conclusions of Sweeting & West( Reference Sweeting and West 47 ) who found that children of homemakers were more likely to have a less healthy pattern compared with children of mothers working part-time, full time or those who were unemployed. Along with the results of our study, some investigations have found no association between time mothers spent with their children and maternal work outside the home with any dietary pattern( Reference Villa, Silva and Santos 50 – Reference Gwozdz, Sousa-Poza and Reisch 52 ). Nevertheless, previous findings, in contrast to our study, suggest an association between maternal employment and unhealthier dietary patters due to time constraints and reduced supervision of meals( Reference Crepinsek and Burstein 53 ). Employed mothers were more likely to have fast food for family meals, spent less time preparing food and provided less encouragement for their child to eat healthy food( Reference Bauer, Hearst and Escoto 54 ), which resulted in a higher consumption of processed foods by the child( Reference Rinaldi, Macedo and Mota 55 ).
Some limitations of the present study should be acknowledged. First, the IDEFICS study is not representative of either the European population or the countries participating, as each survey centre only covered a delimited geographic area within a country. There were some groups (from the lowest or the highest SES) that could be underestimated as this study was voluntary, and usually these populations are less likely to take part in research, making the extrapolation of the results to each respective country difficult. Moreover, a selection bias cannot be precluded as there were some participants (overall those who present a higher BMI and lower SES groups) who did not complete all the information required or did not continue the study at follow-up. A further limitation is the fact that clusters are typically labelled quite arbitrarily, as their objective is to globally characterise the dietary pattern of each group. In our analysis, the healthy cluster was characterised by a more frequent consumption of fruits, vegetables and wholemeal foods and a less frequent consumption of simple sugar and junk foods compared with the other groups. This, however, does not imply that dietary recommendations were met.
Other limitations that should be considered include the dietary assessment method. As the CEHQ-FFQ was limited to forty-two items being shown to be positively or negatively associated with obesity and overweight, it did not cover the whole diet. Further, it was not designed to assess portion sizes. Finally, in this questionnaire, parents reported usual at-home consumption frequencies; thus, the number of meals was limited to those under parental control. Therefore, incomplete reports of food and beverage consumption may also contribute towards reporting bias( Reference Pala, Lissner and Hebestreit 56 ).
A special strength of the present study is the fact that, to our knowledge, no research has been carried out to date concerning the association of vulnerabilities such as social network, family structure and employment status with dietary patterns and the association of vulnerabilities accumulated in a longitudinal study. A large sample size of eight different countries and use of standardised procedures and validated instruments are also strengths of our study.
Conclusions
The current study suggests complex relationships between vulnerabilities and dietary patterns and highlights the influential role of early socio-economic deprivations in children. A future challenge is to promote healthier diets in children with cumulative vulnerabilities in order to make those in disadvantaged settings have healthier dietary patterns and potentially help in decreasing levels of obesity. Thus, policymakers should pay special attention to vulnerable groups as a higher number of vulnerabilities seems to increase the risk of unhealthy behaviours.
Acknowledgements
This study has been carried out as a part of the IDEFICS Study (http://www.idefics.eu).
The authors gratefully acknowledge the financial support of the European Community within the Sixth RTD Framework Programme Contract no. 016181 (FOOD). I. I. has been financed by the FPU (grant reference FPU014/00922) Predoctoral Programmes (Spanish Ministry of Education and Science). The authors thank the IDEFICS children and their parents who generously volunteered and participated in this project.
The authors’ contributions were as follows: I. I. carried out the statistical analysis and drafted the manuscript. C. B. designed the statistical analyses. K. B., J. M. F.-A., W. G., V. P. and P. R. developed the measurement instruments; and G. E., D. M., L. A. M. and T. V. supervised the national data collection procedures. All authors read and critically reviewed the manuscript.
The authors declare that there are no conflicts of interest.


