


The metabolic syndrome (MetS) was defined by a WHO expert group as a complex disturbance of the metabolism of lipid (obesity, dyslipidaemia), carbohydrate (CHO; glucose intolerance), protein (microalbuminuria and hyperuricaemia) and arterial hypertension in 1998(Reference Boppidi and Daram1). In 2005, the International Diabetes Federation issued a new standard for a more precise definition of the MetS by emphasising abdominal obesity, instead of BMI, since abdominal obesity is a prerequisite for the MetS diagnosis(Reference Cornier, Dabelea and Hernandez2, Reference Paniagua3). The International Diabetes Federation definition of the MetS is any three of the following five factors: (1) high TAG, (2) low HDL-cholesterol, (3) high blood pressure, (4) elevated fasting blood glucose and (5) large waist circumference. The common factor defining the MetS is increased insulin resistance(Reference Kim and Feldman4). People with the MetS are susceptible to developing obesity, hyperglycaemia, hypertension, dyslipidaemia, hypertension and hyperinsulinaemia. Therefore, persons with the MetS are susceptible to heart disease, cerebrovascular disease and diabetes.
The MetS is more likely to occur in Asians than non-Asians with the same BMI. Asians are prone to develop the MetS even though they are not as obese as Europeans and Americans(Reference Kassi, Pervanidou and Kaltsas5). Most obese patients in Europe and America are affected by the gene encoding the ‘fat mass and obesity-associated protein’(Reference Cameron, Shaw and Zimmet6). The aetiology of the MetS susceptibility in Asians has not been studied. However, it may be associated with genetics and environmental factors. Asians have traditionally consumed unrefined grains as a staple food. Genetic variations may have evolved to cause high insulin sensitivity when a large amount of CHO is consumed at a time, less insulin is used to normalise serum glucose levels in Asians due to high insulin sensitivity(Reference Park, Park and Jang7). However, Asians have a smaller number of islets than Caucasians which gives them less insulin secretory capacity and a propensity to easily develop impaired glucose metabolism and eventually type 2 diabetes if they become insulin resistant(Reference Yoon, Lee and Kim8). In Asia, the Westernisation of lifestyles, including consumption of refined CHO and high-fat foods and engaging in less physical activity, increases insulin resistance(Reference Hu9). Asians tend to become dyslipidaemic with low HDL-cholesterol and high TAG concentrations although serum total and LDL-cholesterol concentrations are not as high as seen in Caucasians(Reference Bilen, Kamal and Virani10). Thus, the genetic background may influence the prevalence of the MetS.
In addition to genetic variation as a non-modifiable risk factor, there are modifiable environmental risk factors for the MetS. The modifiable risk factors are dietary patterns, physical activity, smoking and drinking, whereas non-modifiable risk factors are age, sex, oestrogen deficiency and ethnicity(Reference Gupta and Gupta11). Among the risk factors, age and body fat are related to low-grade systemic inflammation, which may induce or exacerbate the MetS(Reference Andersen, Murphy and Fernandez12). Previous studies have demonstrated that a high-fat diet, especially saturated fat, is a risk factor for the MetS since it increases body fat in mainly Caucasians(Reference DiNicolantonio, Lucan and O’Keefe13). However, a high-CHO diet is also involved in the development of the MetS, especially in Korea(Reference Park, Ahn and Lee14). A very low fat (<15 energy % (En%)) and high CHO intake (>70 En%) increases the risk of the MetS in Korean adults. High-CHO diets (>57·4 En% in men and >59·1 En% in women) are associated with a low-serum HDL-cholesterol in US men and high-serum TAG in US women(Reference Lee, Song and Song15). These nutrient intakes and lifestyles can interact with genetic variants to lead to the development of the MetS. Interactions with environmental factors, including nutrient intake, can be explained by identifying multiple genetic variants that explain the environmental impacts on the prevalence of the MetS in Asians.
Therefore, we hypothesised that the genetic risk scores (GRS) of selected genetic variants from the genome-wide association study (GWAS) would modulate the risk of the MetS, and that the GRS would have an interaction with nutrient intake and lifestyle. The hypothesis of the present study was examined in middle-aged adults in the Ansan/Ansung cohort of Korean Genome and Epidemiology Study (n 8840).
Methods
Baseline characteristics of subjects
A total of 8840 participants between 40 and 69 years of age from the rural communities of Ansung and the urban communities of Ansan in Korea voluntarily participated, including 4182 men and 4658 women. The present study was approved by the Institutional Review Board of the Korean National Institute of Health for the Korean Genome and Epidemiology Study. A written informed consent was obtained from all participants and family members. Participants received financial reimbursement. The study exclusion criteria were as follows: obesity secondary to hypothyroidism or Cushing’s disease, severely debilitating disease or having undergone anti-obesity treatment or weight loss during the past 6 months.
Baseline characteristics including age, sex, income, smoking history, drinking and physical fitness, as well as physical characteristics: height, weight and other physical health conditions and polymorphic genotypes were recorded. Daily total physical activity was calculated by summing the multiplication of each activity level by time of physical activity and was scored as 1, 2 and 3 for light, moderate and heavy activity, respectively. Smoking status was categorised into current smoker, past smoker and never-smoker. Smoking was defined as having smoked more than ten packs during the entire life. Alcohol consumption was determined by the participants’ drinking behaviours during the last month before the interview. Daily alcohol consumption was calculated by multiplying the frequencies of alcohol drinking by the average amount of alcohol each time and subjects were categorised as light drinker (<1 g/d), moderate drinker (1–20 g/d) and heavy drinker (>20 g/d). Coffee intake was calculated in the same way as was alcohol intake and it was divided into two groups with ten cups per week as the cut-point.
Anthropometry and biochemical parameters
Body weight and waist and hip circumferences were measured three times and the average values were used. Body fat was measured by tetrapolar bioelectrical impedance analysis using the Inbody instrument. Systolic and diastolic blood pressures were measured three times using the left arms in a sitting position, and the average values were used. Blood was collected in a heparin-treated tube in an overnight-fasted state, and plasma total cholesterol, HDL-cholesterol, TAG and glucose concentrations were measured using a Hitachi 7600 Automatic Analyzer (Hitachi). Serum insulin levels were also measured with an RIA kit (DiaSorin) by a gamma counter (1470 Wizard; Perkin-Elmer). LDL-cholesterol was calculated by the Friedwald equation (plasma total cholesterol–plasma HDL-cholesterol – plasma TAG/5). Homeostatic model assessment for insulin resistance and homeostatic model assessment for insulin secretion from β-cells were calculated by multiplying fasting plasma glucose (mmol/l) by fasting plasma insulin (pmol/l) and then dividing by 135 and by multiplying plasma insulin (pmol/l) by 3·33 and then dividing it by plasma glucose (mmol/l) minus 3·5.
Assessment of nutrient intake
Usual food intake estimated using a semi-quantitative FFQ which was validated by the 3-d food records to be reliable for estimating usual food intake(Reference Park, Zhang and Lee16). The semi-quantitative FFQ included 103 food items and their consumption was estimated by checking the frequencies of intake of one portion size. The consumption of each food item was calculated by multiplying food frequencies by the amount of food intake in one sitting which was scored as more than, equal to or less than the standard portion size as previously described(Reference Park, Zhang and Lee16). Nutrient intake (energy, CHO, fibre, protein, total fat, SFA, MUFA, PUFA and Na) was calculated from the daily food intakes collected by the semi-quantitative FFQ using the Can-Pro 2.0 software developed by the Korean Nutrition Society.
Definition of the metabolic syndrome
The MetS was defined using the 2005 revised National Cholesterol Education Program-Adult Treatment Panel III criteria for blood pressure, and plasma HDL-cholesterol, TAG, and glucose levels and the Korean Obesity Society criteria for blood glucose levels in the present study. Subjects having three or more of the following criteria were considered to have the MetS: (1) elevated blood pressure (average systolic blood pressure ≥130 mmHg or diastolic blood pressure ≥85 mmHg) or current blood pressure medication use, (2) low HDL-cholesterol level (<1·04 mmol/l for men and <1·30 mmol/l for women), (3) elevated serum TAG level (≥1·69 mmol/l) or current anti-dyslipidaemic medication use, (4) elevated fasting blood glucose level (≥6·11 mmol/l) or current anti-diabetic medication use and (5) abdominal obesity (waist circumference ≥ 102 cm for men and ≥88 cm for women).
Genotyping, SNP imputation and quality control
The genotyping and quality-control processes from the Ansan/Ansung cohorts were described in detail previously(Reference Kim and Han17). Deoxyribonucleic acid samples from the participants were isolated from their peripheral blood, and genotyping was conducted using the Affymetrix Genome-Wide Human SNP array 5.0 (Affymetrix). The genotypes were imputed with the IMPUTE (v2.644) containing the 1000 Genomes Phase I integrated variant call set release (version 3) and using the NCBI build 37 (hg19) as a reference panel. The genotypes were included with high imputation quality (proper info>0·5)(Reference Hwang, Lee and Go18). The accuracy of the genotyping was checked using the Bayesian robust linear modelling with Mahalanobis distance genotyping algorithm. The exclusion criteria for genotyping data were as follows: low genotyping accuracies (<98 %), high missing genotype call rates (≥4 %), high heterozygosity (>30 %) and sex bias.
Genome-wide association study for the metabolic syndrome and construction of genetic risk score
According to the MetS definition, subjects were categorised into two groups: the MetS group and the non-MetS group. After adjusting covariates associated with the MetS, GWAS was conducted with two groups to select SNP related to MetS risk using Gplink. The covariates for GWAS included age, sex, area, BMI, daily energy intake and the percentage of CHO and fat intakes from energy intake, Na intake, physical activity, smoking status, alcohol and coffee intake. Single nucleotide polymorphisms were selected at P<0·00001.
Single nucleotide polymorphisms were excluded for the final genetic model if they did not meet the following criteria: >0·2 minor allele frequency, P>0·05 for the Hardy–Weinberg equilibrium and r 2<0·6 of linkage disequilibrium in the loci of the same chromosome. Genetic risk scores were calculated from the four selected genetic variants from GWAS, by adding the number of risk alleles of each genetic variant. Genetic risk scores have the advantage of being able to combine the effects of all relevant gene variants and assess their combined contribution to disease states. The GRS was divided into three groups: 0–1 (low-GRS), 2–3 (medium-GRS) and 4–7 (high-GRS). The GRS explained the genetic impact on the MetS(Reference Kim, Kim and Daily19).
Statistical analysis
The present study used GPLINK version 2.0 (http://pngu.mgh.harvard.edu/purcell/plink) and SAS software version 7 (SAS Institute) for statistical analysis. Descriptive statistics of continuous and categorical variables are provided as arithmetic means and standard deviations and frequency distributions, respectively. Statistical analysis was conducted by one-way ANOVA and χ 2 tests for continuous and categorical variables, respectively. Multivariate logistic regression was used to calculate OR and 95 % CI for the risk of the MetS and individual components of the MetS associated with the GRS groups while controlling for covariates. To examine the interaction between the GRS group and nutrient intake, multiple regression models were used to ensure that the main effects and interaction terms were included in addition to potential confounders. When low and high groups of nutrient intake and lifestyles were divided for interaction, the high group was assigned by 75th percentiles of each parameters. Univariate under the general linear model was used to obtain the OR and 95 % CI for MetS risk associated with the GRS group based on the macronutrient intake while controlling the covariate.
Results
Selection of SNP for metabolic syndrome risk from genome-wide association study and characteristics of SNP
Four representative genes including apo A5 (APOA5)_rs651821, EF-hand Ca-binding domain 4B (EFCAB4B)_rs4766165, Zn finger protein 259 (ZNF259)_rs2160669 and apo B mRNA editing enzyme, catalytic polypeptide 1 (APOBEC1)_rs10845640 were ultimately selected for genetically increasing MetS risk after adjusting for covariates including age, sex, area and BMI (P<1·0 × 10-7) (Table 1). ZNF259_rs2160669 and APOA5_rs651821 were located in near-gene-3 and utr-5 of chromosome 11, respectively. EFCAB4B_rs4766165 and APOBEC1_rs10845640 reside in the intron of chromosome 12. Minor allele frequency was at about 0·2. All individual genetic variations were consistent with the Hardy–Weinberg equilibrium (P>0·05) criteria and positively correlated with the MetS (Table 1). The adjusted OR of four SNP were in the range of 1·2–1·5, indicating that the minor allele of each SNP increased the risk of the MetS by 1·2–1·5 compared with its major allele after adjusting age, sex, area and BMI (P<0·05).
Table 1. Characteristics of genetic variants that influence metabolic syndrome (MetS) risk selected by genome-wide association study in the Ansan/Ansung cohort
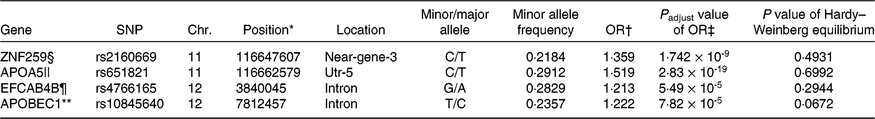
Chr., chromosome.
* The position of SNP in the chromosome.
† OR for each genetic variant to influence MetS risk.
‡ P value for OR to influence MetS risk after adjusted for covariates.
§ Zn finger 259.
|| apo A5.
¶ Ca release activated channel regulator 2A.
** apo B mRNA editing enzyme catalytic subunit 1.
Characteristics of the subjects
A total of 8840 subjects were included, including 3455 low-GRS alleles, 3927 medium-GRS alleles and 1458 high-GRS alleles that contained the 19·9, 24·4 and 30·0 % of the MetS subjects, respectively (Table 2). The prevalence of the MetS was much higher in the ascending order of the low-GRS, medium-GRS and high-GRS groups (Table 1). BMI was slightly, but significantly, higher in the high-GRS than the low-GRS group after adjusting for age, sex, residence area and BMI (Table 1). However, waist circumferences and total body fat were not significantly different among different GRS groups. Age was not significantly different among the three GRS groups but there was a significant sex difference. Men had higher frequencies in medium-GRS and women had higher frequencies in the low-GRS. Total activity status, smoking status and alcohol drinking frequencies were not significantly different among the GRS groups. Energy intake was significantly higher in the high-GRS group than the low-GRS group (P=0·010), but the percentage of energy intake based on estimated energy requirements was not significantly different. Macronutrient intakes including CHO, dietary fibre, proteins, fats, SFA, MUFA and PUFA were not influenced by GRS (Table 2). There was no significant difference in Na intake among GRS groups (Table 2).
Table 2. Basal characteristics of the subjects categorised by genetic risk score (GRS) of ZNF259, APOA5, EFCAB4B and APOBEC1 risk alleles after adjustments for age, sex, residence area and BMI in the Ansan/Ansung cohort
(Mean values and standard deviations; numbers of subjects and percentages)
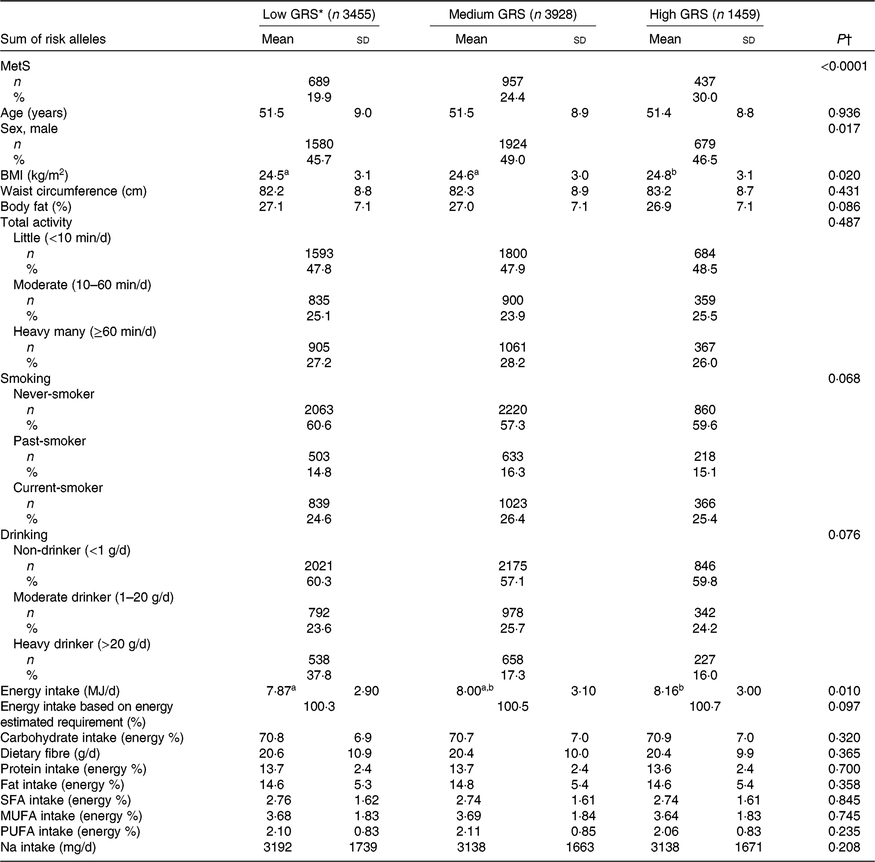
MetS, metabolic syndrome.
a,b Mean values in a row with unlike superscript letters were significantly different (P<0·05).
* GRS≤1, low GRS; 1<GRS≤3, medium GRS; GRS>3, high GRS.
† After P value adjusted for age, sex, residence area, BMI and daily energy intake.
Lipid profiles and glucose homeostasis
As shown in Table 3, the results showed that subjects with high-GRS alleles had lower serum LDL-cholesterol and HDL-cholesterol concentrations than the low-GRS although total cholesterol concentrations were not significantly different. The biggest difference among the factors related to the MetS was serum TAG concentrations (mmol/l): they were higher in the ascending order of low-GRS (1·65 (sd 0·93), medium-GRS (1·88 (sd 1·24)) and high-GRS (2·14 (sd 1·51); P<0·0001). Systolic blood pressure was higher in the high-GRS than the medium-GRS (P=0·041) but diastolic blood pressure was not significantly different among the GRS groups. Parameters related to glucose metabolism, including fasting serum glucose and insulin concentrations, homeostatic model assessment for insulin resistance (an index of insulin resistance), homeostatic model assessment for insulin secretion (an index of insulin secretion) did not differ among the GRS groups.
Table 3. Parameters related to the metabolic syndrome according to genetic risk score (GRS) derived from APOA5, EFCAB4B, ZNF259 and APOBEC1 risk alleles in the Ansan/Ansung cohort
(Mean values and standard deviations)
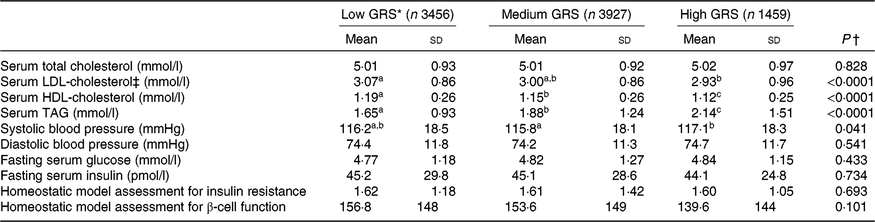
a,b,c Mean values in a row with unlike superscript letters were significantly different (P<0·05).
* GRS≤1, low GRS; 1<GRS≤3, medium GRS; GRS>3, high GRS.
† P value adjusted: adjusted for age, area, sex, education, income, BMI, smoking, alcohol intake, physical activity, energy intake.
‡ LDL-cholesterol was calculated by the Friedwald equation.
Adjusted OR of genetic risk scores for metabolic syndrome risk
The adjusted OR for MetS risk were higher by 1·447- (95 % CI 1·254, 1·669) and 1·922-fold (95 % CI 1·609, 2·297) in the high-GRS than the low-GRS (Table 4). In each individual component of the MetS, serum TAG and HDL-cholesterol concentrations and blood pressure were influenced by GRS, but waist circumferences and fasting serum glucose concentrations were not affected by GRS (Table 4). Serum TAG concentrations were higher by 2·135 (95 % CI 1·829, 2·491) in the high-GRS than the low-GRS group (P<0·0001) and serum HDL-cholesterol concentrations were lower by 1·685 (95 % CI 1·435, 1·978) in the high-GRS than the low-GRS group (P<0·0001). Blood pressure was also increased by 1·182-folds (95 % CI 1·018, 1·371) compared with the control (P<0·05).
Table 4. Adjusted risk for the metabolic syndrome (MetS) and its components according to genetic risk score (GRS) of ZNF259, APOA5, EFCAB4B and APOBEC1 risk alleles among the Ansan/Ansung cohort
(Odds ratios† and 95 % confidence intervals)
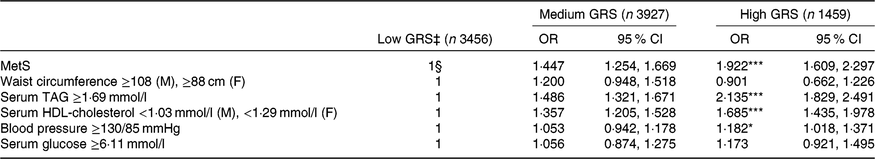
M, male; F, female.
Significantly different from the reference group: * P<0·05, ** P<0·01, *** P<0·001.
† OR after adjustment for age, sex, residence area, income, education, BMI, physical activity, smoking and drinking status, and daily energy intake.
‡ GRS≤1, low GRS; 1<GRS≤3, medium GRS; GRS>3, high GRS.
§ Reference.
Interaction of genetic risk scores with nutrient intake and lifestyles in the risk of the metabolic syndrome
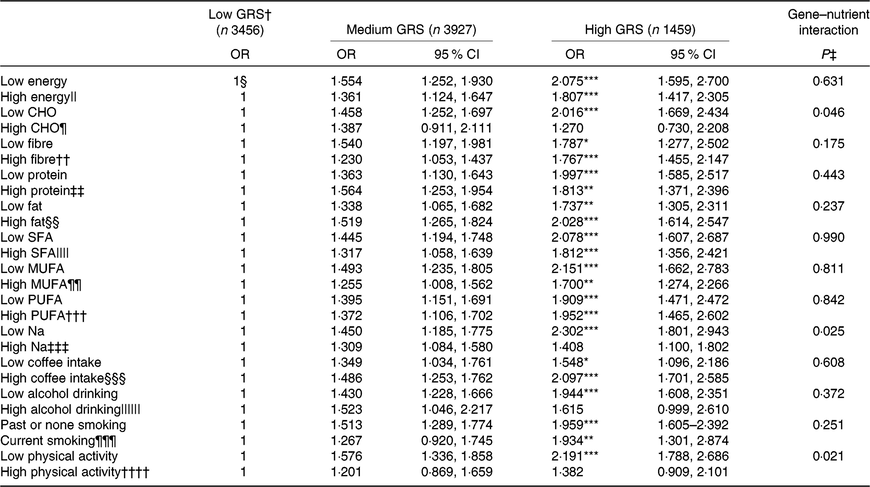
Energy, protein and fat intake did not have an interaction with GRS. In addition, there was no interaction of the intake of SFA, MUFA and PUFA with GRS in MetS risk (Table 5). The adjusted OR similarly increased in the high-GRS compared with the low-GRS in both low and high intake of energy, protein, SFA, MUFA and PUFA.
Table 5. Interaction of genetic risk score (GRS) of ZNF259, APOA5, EFCAB4B and APOBEC1 risk alleles with lifestyles including nutrient intake in metabolic syndrome risk in the Ansan/Ansung cohort
(Odds ratios and 95 % confidence intervals)
CHO, carbohydrate.
Significantly different from the reference group: * P<0·05, ** P<0·01, *** P<0·001.
† GRS≤1, low GRS; 1<GRS≤3, medium GRS; GRS>3, high GRS.
‡ Multivariate regression models include the corresponding main effects, interaction terms of gene and main effects (energy and nutrient intake), and potential confounders such as age, sex, residence area, income, education, BMI, physical activity, smoking and drinking status and daily energy intake.
§ Reference.
The cut-off points were assigned by 75th percentiles of each parameters for the high group and they were as following:
|| 100 % estimated energy intake, ¶ 65 % CHO intake, †† 15 g/d dietary fibre intake, ‡‡ 13 % protein intake, §§ 15 % fat intake, |||| 2·8 % SFA, ¶¶ 3·7 % MUFA, ††† 2·1 % PUFA, ‡‡‡ 1·6 g Na intake/4 MJ, §§§ ten cups of coffee per week, |||||| 20 g alcohol per d, ¶¶¶ smoking status and †††† 1 h moderate activity per d.
However, CHO intake had an interaction with GRS to increase MetS risk (P=0·046; Table 5). In low and high CHO intake with 65 En% cut-point, the incidence of the MetS was higher in the low CHO group than in the high CHO group. Also, when comparing the incidence of the MetS in all three GRS groups, the MetS percentages were again much higher in each GRS group if they had low CHO intake (Fig. 1(a)). Under low CHO intake, the risk of the MetS in the high-GRS groups increased by 2·016-fold (95 % CI 1·252, 1·697), in comparison with that in the high-GRS group (P<0·001).

Fig. 1. Percentages of subjects with the metabolic syndrome (MetS) according to the genetic risk scores (GRS) alleles (![]() , low GRS;
, low GRS; ![]() , medium GRS;
, medium GRS; ![]() , high GRS) in high and low carbohydrate and sodium intakes and physical activity. (a) Carbohydrate intake. (b) Sodium intake. (c) Physical activity. The cut-off points were assigned by 75th percentiles of each parameters for the high group and they were as follows: 65 % carbohydrate intake of total energy intake, 1·6 g sodium/4 MJ intake and 1 h moderate activity per d. P values indicate the significance of the interaction of GRS and carbohydrate intake, sodium intake and physical activity to modulate MetS risk. En%, energy %.
, high GRS) in high and low carbohydrate and sodium intakes and physical activity. (a) Carbohydrate intake. (b) Sodium intake. (c) Physical activity. The cut-off points were assigned by 75th percentiles of each parameters for the high group and they were as follows: 65 % carbohydrate intake of total energy intake, 1·6 g sodium/4 MJ intake and 1 h moderate activity per d. P values indicate the significance of the interaction of GRS and carbohydrate intake, sodium intake and physical activity to modulate MetS risk. En%, energy %.
There was an interaction between Na intake and MetS risk (P=0·025; Table 5). The adjusted OR increased by 2·302-fold (95 % CI 1·801, 2·943) in the high-GRS compared with the low-GRS in low intake of Na (P<0·0001; Table 5). However, the adjusted OR did not show a significant increase with high Na intake. The incidence of the MetS in the high-GRS group was much higher than the low-GRS under low Na intake (<1·6 g Na intake/4 MJ) (Fig. 1(b)). The significant increase of the MetS was also shown with high Na intake, but its difference according to GRS groups was smaller in high Na intake than the low Na intake.
Among lifestyle parameters including alcohol and coffee intake, smoking state and physical activity, only physical activity had an interaction with GRS (P=0·021). The incidence of the MetS in the high-GRS group was much higher than that in the low-GRS group in persons only with lack of physical activity (<1 h moderate activity per d; Fig. 1(c)). The risk of the MetS had a higher association with the high-GRS group (OR 2·191, 95 % CI 1·788, 2·686) compared with the low-GRS group in low physical group (Table 5). Therefore, persons with high-GRS alleles were at increased risk of the MetS when consuming a low-CHO diet and not engaging in physical activity. They could not protect against MetS risk with low Na intake.
Discussion
The main finding of the present study was that the genetic variants (APOA5_rs651821, EFCAB4B_rs4766165, ZNF259_rs2160669 and APOBEC1_rs10845640) which confer susceptibility to the MetS were explored and the GRS of the four genetic variants interacted with dietary (CHO and Na intakes) and lifestyle (physical activity) factors to increase MetS risk. The MetS is defined as having three out of five components among high waist circumference, plasma glucose, TAG concentration, blood pressure and low-plasma HDL-cholesterol. However, the selected genetic variants were mainly associated with dyslipidaemia, and GRS was significantly associated with plasma HDL-cholesterol and TAG concentrations. Insulin resistance, the known common factor for MetS risk, had no significant association with GRS. The MetS risk related to genetics might be mainly related to dyslipidaemia in Asians including Koreans since the four selected genetic variants had the lowest P values during GWAS for the MetS. Therefore, people with the high-GRS alleles may need to be more careful about CHO and Na intakes and be more physically active to reduce their risk of the MetS.
The genetic variants selected for increasing MetS risk were examined for potential mechanistic associations with the MetS risk. ZNF259 binds to the cytoplasmic domain of epidermal growth factor receptor in quiescent cells and promotes fat metabolism, and a ZNF259 gene polymorphism has been reported(Reference Wee and Wang20). ZNF259_rs2160669 has been shown to have an association with serum HDL-cholesterol and TAG concentrations. The APOA5 in the present study has been reported to be involved in the regulation of lipoprotein metabolism in obese and the MetS patients in a number of studies(Reference Su, Kong and Peng21), and APOA5_rs651821 is also associated with the MetS and metabolic components in Asian populations(Reference Liu, Hu and Baum22, Reference Wu, Yu and Zhao23). The EFCAB4B gene has been linked to the development of non-alcoholic fatty liver diseases(Reference Carr, Oranu and Khungar24). However, the effects of EFCAB4B_rs4766165 on non-alcoholic fatty liver diseases have not been studied. The effects of APOBEC expression on weight loss and atherosclerosis have been extensively studied(Reference Barrett, Guo and Harper25). However, APOBEC1_rs10845640 has not been studied.
In the current research, we identified the genetic susceptibility loci that increase the risk of the MetS(Reference Abou Ziki and Mani26). However, the interactions also needed to be examined since there is an interaction between genetic variants and lifestyle factors, including nutrient intake, that influence the risk of the MetS. The present study had some strengths as follows: (1) The data for each sample were relatively detailed and reliable since Korea Centers for Disease Control and Prevention have conducted the epidemiological study with controls. (2) Asians have different dietary patterns and show different interactions with lifestyles and nutrient intake compared with non-Asian populations. The staple food of Asians, including Koreans, is rice which has little flavour itself, and side dishes with high salt contents are consumed with rice. Koreans consume high CHO (average 70·3 En%) and Na (average 5000 mg/d) compared with non-Asians(Reference Hong, Noh and Kim27). High CHO and Na intakes are known risk factors for the MetS in Asians including Koreans(Reference Li, Guo and Jin28–Reference Park, Ahn and Kim31). Na and CHO intakes interacted with the GRS of the selected SNP in the present study. Interestingly, carriers with high-GRS alleles had increased MetS risk with low CHO intake (<65 En % CHO diet) but not high CHO intake. This was opposite to the general association of CHO intake and GRS in Asians. Thus, the carriers with high-GRS alleles may benefit from consuming 65–70 En % CHO diets to reduce MetS risk.
In a high-salt diet culture that is severely over-standard in Asia, a reduction in Na intake can be of great help to patients with the MetS. However, in the present study, carriers with high-GRS alleles were at increased risk of the MetS with both high and low Na intakes. However, carriers with high-GRS alleles had an increased incidence of the MetS with low Na intake compared with high Na intake, indicating that low Na intake did not protect against MetS risk in carriers with high-GRS alleles. In the present study, the cut-off point between high and low Na intakes was 1·6 g/4 MJ (about 2·9 g/d) which is higher than the WHO recommendation (2 g Na/d) but is much lower than the general Korean intake (5 g Na/d)(Reference Hong, Noh and Kim27). The possible reason of no benefit of low Na intake for MetS risk might be associated with the cut-off point for Na intake. In addition, low Na intake did not protect against MetS risk since the selected SNP were mainly associated with dyslipidaemia. Carriers with high-allele GRS may be less salt-sensitive. They may be better able to consume traditional Korean style dishes which are high in CHO and Na relative to Western diets. In addition to nutrient intake, high physical activity decreased the risk of the MetS. The present study demonstrated that regular physical activity, which can increase energy utilisation, can reduce the risk of the MetS in Korean adults and possibly all Asian adults. Korean middle-aged adults with high-GRS alleles reduced their susceptibility to developing the MetS when they had high physical activity in the present study.
We need to consider some of the limitations of the present study. First, the Korea Association Resource Consortium study that we used for data analysis was based on a cross-sectional study. The results cannot be applied to cause and effect. Second, we did not conduct population stratification analysis since we were unable to determine whether there was bias due to ancestor confusion or to identify different races. Since all participants are middle-aged Koreans recruited from the two cohorts in different geographical areas (the rural communities of Ansung and the city communities of Ansan in Korea), population stratification was limited in the present research. In addition, the study did not use survey design since sample weights were not provided unlike Korean National Health and Nutrition Examination Studies. However, these two cohorts partially represented the Korean middle-aged population. We found that the above four SNP were associated with MetS risk in Korean middle-aged adults, and studies on larger samples or other populations are encouraged to replicate the results.
In summary, we found four genetic variants that are linked to the MetS disease (APOA5, EFCAB4B, ZNF259 and APOBEC1) in Korean middle-aged adults, which mainly increases the risk of dyslipidaemia among MetS components. The GRS of the genetic variants had an interaction with environmental factors including CHO and Na intakes and physical activity. Low CHO and Na intakes did not decrease the MetS in the people with the risk alleles of the GRS, but high physical activity could protect against the MetS in people with risk alleles of the GRS. Therefore, people at genetic risk of the MetS due to high-GRS alleles may be able to lower their risk by engaging in regular physical activity (≥1 h moderate activity per d), but extremes of dietary nutrient intake may not reduce the incidence. However, the present study did support that a high-CHO diet was preferable over a low-CHO diet. This finding supports the traditional high-CHO diet; however, caution in needed if applying these finding to high-CHO diets in which the CHO are obtained from refined sugars rather than the traditional grain and vegetable sources. The present study is the first step in understanding the relationship between the four sets of genetic polymorphisms and the MetS, and a more detailed in-depth study is needed to determine the link between these four groups of alleles of genes and the risk of the MetS in all humans.
Acknowledgements
This study was conducted with bioresources from National Biobank of Korea, the Centers for Disease Control and Prevention, Republic of Korea.
This research was supported by the Hose University, Korea (20180324).
S. P. formulated the research question and wrote the first draft of the manuscript. J. Y. J. designed the present study and conducted the analysis of the data. M. Y. S. interpreted the data. All authors read and approved the final draft of this manuscript.
No authors declare that there are no conflicts of interest.


