


A plant-based diet has been associated with lower risk of chronic diseases including type 2 diabetes, CVD and cancer(Reference Huang, Yang and Zheng1–Reference Appleby, Crowe and Bradbury5). Recent studies also suggest that plant-based diets are related to mental well-being. A longitudinal study in the UK reported a positive relationship between fruit and vegetable consumption and well-being(Reference Ocean, Howley and Ensor6), while a randomised controlled trial study in New Zealand showed that a plant-based diet improved mental health(Reference Wright, Wilson and Smith7). An interventional study with 500 patients with depression and anxiety reported that the 12-week anti-inflammatory plant-based diet and lifestyle modification improved their symptoms(Reference Null and Pennesi8).
However, most previous studies have restricted the definition of plant-based diets to either vegetarian or non-vegetarian, and they failed to differentiate between plant foods based on their nutrient quality. While a higher intake of healthy plant foods such as whole grains, vegetables and fruits has been associated with lower risk of chronic diseases, a higher intake of less healthy plant foods such as potatoes and added sugars has been associated with a higher cardiometabolic disease risk(Reference Aune, Keum and Giovannucci9–Reference Muraki, Rimm and Willett12). To overcome these limitations, three plant-based diet indices – an overall plant-based diet index (PDI), a healthful PDI (hPDI) and an unhealthful PDI (uPDI) – that can assess the quality of plant-based diets have been developed. We have previously reported that a higher hPDI was associated with lower risk of diabetes, CHD, total and CVD mortality, as well as more favourable biomarker profiles and less weight gain, whereas a higher uPDI was associated with higher risk of these outcomes(Reference Satija, Bhupathiraju and Rimm13–Reference Baden, Liu and Satija17).
A further limitation of previous studies is that most of them focused on the specific health outcomes such as disease incidence or mental health problems. Health-related quality of life (HRQoL) refers to a multidimensional concept that encompasses the physical, mental, emotional and social functioning of individuals and enables us to summarise a broad array of individual’s functioning(18,Reference de Wit, Hajos, Gellman and Turner19) . To our knowledge, there has been no previous study that examined the relationship between the improvements specifically in the quality of an individual’s plant-based diet and HRQoL change. In the present study, we followed participants in the Nurses’ Health Study (NHS) and the Nurses’ Health Study II (NHSII) with repeated measurements of diet and HRQoL in every 4 years during an 8-year period. We took advantage of our unique data to evaluate the associations between 4-year changes in plant-based diet indices and HRQoL, adjusting for various social and lifestyle factors.
Methods
Study population and design
The NHS was established in 1976 among 121 700 US female registered nurses, aged 30–55 years. The NHSII was established in 1989 among 116 429 younger US female registered nurses, aged 25–42 years. All participants completed a baseline questionnaire, and information on their health behaviours and medical histories has been updated by biennial follow-up questionnaires ever since. In both cohorts, the cumulative follow-up rates exceeded 90 %(Reference Bao, Bertoia and Lenart20).
In the present study, the baseline was set at 1992 for the NHS and at 1993 for the NHSII, when we first assessed HRQoL using the Medical Outcomes Study’s 36-Item Short Form Health Survey (SF-36), version 1(Reference Pan, Kawachi and Luo21). The SF-36 was administered again in 1996 and 2000 in the NHS, and in 1997 and 2001 in the NHSII (online Supplementary Fig. S1). We excluded participants who either died before baseline or missing age information, had missing dietary information, had missing HRQoL information, had implausible baseline energy intakes (<2092 kJ or >14 644 kJ/d) at the FFQ just before the baseline (1992 in the NHS and 1991 in the NHSII) or were pregnant at the time of returning questionnaires (only in the NHSII). In both cohorts, the SF-36 was only included on the initially mailed long-form questionnaire and was dropped from the shortened version that was mailed to participants who did not respond to the long version. As reported previously, there was no substantial difference between excluded participants because of missing HRQoL information (mostly who completed the shortened survey) and those who completed the longer survey(Reference Pan, Kawachi and Luo21). After exclusion, the analytical samples were 50 290 women in the NHS and 51 784 women in the NHSII. Online Supplementary Fig. S2 presents the flow chart of participants.
The study protocol was approved by the institutional review boards of the Brigham and Women’s Hospital and Harvard T.H. Chan School of Public Health. The completion of self-administered questionnaires was considered to imply informed consent.
Dietary assessment
From 1990 in the NHS and 1991 in the NHSII, dietary data were collected every 4 years using a semi-quantitative FFQ (online Supplementary Fig. S1). The reliability and validity of the FFQ have been described elsewhere(Reference Willett, Sampson and Stampfer22,Reference Yuan, Spiegelman and Rimm23) . Participants reported how often, on average, they had consumed defined portions of the 130 food items during the past year using nine response categories, ranging from ‘never or less than once/month’ to ‘≥ six times/d’. The development of three plant-based diet indices (PDI, hPDI and uPDI) has also been described previously(Reference Satija, Bhupathiraju and Rimm13–Reference Baden, Liu and Satija17). Briefly, we first created eighteen food groups based on nutrients and culinary similarities and divided these eighteen food groups into the larger three categories of healthy plant foods (n 7; whole grains, fruits, vegetables, nuts, legumes, vegetable oils and tea/coffee), less healthy plant foods (n 5; fruit juices, refined grains, potatoes, sugar-sweetened beverages and sweets/desserts) and animal foods (n 6; animal fat, dairy products, eggs, fish/seafood, meat and miscellaneous animal-based foods). Each intake of eighteen food groups was ranked into quintiles and assigned a score of 1–5 positively or negatively. For creating the PDI, foods in both plant food groups were scored positively while foods in the animal food group were given reverse scores. For hPDI, foods in the healthy plant food group were given positive scores while foods in the less healthy plant and animal food groups received reverse scores. For uPDI, foods in the less healthy plant food group were assigned positive scores, and foods in the healthy plant and animal food groups were given reverse scores. Because alcohol has different associations with specific health outcomes, we did not include this as a food group but rather adjusted for it in the analyses. Likewise, because the fatty acid composition of margarine has changed over time from high-trans to high-unsaturated fats, we included this variable as a covariate in the analyses. Finally, we summed scores of eighteen food groups to derive PDI, hPDI and uPDI, ranging from 18 to 90 with higher score indicates adherence to each version of plant-based diets.
Health-related quality of life assessment
The SF-36 instrument was used to assess the following eight domains of HRQoL: 1) physical functioning, 2) role limitations due to physical health problems (physical role limitations), 3) bodily pain, 4) general health perceptions (general health), 5) vitality, 6) social functioning, 7) role limitations due to emotional problems (mental role limitations) and 8) mental health(Reference Brazier, Harper and Jones24). Each domain was scored from 0 to 100, with higher scores reflecting better HRQoL(Reference Pan, Kawachi and Luo21). The former four components were considered to reflect physical dimensions and the latter four components were considered to reflect mental dimensions. As the primary outcome, two summary scores capturing overall physical and mental HRQoL (physical component score (PCS) and mental component score (MCS)) were calculated from the eight subscale scores and transformed so that a mean score of 50 (sd 10) reflects the mean in the general US population(Reference Ware, Kosinski and Keller25). The SF-36 questionnaire has been extensively validated elsewhere(Reference Brazier, Harper and Jones24,Reference McHorney, Ware and Rogers26,Reference Ware and Sherbourne27) .
Covariate assessment
The biennial questionnaires updated participants’ information including their age, race, body weight, smoking status, physical activity, non-steroidal anti-inflammatory drug (NSAID) use, multivitamin use, menopausal status, postmenopausal hormone use, marital status, working status, spouse’s education and physician diagnosed chronic diseases. We additionally obtained information on participants’ educational attainment in the NHS, as well as information on household income in the NHSII (2001). BMI was calculated as kg/m2 based on self-reported weight and height, and physical activity was assessed by metabolic equivalent task hours per week (MET-h/week). Detailed descriptions of the validity and reproducibility for body weight and physical activity have been published previously(Reference Rimm, Stampfer and Colditz28,Reference Chasan-Taber, Rimm and Stampfer29) .
Statistical analyses
We examined the associations between 4-year changes in PDI, hPDI and uPDI (1990–1994 and 1994–1998 in the NHS and 1991–1995 and 1995–1999 in the NHSII) and 4-year changes in HRQoL (1992–1996 and 1996–2000 in the NHS and 1993–1997 and 1997–2001 in the NHSII). Participants were divided into five groups according to diet score changes (decrease ≥ 10 points, decrease 3–9 points, relatively stable (−2 to 2 points), increase 3–9 points and increase ≥ 10 points). We used multivariate linear regression using generalised estimating equation (the GENMOD procedure in SAS) starting from an unstructured correlation matrix to account for the correlated nature of within-person repeated measurements updated in every 4 years. Beta estimates were calculated with adjustment for age, race, baseline BMI (<21·0, 21–24·9, 25·0–29·9, 30–34·9 and ≥35 kg/m2), baseline corresponding PDI score, baseline corresponding HRQoL score, menopausal status and postmenopausal hormone use (premenopausal, postmenopausal without hormone use, postmenopausal with past hormone use and postmenopausal with current hormone use), smoking status (never–never, current–past, past–current, never–current, past–past and current–current), NSAID use (never use, start use, past use and continue to use), multivitamin use (never use, start use, past use and continue to use), marital status (never, past, started and continued), working status (never, past, started and continued), husband education (more than college or not), participant’s education (more than college or not, only in the NHS), household income (<50 000, 50 000–74 999, 75 000–99 999 and ≥100 000 US dollars, only in the NHSII) and baseline and changes in each of total energy intake (in quintiles), alcohol intake (0, 0·1–4·9, 5·0–14·9, 15·0–29·9 and ≥30 g/d), margarine intake (in quintiles) and physical activity (in quintiles). To account for the potential effect of weight change and development of co-morbidities on the associations between plant-based diets and HRQoL, we adjusted for weight change (in quintiles) and the onset of co-morbidities (CVD, cancer, diabetes, hypertension, hypercholesterolaemia and respiratory disease) in a separate model. We also estimated the changes in PCS, MCS and subscales of SF-36 per 10-point increase in PDI, hPDI and uPDI by treating the diet scores as continuous variables.
In addition, to assess the clinical significance, we compared the HRQoL changes associated with a 10-point hPDI increase to the HRQoL changes associated with a 5 lb (2·3 kg) weight increase and a 5-MET-h/week physical activity increase, the two major factors that are associated with HRQoL(Reference Pan, Kawachi and Luo21,Reference Wolin, Glynn and Colditz30) . Lastly, in order to assess the directionality of the associations between change in hPDI and change in HRQoL, we examined the association of a 10-point increase in PCS and MCS (1992–1996 and 1996–2000 in the NHS and 1993–1997 and 1997–2001 in the NHSII) to the subsequent change in hPDI (1994–1998 and 1998–2002 in the NHS and 1995–1999 and 1999–2003 in the NHSII).
Analyses were conducted separately for each cohort. As the NHS and the NHSII have similar study design, characteristics and follow-up strategies, results were pooled with the use of an inverse, variance-weighted meta-analysis with a fixed effects model, and heterogeneity was examined using the Cochran’s Q statistic(Reference Cochran31). All analyses were performed in SAS 9.4 (SAS Institute Inc.), and P value < 0·05 was considered statistically significant.
Results
Baseline age-standardised characteristics of participants according to first 4-year PDI changes were shown in Table 1. The mean ages were 58 (sd 7) years in the NHS and 39 (sd 5) years in the NHSII. In both cohorts, participants with the PDI increase ≥ 10 points had a lower baseline PDI score and a lower baseline energy intake. Participants with the hPDI increase ≥ 10 points had a lower baseline hPDI score and a higher baseline energy intake, and participants with the uPDI increase ≥ 10 points had a lower baseline uPDI score and a higher baseline energy intake (online Supplementary Table S1). Compared with the participants in the NHSII, participants in the NHS had higher baseline prevalence of co-morbidities, lower (worse) scores of baseline PCS, physical functioning, physical role limitations, bodily pain and higher (better) MCS, vitality, social functioning, mental role limitations and mental health. During 4-year periods, PCS scores tended to decrease over time (mean change, −1·80 (sd 7·85) in the NHS and −0·99 (sd 7·51) in the NHSII) while MCS scores tended to improve over time (1·28 (sd 7·66) in the NHS and 1·25 (sd 9·29) in the NHSII), consistent with previous reports(Reference Pan, Kawachi and Luo21,Reference Mishra, Hockey and Dobson32) . The mean changes in PCS in participants with relatively stable PDI, hPDI and uPDI were −1·76 (sd 7·78), −1·77 (sd 7·79) and −1·71 (sd 7·73), respectively, in the NHS, and −0·96 (sd 7·40), −0·95 (sd 7·36) and −0·95 (sd 7·46), respectively, in the NHSII. Similarly, the mean MCS changes in those with stable PDI, hPDI and uPDI were 1·22 (sd 7·62), 1·23 (sd 7·63) and 1·23 (sd 7·52), respectively, in the NHS, and 1·22 (sd 9·17), 1·17 (sd 9·16) and 1·16 (sd 9·22), respectively, in the NHSII.
Table 1. Baseline (1992 in the NHS and 1993 in the NHSII) characteristics of participants according to the first 4-year changes in overall plant-based diet index (PDI)*
(Mean values and standard deviations; percentages)
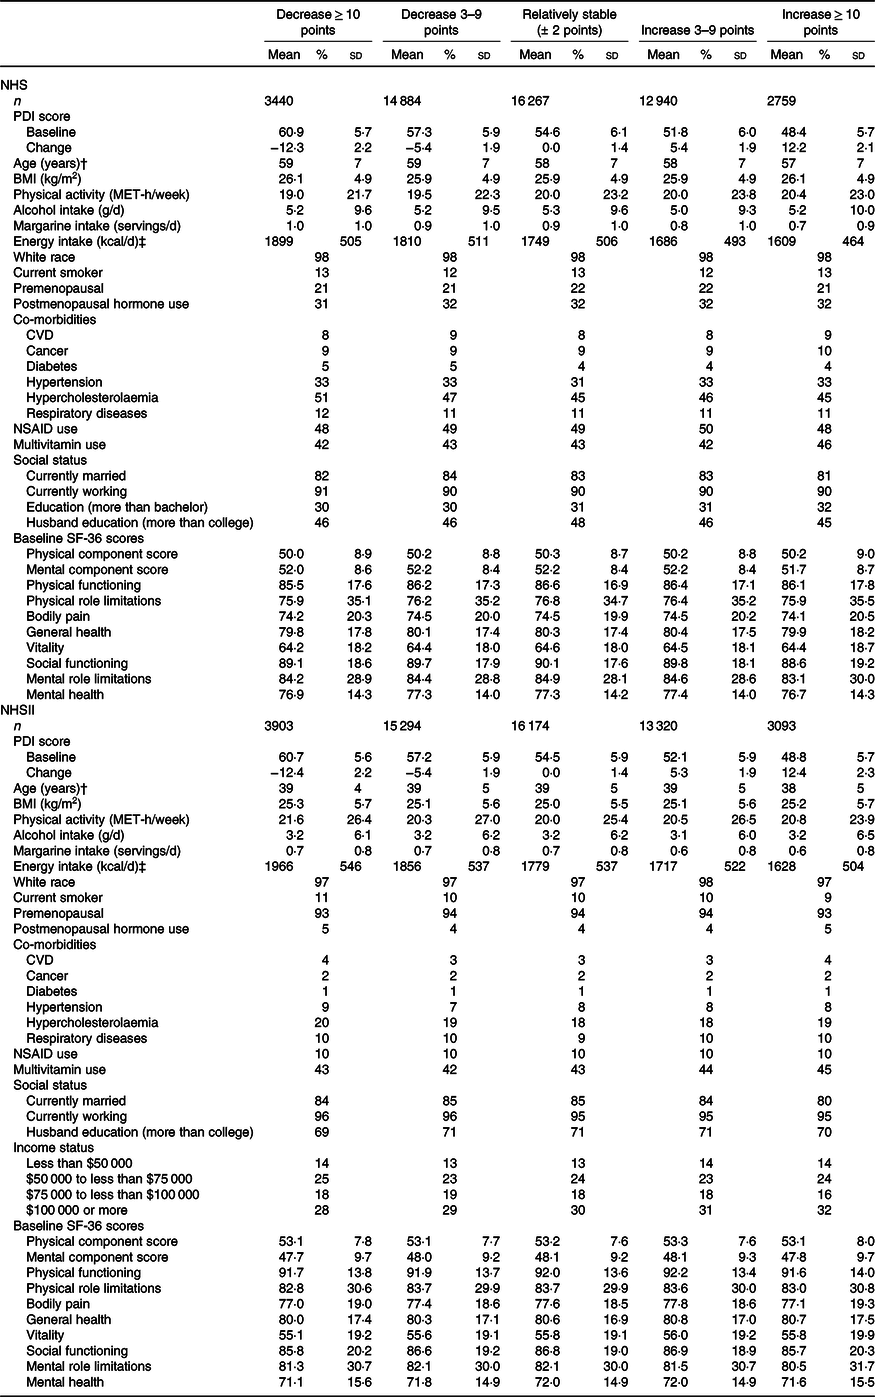
NHS, Nurses’ Health Study; NHSII, Nurses’ Health Study II; NSAID, non-steroidal anti-inflammatory drugs; SF-36, 36-Item Short Form Health Survey.
* Values are means and standard deviations or percentages and were standardised to the age distribution of the study population.
† Value was not age-adjusted.
‡ To convert kcal to kJ, multiply by 4·184.
The associations of changes in PDI, hPDI and uPDI with changes in PCS and MCS were summarised in Tables 2 and 3, Fig. 1 and online Supplementary Tables S2 and S3. In the pooled results with multivariable adjustment, compared with participants whose plant-based diet indices remained relatively stable, the PCS changes among those with ≥ 10-point increase in diet indices were 0·04 (95 % CI −0·09, 0·17) for PDI, 0·06 (95 % CI −0·07, 0·19) for hPDI and −0·18 (95 % CI −0·31, −0·06) for uPDI (Table 2). In contrast, the PCS changes among participants with ≥ 10-point decrease in plant-based diet indices were −0·05 (95 % CI −0·18, 0·08) for PDI, −0·25 (95 % CI −0·38, −0·13) for hPDI and 0·02 (95 % CI −0·11, 0·14) for uPDI (Table 2). Similar trends were observed in the participants who had mild increase and decrease in PDI (3–9 points). For each 10-point increase in plant-based diet indices, the pooled PCS changes were 0·07 (95 % CI 0·01, 0·13) for PDI, 0·13 (95 % CI 0·08, 0·19) for hPDI and −0·07 (95 % CI −0·12, −0·02) for uPDI (Table 2; Fig. 1).
Table 2. Four-year changes in physical component scores (1992–2000 in NHS and 1993–2001 in NHSII) according to 4-year changes in plant-based diet indices (1990–1998 in NHS and 1991–1999 in NHSII)*
(β-Coefficients and 95 % confidence intervals)
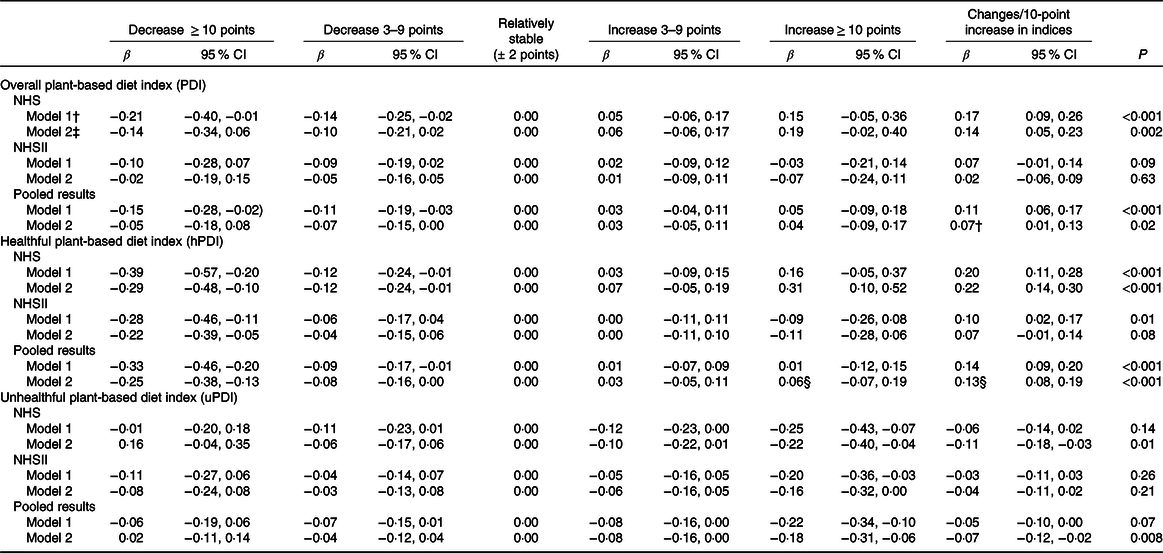
NHS, Nurses’ Health Study; NHSII, Nurses’ Health Study II; NSAID, non-steroidal anti-inflammatory drugs; HRQoL, health-related quality of life.
* Values are β-coefficients and 95 % CI in physical component scores. Pooled results were calculated with a fixed effects model.
† Model 1: adjusted for age, race, baseline corresponding plant-based diet indices, baseline corresponding HRQoL scores, baseline BMI, and baseline and changes in each of smoking status, menopausal status and postmenopausal hormone use, NSAID use, multivitamin use, marital status, working status, husband education, physical activity, alcohol intake, margarine intake and total energy intake. For the NHS, models were additionally adjusted for educational attainment. For the NHSII, models were additionally adjusted for household income.
‡ Model 2: further adjusted for CVD, cancer, respiratory disease, hypertension, hypercholesterolaemia, diabetes and weight change.
§ The P value for Q statistic for heterogeneity <0·05, indicating statistically significant heterogeneity between the NHS and the NHSII.
Table 3. Four-year changes in mental component scores (1992–2000 in NHS and 1993–2001 in NHSII) according to 4-year changes in plant-based diet indices (1990–1998 in NHS and 1991–1999 in NHSII)*
(β-Coefficients and 95 % confidence intervals)
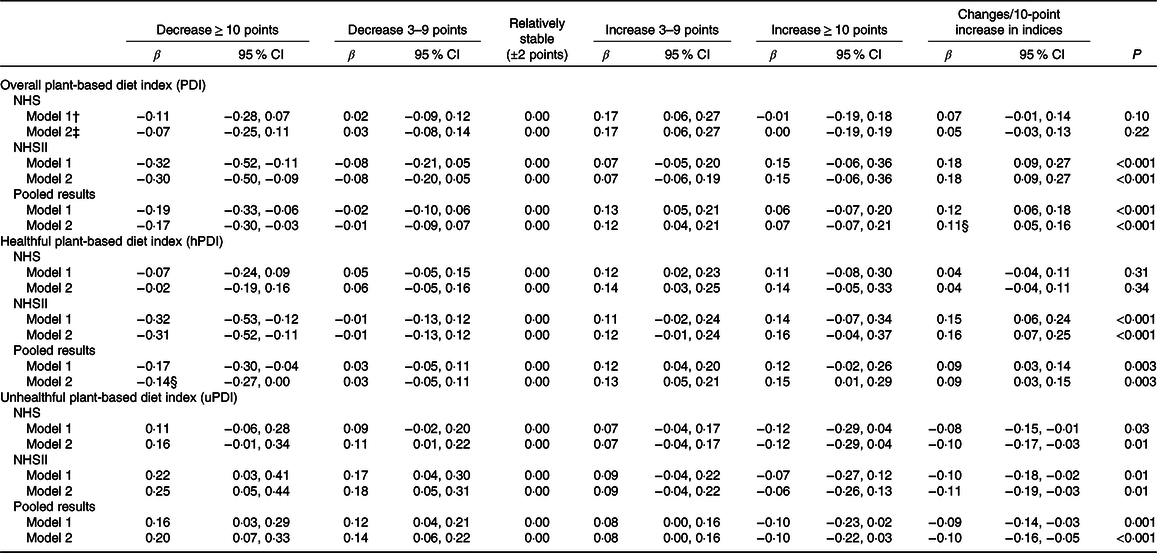
NHS, Nurses’ Health Study; NHSII, Nurses’ Health Study II; NSAID, non-steroidal anti-inflammatory drugs; HRQoL, health-related quality of life.
* Values are β-coefficients and 95 % CI in mental component scores. Pooled results were calculated with a fixed effects model.
† Model 1: adjusted for age, race, baseline corresponding plant-based diet indices, baseline corresponding HRQoL scores, baseline BMI, and baseline and changes in each of smoking status, menopausal status and postmenopausal hormone use, NSAID use, multivitamin use, marital status, working status, husband education, physical activity, alcohol intake, margarine intake and total energy intake. For the NHS, models were additionally adjusted for educational attainment. For the NHSII, models were additionally adjusted for household income.
‡ Model 2: further adjusted for CVD, cancer, respiratory disease, hypertension, hypercholesterolaemia, diabetes and weight change.
§ The P value for Q statistic for heterogeneity <0·05, indicating statistically significant heterogeneity between the NHS and the NHSII.

Fig. 1. Differences and 95 % CI of changes in health-related quality of life (HRQoL) scores/10-point (pt) increase in plant-based diet indices. The bar graphs show the pooled multivariable-adjusted differences of each HRQoL dimension. The dark bars are summary scores of physical and mental HRQoL (physical component score (PCS) and mental component score (MCS)). Error bars indicate 95% CI. hPDI, healthful plant-based diet index; PDI, overall plant-based diet index; uPDI, unhealthful plant-based index.
Likewise, compared with participants whose plant-based diet indices remained relatively stable, the MCS changes among those with ≥ 10-point increase in diet indices were 0·07 (95 % CI −0·07, 0·21) for PDI, 0·15 (95 % CI 0·01, 0·29) for hPDI and −0·10 (95 % CI −0·22, 0·03) for uPDI (Table 3). To the contrary, the MCS changes among participants with ≥ 10-point decrease in plant-based diet indices were −0·17 (95 % CI −0·30, −0·03) for PDI, −0·14 (95 % CI −0·27, 0·00) for hPDI and 0·20 (95 % CI 0·07, 0·33) for uPDI (Table 3). Similar trends were also observed in the participants who had mild increase and decrease in PDI. Per 10-point increase in plant-based diet indices, the pooled MCS changes were 0·11 (95 % CI 0·05, 0·16) for PDI, 0·09 (95 % CI 0·03, 0·15) for hPDI and −0·10 (95 % CI −0·16, −0·05) for uPDI (Table 3; Fig. 1). The associations of changes in PDI with changes in PCS and MCS were larger in the basic models (adjusted for age, baseline corresponding plant-based diet indices and baseline corresponding HRQoL scores, online Supplementary Tables S2 and S3).
When we turned to the specific subscales of SF-36, a 10-point increase in hPDI was significantly associated with improvements in all dimensions of HRQoL (Fig. 1). In addition, when we examined the joint associations of scores at baseline and 4 years later, compared with participants with consistently low hPDI scores over time, participants with the largest increase in hPDI (low to high) showed marginally increased PCS scores (0·11 (95 % CI −0·08, 0·29)) and significantly increased MCS scores (0·21 (95 % CI 0·02, 0·40)), and those with consistently high hPDI had increased PCS scores (0·24 (95 % CI 0·14, 0·33)) and increased MCS scores (0·23 (95 % CI 0·13, 0·33)) (online Supplementary Fig. S3).
There were some notable differences in the pattern of results by the cohorts. The association of hPDI increase (improved plant-based diet quality) with improvement in physical HRQoL was significant in the NHS (older women) but not in the NHSII (younger women) (Table 2). By contrast, the positive associations between hPDI increase and improvement in mental HRQoL were significant in the NHSII but not in the NHS (Table 3). We illustrated the cohort specific changes in PCS and MCS per 10-point increase in plant-based diet indices in online Supplementary Fig. S4.
In online Supplementary Table S4, we examined changes in PCS and MCS associated with changes in body weight and physical activity that were well-established predictors of HRQoL change. The coefficients from the analyses implied that in the NHS, a 10-point increase in hPDI had a comparable impact on PCS to achieving a 5 lb (2·3 kg) weight loss or a 5-MET-h/week increase in physical activity. In the NHSII, a 10-point hPDI increase was comparable on MCS as a 5 lb weight loss or 5-MET-h/week physical activity increase.
Lastly, when we examined the directionality of the association between changes in hPDI and HRQoL, we found that many of significant associations were bidirectional. A 10-point increase in PCS score was associated with hPDI increase in the NHS (0·14 (95 % CI 0·09, 0·18)), while a 10-point increase in MCS score was associated with hPDI increase in the NHSII (0·07 (95 % CI 0·03, 0·12)).
Discussion
The present study examined the associations of 4-year changes in plant-based diet quality with 4-year changes in HRQoL during an 8-year follow-up period. Based on the data of two large US cohorts of women, we found that adherence to a healthful plant-based diet was associated with the improvements in both physical and mental HRQoL.
Our results on hPDI and physical HRQoL are in line with previous studies that implicate hPDI in the prevention of chronic diseases(Reference Satija, Bhupathiraju and Rimm13,Reference Satija, Bhupathiraju and Spiegelman14,Reference Baden, Liu and Satija17) . The beneficial effects of hPDI have been explained by several biological mechanisms. An increase in hPDI implies increased consumption of whole grains, fruits, vegetables, and tea and coffee. Higher consumption of these foods has been associated with lower risk of CVD and cancer(Reference Aune, Keum and Giovannucci9,Reference Wang, Ouyang and Liu10) , partially explained through anti-inflammatory and antioxidant effects of dietary fibres and polyphenols(Reference Ma, Hebert and Li33–Reference Gardener, Rundek and Wright38). More recently, studies have begun to focus on the impact of plant-based diets on psychological well-being(Reference Ocean, Howley and Ensor6–Reference Null and Pennesi8,Reference McMartin, Jacka and Colman39–Reference Bunner, Wells and Gonzales41) , which is also consistent with the association of hPDI and mental HRQoL in our study. Although the mechanisms are still incompletely understood, one potential explanation is the anti-inflammatory and antioxidant effects of vitamins in fruits and vegetables linking with lower depression risk(Reference Ocean, Howley and Ensor6,Reference Berk, Williams and Jacka42,Reference Rooney, McKinley and Woodside43) . Another possible mechanism is via the gut–brain–microbiota axis. Diets high in fruit and fibres have been associated with greater microbial diversity and favourable differences in faecal microbiota(Reference Simpson and Campbell44), and the bidirectional communication between gut microbiota and the central nervous system has been affecting stress reactivity(Reference Foster and McVey Neufeld45,Reference Dawson, Dash and Jacka46) . Future work should consider the role of healthy plant-based diet in altering the gut microbiome and, thereby, improving physical and mental HRQoL.
A strength of this study is the repeated assessments of diet, HRQoL and numerous validated covariates that enables us to examine the changes in plant-based diet quality and HRQoL. Our within-individual fixed effects design differences out all observed and unobserved time-invariant confounding factors. It is noteworthy that the relationship between hPDI increase and improvement in physical HRQoL was more prominent in the older cohort (NHS), whereas the impacts on mental HRQoL were more pronounced in the younger cohort (NHSII). This might be partly explained by ceiling effects in the HRQoL measurement, that is, at younger ages, most participants score highly on their physical functioning. Stated differently, the physical function items on the SF-36 instrument are more sensitive to moderate or greater deficits in physical functioning (e.g. inability to walk up a flight of stairs); subtle deficits may not be picked up. To test whether switching to a healthful plant-based diet in midlife leads to long-term cumulative improvements in physical functioning with age will necessitate longer follow-up than what we have reported here. Another strength of this study is that our plant-based diet indices are different from a vegetarian diet and can assess the plant-based diet quality without complete exclusion of animal foods. Such an approach is desirable and easily translatable to public health recommendations to general population because it is flexible and allows individuals to make gradual changes in their diets. For example, a 10-point hPDI increase could be achieved by increasing healthy plant foods (such as whole grains, fruits and vegetables) by 3 servings/d and decreasing less healthy plant foods (such as refined grains and sugar-sweetened beverages) and some animal foods (such as processed meat) by about 2 servings/d(Reference Baden, Liu and Satija17). A healthy plant-based diet closely aligns with the principles of other healthy dietary patterns, such as the Alternate Healthy Eating Index and the Alternate Mediterranean Diet. The correlations between our healthful PDI and the Alternate Healthy Eating Index were 0·67 in the NHS and 0·68 in the NHSII. The correlations between our index and the Alternate Mediterranean Diet score were 0·37 in the NHS and 0·35 in the NHSII(Reference Shan, Li and Baden47). However, our plant-based diet indices are different from these other dietary indices in several aspects. First, the plant-based diet indices focus solely on the quality of plant foods included in an individual’s diet. Second, the plant-based diet indices score all animal foods negatively, including fish, poultry and dairy products that are known to be associated with better health outcomes. A significant finding from our study is that a worsening in quality of plant-based diet was associated with lower physical and mental HRQoL. This has important public health implications for nutritional recommendations that are distinct from advocating other diets, such as the Mediterranean diet, by accounting for the quality of plant foods. In the analyses, we adjusted for baseline diet scores as participants with lower baseline scores tended to increase their diet scores. The observed significant associations after adjustment for baseline diet scores suggest that even who’s diet quality is poor at baseline, improving diet quality can be related to improved HRQoL.
To our knowledge, this is the first study to elucidate the associations of changes in plant-based diet quality with HRQoL change. However, several limitations should be mentioned. First, although we controlled for several factors that have been associated with HRQoL and applied a within-individual fixed effects design to difference out all time-invariant confounding factors, we cannot infer causality due to the observational nature of our study nor exclude the possibility of time-varying residual confounding, that is, simultaneous changes in diet and quality of life over time. Second, our study design was unable to establish the directionality of the associations between plant-based diet quality and HRQoL (i.e. whether a healthy plant-based diet improves the HRQoL, or women with a higher HRQoL have better access to or motivation to consume healthy foods). Indeed, we do find some suggestion of bidirectional associations, viz., increased hPDI leads to improved HRQoL, but at the same time, improved HRQoL is correlated with changes in dietary indices although the associations were small. The English Longitudinal Study of Ageing reported that higher v. lower psychological well-being was associated with greater likelihood of meeting recommended levels of fruits and vegetable consumption over 6 years of follow-up(Reference Boehm, Soo and Zevon48). Ultimately, the associations we observed need to be confirmed in experimental designs. Third, because the participants in this study were female registered nurses and predominantly white, the generalisability may be limited. In addition, although we observed consistently positive associations between hPDI and HRQoL and negative associations between uPDI and HRQoL, the changes in HRQoL scores were modest. However, our analyses showed that increasing hPDI score by 10 points had a comparable impact on HRQoL compared with changes in other known factors such as weight and physical activity. Lastly, because the PDI were scored based on the quintiles of food intakes, other scoring approach (e.g. using absolute intake values) might be required when we compare the different populations with different dietary patterns.
In conclusion, adherence to a healthful plant-based diet was associated with both physical and mental HRQoL improvements. Although the associations were moderate, our results suggest a potential clinical significance of improving plant-based diet quality on physical and mental HRQoL.
Acknowledgements
The authors thank the participants and staff of the NHS and NHSII for their valuable contributions.
This study has been supported by grants (UM1 CA186107, U01 CA176726 and P30 DK46200) from the National Institutes of Health. M. Y. B. is supported by a fellowship from the Manpei Suzuki Diabetes Foundation. S. K. is supported by the Japan Society for the Promotion of Science Postdoctoral Fellowship for Research Abroad. The funders of the study had no role in the design, analysis or writing of this article.
M. Y. B., S. K. and I. K. designed the study; M. Y. B. performed the statistical analyses; S. K., X. L., Y. L. and A. P. contributed to the statistical analyses; Y. K., L. D. K., A. P., O. I. O., W. C. W., F. B. H. and I. K. contributed the acquisition or interpretation of data; M. Y. B. and S. K. drafted the manuscript; M. Y. B., S. K. and I. K. had responsibility for final content; and all authors read, critically revised and approved the final manuscript.
None of the authors reported a conflict of interest related to the study.
Supplementary material
For supplementary materials referred to in this article, please visit https://doi.org/10.1017/S0007114520002032


