


Childhood obesity is an important public health issue, as it affects health, educational attainment and long-term quality of life( 1 ). In addition, childhood obesity seems to track into later life( 1 – Reference Singh, Mulder and Twisk 3 ). It is estimated that 40–70 % of the variation in BMI is heritable according to classic genetic analyses( Reference Hill and Peters 4 ). Environmental contribution, however, seems to also have a major role in the obesity epidemic( Reference Damcott, Sack and Shuldiner 5 ).
Weight gain has been associated with various lifestyle behaviours related to diet, physical activity (PA) and sedentary behaviours, referred to collectively as energy balance-related behaviours (EBRB)( Reference Kremers, Visscher and Seidell 6 ). Such behaviours are established in early childhood and persist into adulthood( Reference Northstone and Emmett 7 – Reference Biddle, Pearson and Ross 9 ). A systematic review of the association between EBRB and overweight and obesity in preschool children reported a strong inverse association between total PA and being overweight and a moderate positive association between sedentary behaviour (especially television viewing) and overweight but provided insufficient evidence for the association between dietary behaviours and overweight( Reference te Velde, van Nassau and Uijtdewilligen 10 ). Consumption of sugar-sweetened beverages (SSB)( Reference Malik, Schulze and Hu 11 ) is proposed to be related to increased body weight whereas the opposite is observed for fruits and vegetables (F&V)( Reference Alinia, Hels and Tetens 12 , Reference Boeing, Bechthold and Bub 13 ), dairy products( Reference Lu, Xun and Wan 14 ) and water consumption( Reference Muckelbauer, Barbosa and Mittag 15 , Reference Cardon, De Bourdeaudhuij and Iotova 16 ). In addition, short sleep duration is associated with overweight and obesity in preschool children( Reference Liu, Zhang and Li 17 , Reference Dev, McBride and Fiese 18 ).
Clustering is a combination of behaviours that are more prevalent than expected from the prevalence of the separate behaviours( Reference Schuit, van Loon and Tijhuis 19 ). Several studies have examined the co-occurrence or ‘clustering’ of EBRB in school-aged children and adolescents( Reference Leech, McNaughton and Timperio 20 ), but evidence in younger children is scarce. Dietary clusters were reported in 2- to 3-year-old children from low-income US families( Reference Knol, Haughton and Fitzhugh 21 ) and in 4-year-old children of south-west England( Reference Northstone and Emmett 22 ), reflecting behavioural combinations that contribute either positively or negatively to the energy balance. An inverse association between television viewing and time spent being physically active was found in 3- and 4-year-old American children( Reference DuRant, Baranowski and Johnson 23 ).
Few studies have examined cross-behavioural clustering (dietary intake and PA) in preschool European children( Reference Lioret, Touvier and Lafay 24 – Reference Leech, McNaughton and Timperio 26 ). Lioret et al.( Reference Lioret, Touvier and Lafay 24 ) reported 2 EBRB clusters in 3- to 6-year-old children, namely, the ‘varied food and physically active’ and the ‘snacking and sedentary’ pattern. Gubbels et al.( Reference Gubbels, Kremers and Stafleu 25 ) reported the ‘sedentary-snacking’ cluster, characterised by high screen time, snacking and SSB consumption, and the ‘fibre’ cluster, composed of vegetables, fresh fruits, and brown bread consumption in 5-year-old children. Recently, Leech et al.( Reference Leech, McNaughton and Timperio 26 ) identified three clusters (the ‘most healthy’, the ‘energy-dense consumers who watch television’ and the ‘high sedentary behaviour/low moderate-to-vigorous PA) in a study of Australian children aged 5–6. In addition, a study of children from eight European countries identified six clusters. A high proportion of children with low socio-economic status were allocated in the cluster with the highest SSB consumption. In addition, children in the clusters with the highest mean sedentary time had statistically significant higher BMI( Reference Santaliestra-Pasias, Mouratidou and Reisch 27 ). In the same direction, Fernandez-Alvira et al.( Reference Fernandez-Alvira, De Bourdeaudhuij and Singh 28 ) found that clusters with high sugared drinks consumption, high screen time and low sleep duration were more prevalent in the group of children with lower educated parents. There are also studies addressing clusters of eating routines, in addition to various dietary intake behaviours. Specifically, Gubbels et al. ( Reference Gubbels, Kremers and Stafleu 29 ) reported four lifestyle patterns in 5-year-old children in the Netherlands, such as the ‘television – snacking’, the ‘sports – computer’, the ‘fast food’ and the ‘traditional family’ patterns, whereas Kontogianni et al.( Reference Kontogianni, Farmaki and Vidra 30 ) reported a pattern (characterised by high breakfast consumption and high eating frequency in children, in combination with a Mediterranean diet) that was negatively associated with BMI in Greek children and adolescents aged 3–18 years.
Dietary and PA habits are established in early childhood and may persist through to adulthood( Reference Northstone and Emmett 7 , Reference Summerbell, Douthwaite and Whittaker 8 ), and the same seems to apply with sedentary behaviours( Reference Biddle, Pearson and Ross 9 ). However, there is limited research on the clustering of EBRB in children younger than 5 years. Moreover, several EBRBs’ patterns have been associated with various background characteristics. Specifically, a low parental educational level is positively associated with unhealthy behavioural patterns and negatively with healthy patterns( Reference Northstone and Emmett 22 , Reference Gubbels, Kremers and Stafleu 25 , Reference Leech, McNaughton and Timperio 26 , Reference Gubbels, Kremers and Stafleu 29 ). Thus, in order to prevent obesity, it is important to identify the related behavioural patterns already in early childhood and understand how these clusters differ by socio-demographic indicators. The aim of the study was to identify cross-behavioural clusters of EBRB and explore their association with parental education and child´s BMI in a sample of preschool children of 6 European countries (Belgium, Bulgaria, Germany, Greece, Poland and Spain) participating in the ToyBox study.
Methods
Study design
The ToyBox study (www.toybox-study.eu) is a cluster-randomised study aiming to prevent overweight and obesity in preschool children from six European countries, namely, Belgium, Bulgaria, Germany, Greece, Poland and Spain( Reference Manios 31 ). The ToyBox intervention targeted four lifestyle behaviours: water consumption, healthy snacking (promoting water and F&V consumption), PA and limiting/interrupting their sedentary behaviour by improving children’s physical and social environment both at the kindergarten and at home( Reference Manios 31 ). Recruitment and baseline data collection occurred from May 2012 until June 2012. In total, 309 kindergartens and 7056 children aged 3·5–5·5 years were recruited( Reference Manios, Androutsos and Katsarou 32 ). In this study, 5387 preschool children were included, which were the children for which all required questions were completed. All questionnaires were completed by parents/legal guardians who gave written informed consent. Ethics approval was obtained from the research ethics authority of each participating centre: in Belgium, by the Medical Ethics Committee of the Ghent University Hospital; in Bulgaria, by the Ethics Committee of the Medical University of Varna; in Germany, by the Ethics Committee of the Ludwig Maximilian University of Munich; in Greece, by the Bioethics Committee of Harokopio University and the Greek Ministry of Education; in Poland, by the Bioethics Committee of the Children’s Memorial Health Institute and the Department of Information and Publicity of the Polish Ministry of Education; and in Spain, by the Clinical Research Ethics Committee and the Department of Consumers’ Health of the Government of Aragón.
Data collection
Information regarding preschool children’s EBRB (questions regarding PA, screen time and sleep time), socio-demographic and socio-economic characteristics were obtained via the primary caregivers’ questionnaire specifically developed and tested for the purposes of the study( Reference Gonzalez-Gil, Mouratidou and Cardon 33 , Reference Mouratidou, Miguel and Androutsos 34 ).
Socio-economic variables
The questionnaire included a set of indicators/determinants out of which educational level, in particular, maternal educational level, was identified as one of the best proxy indicators of socio-economic status( Reference Nixon, Moore and Douthwaite 35 ). Maternal and paternal education levels (the years of education) were obtained as five categories: <7 years, 7–12 years, 13–14 years, 15–16 years and more than 16 years of education. Thereafter, the variables were re-categorised into three categories: <7–12 years, 13–16 years and more than 16 years of education. Parental education was considered as the highest education level of both parents.
Anthropometric measures
Anthropometric measures were performed by trained researchers according to standardised protocols( Reference Mouratidou, Miguel and Androutsos 34 ). Body weight was measured in underwear and without shoes using an electronic scale (Type SECA 861 or SECA 813) to the nearest 0·1 kg, and body height was measured with a telescopic height instrument (Type SECA 225 or SECA 214) to the nearest 0·1 cm. The intra- and inter-observer reliability for weight and height was excellent (>99 and 98 %) in all participating countries( Reference De Miguel-Etayo, Mesana and Cardon 36 ). BMI (kg/m2) was calculated( Reference Cole, Bellizzi and Flegal 37 ).
Diet assessment
Food and beverage consumption was assessed using a 37-item semi-quantitative FFQ( Reference Mouratidou, Miguel and Androutsos 34 ). The questionnaire was based on a previously developed and validated FFQ for Flemish preschool children by Huybrechts et al.( Reference Huybrechts, De Backer and De Bacquer 38 ) and was adapted and validated for the purposes of the ToyBox study. Low-moderate relative validity was observed, which varied by food and beverage group (0·52–0·79), and estimate correlations ranged; however, for some of the ‘key’ foods/drinks targeted in the ToyBox intervention (e.g. water and soft drinks), the validity was good (unpublished results). In the current study, three food groups/items, reflecting the aims of the study, were selected and analysed: 1 – water, 2 – sugar-sweetened and light beverages (soft drinks), and 3 – F&V consumption, expressed in portions per d. The selection of these food groups was based on the fact that they are some of the goals of the ToyBox intervention.
Physical activity
PA was assessed by a questionnaire and pedometers. However, in this study, only PA assessed via sports participation (number of hours per week that children participated in one or two sports) was included. The assessment of PA through ‘sports participation’ was identified in previous European studies as showing the highest correlation with the moderate-to-vigorous PA as measured with accelerometers( Reference Verbestel, De Henauw and Bammann 39 ).
Screen time
Screen time (i.e. television and computer time) was assessed, both for week and weekend days, by two questions: (1) minutes spent watching television (including video and DVD) and (2) minutes spent on computer activities per day. Responses included were ‘never’, ‘<30 min/d’, ‘30 min to 1 h/d’, ‘1–2 h/d’, ‘3–4 h/d’, ‘5–6 h/d’, ‘7–8 h/d’, ‘8 h/d’ and ‘more than 8 h/d’. To obtain the daily screen time, the average minutes per day, both for week and weekend days, were summed up and divided by 7 d.
Sleep duration
Parents reported the number of hours and minutes the child slept per night on average; they were reported separately for weekdays and weekend days and were then summed up and divided by 7 d to calculate average daily sleep duration.
Statistical analysis
All statistical analyses were performed using the Predictive Analytics Software (IBM SPSS Statistics for Windows) version 20. The analyses were done with the overall sample due to the lack of sex differences analysed using a t test for continuous variables and χ 2 test for categorical variables. The EBRB variables (soft drinks, F&V, water intake, PA, screen time and sleep duration) were chosen because they were the key messages in the ToyBox intervention objective in order to promote water, F&V consumption, PA and limit/interrupt the sedentary behaviour. Before clustering, the variables were standardized into their z scores. A combination of hierarchical method and k-means cluster analysis was used to identify clusters with similar lifestyle behaviours( Reference Bittmann and Gelbard 40 ). In the first step, a hierarchical cluster analysis was carried out using Ward’s method based on the Euclidean distances. As Ward’s method is sensitive to the influence of univariate outliers (more than 3 sd), extreme values were omitted from the subsequent analyses; additionally, individuals with multivariate outliers (high Mahalanobis values) were omitted. We performed Ward’s method to obtain clusters of a meaningful size. In the second step, an iterative non-hierarchical cluster k-means clustering procedure was applied in which initial cluster centres based on Ward’s hierarchical method were used as non-random starting points. To examine the stability of the obtained clusters, the sample was randomly split into halves and the full two-step procedure (Ward, followed by k-means) was then applied to each half. The elements of each half of the sample were assigned to a new cluster based on their Euclidean distances to the clusters centres of the other half of the sample. These new clusters were then compared for agreement with the original by means of Cohen’s κ ( Reference Viera and Garrett 41 ) and excellent concordance was found (Cohen’s κ values=0·95). Analysis of variance tests with post hoc Bonferroni tests were used to investigate differences between each cluster on all indices adjusted for child’s BMI and maternal and paternal education. χ 2 tests were performed to investigate differences in cluster distribution by country, child’s BMI category, and maternal and paternal education level. Odds ratios for specific clusters of maternal, paternal and parental education levels were also calculated (adjusting for age, sex and child’s BMI). All statistical tests and corresponding P values lower than 0·05 were considered statistically significant.
Results
Table 1 shows the characteristics of the study population (n 5387). The mean age of the participants was 4·7 (sd 0·4) years. Approximately 35·3 % of the mothers and 29·8 % of the fathers were allocated in the high educational level; 41·9 % of the parents were allocated in the high educational level when considering their highest education attainment. The prevalence of overweight and obesity in studied preschool children were 10·2 and 3·6 %, respectively.
Table 1 Descriptive characteristics of the total sample (Mean values and standard deviations; numbers and percentages)
* BMI according to Cole’s cut-off( Reference Cole, Bellizzi and Flegal 37 ).
Fig. 1 presents the six EBRB clusters (mean z scores) derived from the cluster analysis. Cluster 1 was labelled ‘healthy diet and low activity’, and it was characterised by high water and F&V z scores and low PA z scores. Cluster 2, labelled ‘active’, had high PA and water z scores and very low F&V z scores. Cluster 3 was labelled ‘healthy lifestyle’ and was characterised by high water, F&V, PA and sleep time z scores and low soft drinks and low screen time z scores. Cluster 4 was labelled ‘high water and screen time; low F&V & PA’ with high water z scores and screen time z scores combined with low F&V and PA. Cluster 5 was labelled ‘Unhealthy lifestyle’ as it was characterised by high soft drinks and screen time z scores, combined with low F&V, water and PA z score. Finally, cluster 6 was named ‘high F&V consumers’ as it was characterised by high F&V z scores and low water and low z scores of PA.
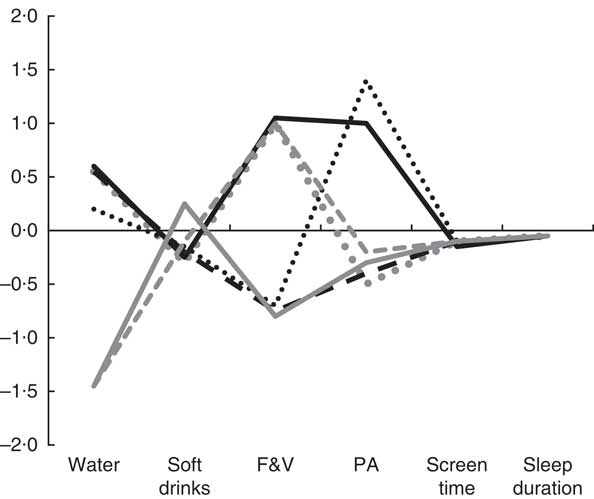
Fig. 1 Standard deviation scores of clusters on energy balance-related behaviours in boys and girls participating in the ToyBox study. F&V, fruits and vegetables; PA, physical activity; ![]() , Healthy diet and low activity;
, Healthy diet and low activity; ![]() , active;
, active; ![]() , healthy lifestyle;
, healthy lifestyle; ![]() , high water and screen time; low F&V & PA;
, high water and screen time; low F&V & PA; ![]() , unhealthy lifestyle;
, unhealthy lifestyle; ![]() , high F&V consumers.
, high F&V consumers.
Table 2 presents the means and standard deviations of EBRB for each cluster. The smallest consumption of soft drinks was observed in the ‘healthy lifestyle’ cluster (cluster 3) and the highest was in cluster 5 (‘unhealthy lifestyle’). All clusters were characterised by increased screen time, with the highest in the cluster 5.
Table 2 Energy balance-related behaviours (EBRB) in the final clusters (C) obtained, ANOVA and results of Bonferroni test adjusted by maternal and paternal education and BMI (Mean values and z Scores with their standard errors)
F&V, fruits and vegetables; PA, physical activity.
* P<0·001 ANOVA and Bonferroni post hoc test, adjusted by maternal, paternal education and BMI.
† Sugar-sweetened and light beverages (soft drinks).
Associations between the six clusters and socio-demographic variables (country, BMI and maternal, paternal and parental education level) are presented in Table 3. Significant differences in EBRB clusters were found by country, maternal and paternal education level. Moreover, the highest proportion of preschool children with increased F&V consumption (cluster 6) was observed in Germany, whereas in Greece, the highest proportion of increased water intake was observed (clusters 2 and 4). The majority of participants with low and medium parental education (17·7 and 43·2 %, respectively) were allocated in the unhealthy lifestyle cluster (cluster 5).
Table 3 Socio-demographic characteristics by cluster solution in boys and girls participating in the ToyBox study
F&V, fruits and vegetables; PA, physical activity.
* P<0·001.
† BMI according to Cole’s cut-offs( Reference De Miguel-Etayo, Mesana and Cardon 36 ).
After exploring the associations of sex, country and BMI with the cluster distribution, OR were calculated for being allocated in a specific cluster by parental education level, adjusted for the other socio-demographic characteristics (Table 4). The results showed that preschool children with lower maternal, paternal, and parental education levels (OR: 0·55; 95 % CI 0·40, 0·75; OR 0·56; 95 % CI 0·43, 0·73; OR 0·48; 95 % CI 0·34, 0·68, respectively) were significantly less likely to be allocated in the healthy lifestyle cluster than those children with higher maternal, paternal, and parental education levels.
Table 4 Logistic regression analyses between clusters of energy balance-related behaviours and education level in boys and girls participating in the ToyBox studyFootnote † (Odds ratios and 95 % confidence intervals)
F&V, fruits and vegetables; PA, physical activity; Ref., reference group: high maternal, paternal and parental education, respectively.
* P<0·001.
† Analysis adjusted by BMI, sex, age and country.
In the same direction, preschool children with lower maternal, paternal, and parental education levels (OR 1·55; 95 % CI 1·23, 1·96; OR 1·58; 95 % CI 1·25, 1·99; OR 1·70; 95 % CI 1·32, 2·16, respectively) were significantly more likely to be allocated in the unhealthy lifestyle cluster than those children with higher maternal, paternal, and parental education levels. Preschool children with medium maternal education level were also significantly more likely to be allocated in the cluster characterised by high consumption of water and low F&V (OR 1·52; 95 % CI 1·21, 1·91) than those children with higher maternal, paternal and parental education levels. In addition, preschool children with medium paternal and parental education levels (OR 1·52; 95 % CI 1·23, 1·88; OR 1·36; 95 % CI 1·13, 1·64, respectively) were significantly more likely to be allocated in the unhealthy cluster than those children with higher maternal, paternal and parental education levels.
Discussion
Six cross-behavioural clusters emerged in this study of preschool children participating in the ToyBox study. To the author’s knowledge, this is the first study to identify cross-behavioural clusters of dietary behaviours, PA, sedentary behaviours and sleep duration in European preschool children.
The ‘healthy lifestyle’ cluster, characterised by high water and F&V intake, high PA and sleep duration, and low soft drinks intake and screen time, was observed in 17 % of the sample. To our knowledge, such pattern has not been previously identified in European preschool children. In a previous study of children aged 2–9 years, the ‘healthy’ cluster was characterised by high F&V and low SSB consumption and low time spent in sedentary behaviours; however, participation in sports activities was low( Reference Santaliestra-Pasias, Mouratidou and Reisch 27 ), and it did not include sleep duration as a variable. Moreover, Fernandez-Alvira et al. reported a similar cluster in older school children, aged 10–12 years, labelled the ‘Active’ cluster( Reference Fernandez-Alvira, De Bourdeaudhuij and Singh 28 ) characterised by z scores above 0 for PA and z scores below 0 for soft drink consumption and screen time. None of these studies assessed water consumption as in our study and furthermore, our cluster demonstrated notably healthy trends for all the included EBRB.
Our results showed that preschool children with a lower parental education level were more likely to be allocated in the ‘unhealthy lifestyle’ and ‘high water & screen time; low F&V & PA’ clusters. Apart from high water consumption, the remainder of the EBRB, as well as the associations with the different socio-economic indicators, were similar between both clusters. Similar results were found in other studies examining the effect of parental educational level on EBRB clusters in preschool children( Reference Northstone and Emmett 22 , Reference Gubbels, Kremers and Stafleu 25 , Reference Gubbels, Kremers and Stafleu 29 ). Northstone & Emmett( Reference Northstone and Emmett 22 ) found that a ‘junk’ diet (high in high-fat processed foods) and snack foods (high in fat and/or sugar) were positively associated with decreasing levels of maternal education in young children. Results from the Child, Parent and Health: Lifestyle and Genetic Constitution (KOALA) Birth Cohort Study of 2-year-old children showed that low and medium maternal education levels were associated with high scores of the ‘sedentary-snacking’ cluster( Reference Gubbels, Kremers and Stafleu 25 ). Similar to our study, Gubbels et al.( Reference Gubbels, Kremers and Stafleu 29 ) assessed both paternal and maternal education levels in relation to the clustering of activity-related behaviours and eating routines in 5-year-old children. They reported that both maternal and paternal educational levels were inversely associated with the ‘television – snacking pattern’ and a negative association existed between low paternal educational level and the ‘sports – computer pattern’ cluster. Unlike our study, however, this analysis did not consider the intake of specific food groups or sleep duration.
Parents seem to have a crucial role in the lives of preschool children, controlling the availability of food, determining food intake and activity patterns and being role models, thus influencing preschool children’s EBRB and weight gain( Reference Golan and Crow 42 ). Low parental education level, either parental or maternal, seems to be associated with more unhealthy lifestyles in preschool children, whereas when examining parental and maternal education level separately, higher maternal education level seems to be related to healthier eating habits, whereas higher paternal educational level is mainly associated with high PA level. Our findings still need to be interpreted with caution, accounting for the country-specific representation.
Our findings are in line with findings in slightly older school children and adolescents( Reference Leech, McNaughton and Timperio 20 , Reference Fernandez-Alvira, De Bourdeaudhuij and Singh 28 ). The review by Leech et al. examined the clustering of diet, PA and sedentary behaviours in children and adolescents aged 5–18 years. Cluster patterns characterised by high PA/sports participation were significantly associated with a higher level of parental education, whereas high sedentary behaviours clusters were associated with low parental education( Reference Leech, McNaughton and Timperio 20 ). A study of 10- to 12-year-old children( Reference Fernandez-Alvira, De Bourdeaudhuij and Singh 28 ) reported that children of highly educated parents were more likely to be allocated in the cluster with high PA level, whereas clusters with high sugared drinks consumption, high screen time and low sleep duration were more prevalent in the group with lower educated parents. Such findings could suggest that the relationship between clustering of EBRB and parental education possibly tracks into later life.
Moreover, we assessed the potential association of the clusters with preschool children’s BMI status. Our findings showed that the ‘unhealthy lifestyle’ pattern was more prevalent in obese preschool children, which could indicate that unhealthy behaviours affect children’s weight status. Previous studies have also suggested that patterns characterised by high television and snacking behaviour( Reference Cardon, De Bourdeaudhuij and Iotova 16 , Reference Gubbels, Kremers and Stafleu 29 ), as well as patterns mainly characterised by high consumption of noncarbonated sweetened beverages, high sedentary behaviour and low consumption of water, are positively associated with being overweight in children 3–6 years old( Reference Lioret, Touvier and Lafay 24 ). In the contrary, no association was found in the study of Gubbels et al.( Reference Gubbels, Kremers and Stafleu 25 ). In addition, boys participating in the IDEFICS study had increased odds of high BMI z scores when in the cluster with the highest time spent in sedentary activities and low PA( Reference Santaliestra-Pasias, Mouratidou and Reisch 27 ). In older school children, the results are inconsistent, with some studies suggesting a higher prevalence of overweight/obesity in unhealthy clusters, whereas other studies reporting no association( Reference Leech, McNaughton and Timperio 20 ). It is worth mentioning that in the study of Fernandez-Alvira et al. the highest proportion of overweight and obese children were in the cluster characterised by both low sleep duration and low PA( Reference Fernandez-Alvira, De Bourdeaudhuij and Singh 28 ). Our data concur with the last systematic analysis( Reference Ng, Fleming and Robinson 43 ) where the overweight and obesity prevalence in Europe was relatively low in this population in comparison with North America.
Moreira et al.( Reference Moreira, Santos and Padrão 44 ) in a study performed in children (5–10 years old) reported that television viewing, lower maternal education and lower sleep duration were positively associated with a dietary pattern that included fat and sugar-rich foods. In a systematic review performed by Leech et al.( Reference Leech, McNaughton and Timperio 20 ), several studies were identified where cluster patterns characterised by high PA/sports participation were significantly associated with a high parental education level. Meanwhile, high sedentary behaviour clusters were associated with low parental education. In addition, there is evidence suggesting an association between low parental SES and being overweight in children( Reference Ng, Fleming and Robinson 43 , Reference Moreira, Santos and Padrão 44 ). Parents of low SES children from Belgium, Germany and Spain, reported more hours of television viewing compared with parents of medium/high SES. One possible explanation could be based on the fact that parents of low SES had no rules regarding watching television. For this reason, it is important to inform how their rules about sedentary time could impact their children’s health. Alternatives for television viewing, setting rules, turning off the television or encouraging children to participate in organised sports activities should be proposed for changing the amount of television viewing.
The main strengths of our study include a large pool of examined EBRB in a large sample of preschool children from six European countries, collected using standardised and harmonised data collection procedures( Reference Mouratidou, Miguel and Androutsos 34 ) and reliable and validated questionnaires( Reference Gonzalez-Gil, Mouratidou and Cardon 33 ). In addition, the study population was at a critical period regarding lifestyle habit acquisition. In addition, the use of cluster analysis provides a global view of preschool children’s behaviours that are very critical at this young age.
However, our study has some limitations that may hamper the generalisation of the results. Information regarding preschool children’s EBRB was provided by their parents or caregivers based on self-reported questionnaires, which, although prone to over- or under-reporting, has been shown to provide acceptably accurate and reliable data concerning children’s dietary and lifestyle information( Reference Byers, Trieber and Gunter 45 ). Moreover, given the cross-sectional nature of this study, it does not allow the establishment of causal relationships but only associations. The authors are aware that a number of socio-demographic and lifestyle variables and factors could affect observations.
Conclusion
This is the first study providing insights into EBRB clustering in European preschool children. Further longitudinal analysis is needed to confirm whether our results track into later life and is replicated in other populations. These results have important implications not only for future research but also for public health strategies. Specifically, the development of lifestyle intervention strategies targeting low SES population groups could possibly help to prevent chronic diseases as obesity in children. The lifestyle behaviours have been linked with the SES background; for this reason, social and political efforts should be oriented to the most unfavourable SES families. Current evidence can be used to provide information for school policies and interventions targeting the school environment.
Acknowledgements
The ToyBox study is funded by the Seventh Framework Programme (CORDIS FP7) of the European Commission under grant agreement no. 245200. The content of this article reflects only the authors’ views, and the European Community is not liable for any use that may be made of the information contained therein.
M. L. M.-B. conducted the data analysis and interpretation and the drafting of the manuscript. A. M. S.-P., T. M. and L. A. M. contributed to data analysis and interpretation and the drafting of the manuscript. All authors have contributed in the study design and read and approved the paper.
None of the authors has any conflicts of interest to declare.


