


Energy deficit is common during prolonged periods of strenuous physical activity and limited sleep such as those experienced during military operations, disaster relief and ultra-endurance sporting events(Reference Cooper, Nguyen and Ruby1–Reference Tiller, Roberts and Beasley5). For example, military training exercises, known as sustained operations, and wildland firefighting are often characterised by multiple days of prolonged low-to-moderate intensity exercise and limited sleep (<4 h/night) resulting in total daily energy expenditures (TDEE) ranging from 16·7 to 29·3 MJ/d (4000 to 7000 kcal/d)(Reference Tassone and Baker4,Reference Barringer, Pasiakos and McClung6–Reference Ruby, Shriver and Zderic9) . In military studies, measured energy intakes rarely exceed 14·6 MJ/d (3500 kcal/d), 25–40 % of foods provided are often uneaten and energy deficits of about 40–60 % TDEE resulting in body mass losses of about 2–4 % are common(Reference Margolis, Murphy and Martini10–Reference Hirsch, Meiselman and Popper18). Insufficient time, stress, environmental factors, food preferences and unwillingness or inability to carry enough food have all been cited as contributing factors(19). Appetite suppression and the large volume of food required to maintain energy balance may also play a role, but have received somewhat less attention(Reference Karl, Smith and Wilson20,21) . Similarly, energy intakes during ultra-endurance sporting events appear to plateau at about 2·5 times BMR irrespective of TDEE resulting in energy deficits proportional to TDEE(Reference Cooper, Nguyen and Ruby1,Reference Thurber, Dugas and Ocobock2) . Thus, there appears to be an upper limit on energy intake during sustained periods of high physical activity which may impact the magnitude of energy deficit. Interest in identifying factors that influence this limit is driven by the fact that energy deficits, especially if prolonged, are catabolic and may compromise occupational and athletic performance(Reference Cooper, Nguyen and Ruby1,Reference Murphy, Carrigan and Philip Karl3,Reference Tiller, Roberts and Beasley5,19,Reference Montain and Young22) .
Although the factors influencing energy intake during events requiring prolonged strenuous physical activity are multi-factorial, physiological responses that suppress appetite likely contribute. For example, short-term (<14 d) increases in exercise generally do not elicit compensatory increases in energy intake sufficient to match the increase in physical activity energy expenditure (PAEE)(Reference Donnelly, Herrmann and Lambourne23,Reference Schubert, Desbrow and Sabapathy24) . That uncoupling of energy intake and expenditure has been shown to coincide with changes in ‘episodic’ (i.e. meal-to-meal(Reference Blundell, Gibbons and Beaulieu25)) mediators of appetite to include altered gastric emptying rate(Reference Horner, Schubert and Desbrow26), increased circulating concentrations of the anorexigenic (i.e. appetite-suppressing) hormones peptide-YY (PYY), glucagon-like peptide (GLP)-1 and pancreatic polypeptide (PP), and decreased concentrations of the orexigenic (i.e. appetite-stimulating) hormone ghrelin(Reference Schubert, Sabapathy and Leveritt27). However, studies reporting appetite suppression in response to increases in exercise have generally investigated exercise levels that elicit PAEE considerably less than those typical of military operations, wildland firefighting and ultra-endurance sporting events. Physically active individuals also appear to be more likely than those who are less active to adjust energy intake to match high energy expenditures(Reference Beaulieu, Hopkins and Blundell28). Further, both body weight loss and sleep restriction stimulate appetite(Reference Capers, Fobian and Kaiser29,Reference Doucet, McInis and Mahmoodianfard30) . In some studies, increases in appetite with sleep restriction and weight loss have been observed in association with increases in ghrelin and decreases in PYY and GLP-1(Reference Zhao, Han and Gang31,Reference Zhu, Shi and Park32) . Many of the same studies also report reductions in insulin and leptin, both of which are considered ‘adiposity’ hormones or ‘tonic’ signals(Reference Blundell, Gibbons and Beaulieu25), that are secreted in proportion to body fat stores and act to defend body weight homoeostasis(Reference Begg and Woods33). The collective effects of prolonged strenuous physical activity, weight loss and limited sleep on appetite and physiological mediators of appetite are therefore unclear. An improved understanding of those effects could help inform feeding strategies for mitigating energy deficits during events in which high energy expenditures are sustained over multiple days.
This study determined the effects of differences in energy balance on appetite, appetite-mediating hormones and gastric emptying during 72-h periods of prolonged low-to-moderate intensity physical activity and limited sleep. These measures were included as secondary outcomes in a randomised, crossover trial designed to determine the effects of energy balance on inflammation and Fe absorption during sustained military operations(Reference Hennigar, McClung and Hatch-McChesney34). The study design included providing controlled energy-deficient and energy-balanced diets during otherwise identical 72-h testing periods. We hypothesised that appetite would be increased during energy deficit, but decline during energy balance, and those responses would correspond with changes in gastric emptying and appetite-mediating hormone concentrations that would collectively suggest a physiologically mediated appetite suppression under conditions of prolonged strenuous physical activity and limited sleep.
Methods
Study population
Generally healthy, recreationally active (2–4 d/week aerobic and/or resistance exercise), active duty male soldier volunteers, aged 18–39 years, with self-reported weight stability (±2·2 kg) for ≥2 months were recruited to participate in April and September 2019. Females were not recruited due to known sex differences in Fe metabolism and inflammation in response to exercise (primary study outcomes(Reference Hennigar, McClung and Hatch-McChesney34)). Additional exclusion criteria included unwillingness to eat the study diets, presence of any injuries or other conditions limiting exercise capability, cardiometabolic disease, gastrointestinal disease and anaemia. All participants were asked to abstain from alcohol, nicotine, caffeine and dietary supplement use throughout study participation and reported adhering to these instructions.
The study was conducted according to the guidelines laid down in the Declaration of Helsinki, and all procedures were reviewed and approved by the US Army Medical Research and Development Command Institutional Review Board (approval number: M-10731). Investigators adhered to the policies regarding the protection of human research participants as prescribed in Army Regulation 70-25, and the research was conducted in adherence with the provisions of 32 CFR Part 219. All participants provided written informed consent prior to participation. The trial was registered on www.clinicaltrials.gov as NCT03524690.
Study design
Full details of the study design are reported elsewhere(Reference Hennigar, McClung and Hatch-McChesney34). Details relevant to the outcomes in this report are described below.
The trial used a randomised, crossover design consisting of a baseline period, and two 72-h periods of prolonged low-to-moderate intensity physical activity and limited sleep designed to simulate sustained military operations (SUSOPS). Each SUSOPS period was followed by a 7-d recovery period. Daily schedules were identical during both SUSOPS periods, sleep was restricted to 4 h/night (01.00–05.00 hours) and physical activity was prescribed to increase TDEE to a target of 20·9–25·1 MJ/d (5000–6000 kcal/d) in accord with recent observations during military field training exercises(Reference Margolis, Murphy and Martini10,Reference Margolis, Murphy and Martini11) . Daily physical activity during SUSOPS was divided into separate sessions that included walking with a weighted vest and backpack (mean weight: 33·5 (sd 0·2) kg) in the morning (64 (sd 6) min; 8·3 (sd 0·6) metabolic equivalents) and evening (122 (sd 7) min; 8·4 (sd 0·5) metabolic equivalents), a battery of military-relevant tasks in the late morning, and unweighted walking/jogging in the afternoon (94 (sd 46) min; 5·4 (sd 1·5) metabolic equivalents). The exact duration of activity was individualised to match the 20·9–25·1 MJ/d TDEE target. Energy expenditure predictions were calculated from measured RMR, the American College of Sports Medicine’s metabolic equations for steady-state exercise(Reference Glass and Gregory35), and the compendium of metabolic equivalents for physical activities(Reference Ainsworth, Haskell and Whitt36). During SUSOPS, TDEE was measured using the doubly labelled water method as previously described(Reference Hennigar, McClung and Hatch-McChesney34).
The SUSOPS periods differed in the amount of food participants were provided. During one period, participants were provided enough food to maintain energy balance, defined as ±10 % of predicted TDEE during SUSOPS (BAL). During the other period, participants were kept in negative energy balance by providing only the amount of food estimated to meet 45 % of predicted TDEE during SUSOPS (DEF). Diets were designed, measured and provided by study dietitians, and the macronutrient distributions were matched between conditions (Table 1). Meal times were also matched between conditions, but participants could request snacks at any time. Participants could eat no more or less than the amount of food provided, and water was allowed ad libitum. Diets were composed mainly of the US Armed Services Meals, Ready-to-Eat ration, and also included other commercially available ready-to-eat products. Energy and macronutrient content was analysed using the Combat Rations Database, and Food Processor SQL (ESHA Research, version 10.14).
Table 1. Energy expenditure, energy balance and dietary intake over the 72-h sustained operations (SUSOPS) period
(Mean values and standard deviations)
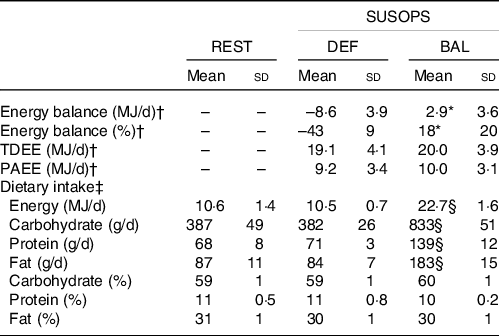
REST, pre-SUSOPS sedentary condition; DEF, energy deficit condition; BAL, energy balance condition; TDEE, total daily energy expenditure measured by doubly labelled water; PAEE, physical activity energy expenditure.
* Different from DEF, P < 0·001.
† Energy expenditure measured during SUSOPS only. Between-condition comparisons analysed by paired-samples t test (n 9, one volunteer served as study control).
‡ Analysed by general linear model with correlated errors (n 10).
§ Different from REST and DEF, P < 0·001.
The order of DEF and BAL was randomised by the study coordinator using computer-generated randomisation. Participants resided in the laboratory throughout SUSOPS. During recovery periods, participants were free-living and ate ad libitum. Three days prior to the first SUSOPS period, volunteers spent 1 d (06.00–18.00 hours) in the laboratory for baseline appetite testing (REST) (see section Appetite and food preferences). Participants remained sedentary throughout the day and consumed a provided and measured diet containing an amount of energy predicted to maintain energy balance. This energy intake was calculated as the product of measured RMR and an activity factor of 1·3 to account for energy expended during activities of daily living. The macronutrient distributions of the diets provided during REST and both SUSOPS periods were matched (Table 1).
Appetite and food preferences
During SUSOPS, self-reported appetite was measured daily before and after meals, and before and after the morning exercise session. During REST, measurements were collected before and after meals, and at the same times the morning exercise session was scheduled to begin and end during SUSOPS. Appetite measures relied on 10 cm pen and paper visual analogue scales which asked volunteers to rate their level of hunger, fullness, desire to eat and the amount of food that they thought they could eat (prospective consumption) at that moment(Reference Stubbs, Hughes and Johnstone37). All visual analogue scale responses were measured by one researcher. Random checks on those measurements were performed by a separate study team member, and all data were scrutinised for data entry errors prior to analysis.
Food preferences were measured by administering the Leeds Food Preference Questionnaire before and after lunch during REST and the final day of each SUSOPS period. The Leeds Food Preference Questionnaire is a computerised platform that uses pictures of individual food items selected from a validated database to measure three constructs encompassing different components of food preferences and hedonics: explicit liking (i.e. perceived hedonic impact of the food), explicit wanting (i.e. conscious desire to consume a food) and implicit wanting (i.e. subconscious motivation for a food)(Reference Finlayson, King and Blundell38). For this test, pictures of sixteen different foods were selected which varied in the dimensions of fat (high and low) and taste (sweet and savoury) (four pictures/category). Explicit liking was measured by a visual analogue scale that captured responses to the question ‘how pleasant would you find the taste of this food right now.’ Explicit wanting was measured by a visual analogue scale that captured responses to the question ‘how much do you want to eat this food right now.’ Implicit wanting was measured by showing participants two pictures and asking them to select the food they most wanted to eat at that moment. Both frequencies of selections within each food category and response time (i.e. relative preference) were recorded. The preference for different food types was computed for each construct by subtracting the mean scores (visual analogue scale scores or frequency of selection and reaction time) from a comparator group (low fat and savoury) relative to the matched reference group (high fat and sweet, respectively).
Gastric emptying time
Gastric emptying time (GET) was measured using the SmartPill™ wireless motility testing system (Covidien LLC). The system is FDA approved, recommended by American and European Neurogastroenterology and Motility Societies for evaluating suspected gastroparesis(Reference Rao, Camilleri and Hasler39), and has shown strong correlations with gastric emptying scintigraphy(Reference Kuo, McCallum and Koch40) and manometry(Reference Cassilly, Kantor and Knight41). The system includes a SmartPill™ capsule that is ingested and transits the digestive tract transmitting pH (range 0·5–9·0, accuracy ± 0·5 units), temperature and pressure readings every 20–40 s to a data receiver worn by each participant.
For the test, a single SmartPill™ was ingested immediately following breakfast during REST and on the second morning of each SUSOPS period. After capsule ingestion, participants followed the same activity and meal schedule as on other SUSOPS days with no restrictions on snacking or water intake. As such, all participants participated in the morning exercise session within about 2 h and consumed another meal within about 5 h of ingesting the capsule. This procedure differed from standard clinical protocols used to assess gastroparesis wherein participants ingest the SmartPill™ with a standardised meal and then fast for 6 h(Reference Tran, Brun and Kuo42). However, we chose to deviate from standard protocol to assess physiological responses that may occur within the free living environments the study was designed to emulate.
After each capsule was passed, data from the receiver were downloaded and analysed using MotiliGI™ software version 3.1 (Given Imaging). Gastric emptying time was defined as the time from pill ingestion until an abrupt increase in pH of ≥3 units from a baseline gastric pH of <4 was observed(Reference Tran, Brun and Kuo42), corresponding with transit from the acidic environment of the stomach to the more alkaline environment of the duodenum. As the SmartPill™ is not digestible, the pill is thought to exit the stomach after complete expulsion of the digestible components consumed during the initial test meal(Reference Cassilly, Kantor and Knight41). Therefore, the method is interpreted as an indirect measurement of gastric emptying, and GET can be prolonged if additional eating events occur before complete gastric emptying of the initial test meal. Normative values for GET measured by the SmartPill™ in healthy men according to standard protocol are 180–210 min with the 5th and 95th percentiles spanning 90–324 min(Reference Wang, Mohammed and Farmer43,Reference Diaz Tartera, Webb and Al-Saffar44) .
Blood biochemistries
Circulating concentrations of insulin, leptin, acylated ghrelin, PYY3–36, active GLP-1 and PP were measured in fasted blood samples collected during the first and final morning of each SUSOPS period (days 1 and 3), and on the second and fourth mornings of the 7-d recovery periods. Non-fasting blood samples of the same hormones, except leptin, were collected immediately after the morning exercise session (08.30–09.30 hours) on the first and final morning of each SUSOPS period (2·5–3 h after starting breakfast). All samples were collected by venepuncture, processed on site, and frozen as serum or plasma at −80°C until analysis.
For plasma acylated ghrelin measurements, blood was collected into chilled Monovettes containing EDTA-K3 and 4-(2-aminoethyl)benzenesulfonylfluoride hydrochloride (20 μl/ml whole blood). For plasma PYY measurements, blood was collected into chilled Monovettes containing EDTA-K3 and protease inhibitor cocktail (40 μl/ml whole blood; complete, EDTA-free) and DPPIV-inhibitor (10 μl/ml whole blood). For plasma GLP-1 measurements, blood was collected into chilled Monovettes containing EDTA-K3 and protease and DPPIV-inhibitor (10 μl/ml whole blood). Plasma aliquots for acylated ghrelin measurements were acidified with 50 µl 1 M HCl/ml plasma prior to freezing. Serum leptin was determined by RIA (EMD Millipore), serum insulin by automated immunoassay (Siemens Immulite 2000), serum PP by ELISA (EMD Millipore), plasma acylated ghrelin by RIA (EMD Millipore), plasma PYY3–36 by RIA (EMD Millipore) and plasma active GLP-1 (GLP-17–36 amide and GLP-17–37) by ELISA (EMD Millipore). Intra-assay CV were 4·0 % for insulin, 5·0 % for leptin, 7·4 % for ghrelin, 8·7 % for PYY, 4·5 % for GLP-1 and 4·3 % for PP.
Anthropometrics and RMR
Height was measured in duplicate prior to the first SUSOPS period using a stadiometer. Nude, fasted body weights were measured each morning following first void during both SUSOPS and the recovery periods using a calibrated digital scale.
RMR was measured the week prior to the first SUSOPS period using indirect calorimetry (True Max 2400, ParvoMedics). Volunteers were instructed to fast for ≥8 h prior to testing and rested in a supine position for ≥30 min prior to starting the measurement. Twenty minutes of data were collected, and the final 10 min were averaged to determine RMR.
Statistical analysis
Sample size calculations used data from a laboratory study in which the same appetite-mediating hormones measured herein and appetite were assessed during severe short-term energy deficit(Reference Karl, Smith and Wilson20,Reference O’Connor, Scisco and Smith45) . Nine participants were estimated to be sufficient for detecting 1·4-fold between-condition differences in fasting hunger ratings and 1·7–3-fold between-condition differences in circulating concentrations of all appetite-mediating hormones except PP (for which n 14 would be needed) at α = 0·05 and power = 0·80. Sample size calculations for GET were based on studies reporting large effect sizes of physical activity(Reference Horner, Schubert and Desbrow26) and fasting(Reference Corvilain, Abramowicz and Fery46) on gastric emptying. It was estimated that eight participants would provide sufficient power to detect a large effect size (Cohen’s d = 1·0) for between-condition differences in GET at α = 0·05 and power = 0·80. Thirteen participants were enrolled to ensure adequate power for primary study outcomes while accounting for expected attrition.
Energy expenditure and energy balance data were compared between conditions using paired t tests. All other variables were analysed using general linear models with correlated errors and a compound symmetry covariance structure. All models included condition (DEF, BAL and REST when applicable), condition order (DEF then BAL or BAL then DEF) and their interaction as fixed factors. For outcomes measured more than once per condition (i.e. body weight, appetite ratings, food preferences, hormone concentrations), models included study day and, when relevant, time of day, as fixed factors in addition to the corresponding three-way (condition × day × time) and/or two-way (condition × day, condition × time) interactions. Models excluded the REST condition if study day was a factor in the model, and models for hormones that were measured post-exercise combined the time and day factors into a single factor (time point). Additionally, to examine appetite ratings on all 3 d of DEF and BAL relative to REST, separate models were used to test differences on each day of SUSOPS (i.e. REST was compared with DEF and BAL days 1, 2 and 3 in separate models). When statistically significant main effects or interactions were observed, post hoc testing was conducted using paired t tests and Fisher’s least significant difference to identify differences between conditions or over time.
In exploratory analyses, general linear models with correlated errors were used to examine associations between energy balance (independent variable) and percentage differences in appetite ratings from REST during DEF and BAL (dependent variable). These models provided a regression equation (y = ax + b) for each appetite rating where x = energy balance (% or MJ/d), y = percentage difference in appetite ratings from REST, and b = the y-intercept and corresponding 95 % CI. Each equation was then solved for y = 0 to find the x-intercept, and CI for the x-intercept were calculated using the Taylor expansion series. This analysis provided y-intercepts that represented the predicted difference in each appetite rating relative to REST at energy balance (i.e. energy deficit = 0), and x-intercepts that represented the predicted magnitude of energy deficit required to elicit increases in hunger, desire to eat and prospective consumption and decreases in fullness (see dashed lines in Fig. 2, for example).
All data were examined quantitatively and graphically prior to analysis, residual plots were evaluated to assess adherence to model assumptions (i.e. normal distribution and homogeneity of variance) and logarithmic or square root transformations were used when necessary to meet model assumptions. Cohen’s f 2 was calculated as a measure of effect size for general linear models used in primary analyses, and Cohen’s d was calculated as a measure of effect size for between-condition differences at single time points. Carryover effects were not detected for any outcome. Statistical analyses were completed using SPSS version 24.0 (IBM). Tests were two-sided and considered statistically significant at P ≤ 0·05. Results are presented as mean values and standard deviations or mean differences and 95 % CI in the text unless otherwise noted.
Results
Of the thirteen male volunteers enrolled, two volunteers withdrew for personal reasons and one withdrew due to injury. The ten volunteers (22 (sd 5) years, BMI: 27·0 (sd 3·5) kg/m2) who completed the study were included in this analysis. PAEE and TDEE measured during SUSOPS did not differ between DEF and BAL, but were less than planned due to some participants not being able to complete the prescribed exercise on all SUSOPS days (Table 1). As a result, mean energy balance was positive during BAL (Δbody weight = 0·6 kg (95 % CI 0·2, 1·2)). However, as planned, energy intake during DEF was 46 % of that measured during BAL, resulting in energy deficit and body weight loss (–1·2 kg (95 % CI −1·7, −0·7)).
Appetite and food preferences
Between-condition differences in appetite ratings were evident within the first few hours of testing (online Supplementary Fig. S1), and mean ratings differed between BAL and DEF on each day of SUSOPS (Fig. 1(a),(c),(e) and (g)) and online Supplementary Table S1; Cohen’s f 2 = 0·89–1·19). Aside from hunger (P condition × day = 0·02), mean daily appetite ratings did not differ over time within BAL or DEF (P condition × day > 0·05) though effect sizes for between-group differences were largest on the final day of SUSOPS (online Supplementary Table S1). When averaged across the three SUSOPS days, mean hunger, desire to eat and prospective consumption ratings were all higher during DEF relative to REST (mean percentage difference (95 % CI); hunger: 26 % (95 % CI –3, 54); desire to eat: 56 % (95 % CI 6, 107); prospective consumption: 28 % (95 % CI 4, 53)) and lower during BAL relative to REST (hunger: –55 % (95 % CI –73, –38); desire to eat: –52 % (95 % CI –71, –32); prospective consumption: –54 % (95 % CI –68, –39)) (Fig. 1(c)–(h)). In contrast, mean fullness ratings did not differ from REST during DEF (12 % (95 % CI –36, 61)), but were 65 % (95 % CI 21, 109) higher than REST during BAL (Fig. 1(a) and (b)).

Fig. 1. Changes in mean appetite ratings during rest and during a 72-h simulated sustained military operation under conditions of energy balance (BAL) and energy deficit (DEF) (n 10). (a), (c), (e), (g) Boxes show median and interquartile range. Whiskers extend to 1·5 times the interquartile range or to minimum/maximum value if no values within that range. Differences between BAL and DEF analysed using general linear model with correlated errors, and condition, day, time and their interactions as fixed factors (model 1). Within a condition, boxes not sharing a letter are significantly different (P < 0·05) (P
condition x day < 0·05). Additionally, differences between BAL, DEF and REST analysed using separate general linear models with correlated errors for each study day, and with condition, time and their interaction included as fixed factors (model 2). Between-condition differences are denoted using symbols. (b), (d), (f), (h) Individual changes in mean appetite ratings. Bars represent the mean ratings over all 3 d of DEF and BAL, and over the full day of REST. Lines connect data collected from the same individual. Analysed using general linear model with correlated errors. (a)–(h) *,† Main effect of condition (P < 0·05); * different from REST (P < 0·05), † different from BAL (P < 0·05). pro. consum., Prospective consumption; REST, baseline sedentary condition. ![]() REST;
REST; ![]() BAL;
BAL; ![]() DEF.
DEF.
When comparing changes in appetite ratings during BAL and DEF relative to REST, the mean decreases in hunger (–12 % (sd 31) % v. −55 % (sd 25) %, P = 0·003) and prospective consumption (–17 % (sd 22) % v. −54 % (sd 21) %, P = 0·001), but not desire to eat (–25 % (sd 30) % v. −52 % (sd 27) %, P = 0·09), and the mean increase in fullness (10 % (sd 48) % v. 65 % (sd 61) %, P = 0·05) were less when DEF was compared with REST relative when REST was compared with BAL, thereby indicating a larger effect of BAL on appetite ratings. When linear associations between percentage energy balance during SUSOPS and percentage differences in appetite ratings from REST were examined (Fig. 2 and Table 2), y-intercepts were negative for hunger and prospective consumption, but not desire to eat, and demonstrated a tendency towards being positive for fullness, which was statistically significant after removing one outlier (Table 2). Thus, the regression analyses predicted a mean suppression of hunger and prospective consumption, and an increase in fullness had energy balance been maintained during SUSOPS. Conversely, the energy balance during SUSOPS at which no change in appetite would be predicted (i.e. x-intercept) was negative for fullness, hunger and prospective consumption, representing a threshold of energy deficit beyond which appetite would be expected to start increasing during SUSOPS (Table 2). For example, hunger was not predicted to increase from REST until an energy deficit of 24 % or 5·4 MJ/d (1295 kcal/d) was exceeded (Table 2 and Fig. 2(b)).

Fig. 2. Exploratory analysis of associations between mean changes in appetite ratings from REST (baseline sedentary condition) during a 72-h simulated sustained military operation relative to mean energy balance during the 72-h period (n 9). Solid lines connect data from the same individual. Dotted lines represent the best fit line calculated using general linear models with correlated errors (see Table 2). Diff., difference.
Table 2. Associations between energy balance during sustained operations (SUSOPS) and changes in appetite ratings*

* n 9. Associations determined using general linear model with correlated errors. Independent variable was energy balance (% or MJ/d). ΔDependent variables are percentage difference of mean ratings throughout energy deficit (DEF) and energy balance (BAL) conditions relative to mean ratings during sedentary condition (REST).
† CI for x-intercepts calculated using sd derived from Taylor expansion series.
‡ When one outlier removed: β = 0·8 (0·4, 1·2), P = 0·003; y-intercept = 25·1 (13·4, 36·8), P = 0·001; x-intercept = −31 % (–48,−17).
§ When one outlier removed: β = 0·014 (0·004, 0·024), P = 0·01; y-intercept = 25·1 (11·9, 38·3), P = 0·002; x-intercept = −7.5 MJ/d (–11.6, −3.2).
Food preferences were neutral (i.e. CI for high v. low fat and sweet v. savoury crossed zero) and generally did not differ across study conditions (Fig. 3 and online Supplementary Table S2; Cohen’s f 2 = 0·02–0·06 for sweet v. savoury and 0·09–0·10 for high v. low fat). Exceptions were a greater perceived liking of high-fat relative to low-fat foods (P condition = 0·04; P DEFvBAL = 0·01; Cohen’s d = 0·42), and a tendency towards a greater conscious desire for high-fat relative to low-fat foods (P condition = 0·07; P DEFvBAL = 0·02; Cohen’s d = 0·49) during DEF compared with BAL.

Fig. 3. Food preferences measured during rest and during a 72-h simulated sustained military operation (SUSOPS) under conditions of energy balance (BAL) and energy deficit (DEF) (n 7). Preference for (a) high v. low fat and (b) sweet v. savoury foods measured by the Leeds Food Preference Questionnaire. Positive values indicate preference for high fat or sweet, negative values indicate preference for low fat or savoury. Boxes show median and interquartile range. Whiskers extend to 1·5 times the interquartile range or to minimum/maximum value if no values within that range. Each domain analysed separately using general linear model with correlated errors. For all models, data for n 3 were excluded for failure to adhere to test instructions. †,* Main effect of condition (P = 0·04); † different from BAL (P = 0·01), * difference from REST (P = 0·06). ‡ Main effect of condition (P = 0·07); different from BAL (P = 0·02). REST, pre-SUSOPS sedentary condition. ![]() REST;
REST; ![]() BAL;
BAL; ![]() DEF.
DEF.
Gastric emptying time
GET did not differ from REST (median (interquartile range): 182 min (182)) during DEF (222 min (250); Cohen’s d = 0·16), but was increased during BAL (612 min (713)) relative to both REST (P = 0·01; Cohen’s d = 0·96) and DEF (P = 0·05; Cohen’s d = 1·00) (P condition = 0·03, Cohen’s f 2 = 0·20; Fig. 4(a)). GET exceeded 5 h, which was the approximate time elapsed between pill ingestion and the lunch meal, and a generally accepted upper limit for normal GET(Reference Wang, Mohammed and Farmer43), for five participants during one or more conditions (REST, n 1; DEF, n 2; BAL, n 5). In all of those cases, GET exceeded 10 h. Although excluding those participants from the analysis attenuated between-condition differences, GET during BAL (266 (sd 30) min) remained significantly higher than during REST (152 (sd 54) min, P = 0·01; Cohen’s d = 2·56) and demonstrated a tendency to be higher relative to DEF (207 (sd 40) min, P = 0·06; Cohen’s d = 1·16) (P condition = 0·02, Cohen’s f 2 = 0·64; Fig. 4(b)).

Fig. 4. Gastric emptying time (GET) measured during rest and during a 72-h simulated sustained military operation (SUSOPS) under conditions of energy balance (BAL) and energy deficit (DEF). Bars represent mean GET for (a) all available data (n 10; square root-transformed for analysis), and (b) after excluding data for n 5 who demonstrated delayed gastric emptying during ≥1 conditions. Analysed using general linear model with correlated errors. *,†,‡ Main effect of condition (P ≤ 0·03). * Different from REST (P ≤ 0·05). † Different from BAL (P < 0·05). ‡ Trend for difference from BAL (P = 0·06).
Appetite-mediating hormones
Condition-by-time point interactions were observed for all appetite-mediating hormones (Fig. 5 and online Supplementary Table S3). Fasting leptin concentrations decreased during both BAL and DEF, but to a greater extent during DEF, resulting in lower concentrations on the final day of SUSOPS during DEF relative to BAL (P = 0·002; Cohen’s d = 0·63). Fasting acylated ghrelin concentrations also decreased during DEF and were lower on the final day of SUSOPS during DEF relative to BAL (P = 0·03; Cohen’s d = 0·38). In contrast, fasting insulin, PYY, GLP-1 and PP concentrations did not demonstrate any between-condition differences.

Fig. 5. Body weight (a) and appetite-mediating hormone concentrations (b)–(g) measured during (days 1 and 3) and after (Recovery (Rec.) days 2 and 4) a 72-h simulated sustained military operation (SUSOPS) under conditions of energy balance (BAL) and energy deficit (DEF) (n 10). Values are mean values and standard errors. Analysed by general linear models with correlated errors. a,b,c,d Within a condition, time points not sharing a superscript letter are significantly different (P < 0·05). * Difference between BAL and DEF (P < 0·05). Fast, fasting measurement; PostEx, non-fasting measurement collected immediately after morning exercise bout. ![]() BAL;
BAL; ![]() DEF.
DEF.
Mean concentrations of all hormones measured in the non-fasting state after exercise differed between DEF and BAL on both the first and final days of SUSOPS (Fig. 5 and online Supplementary Table S3). Acylated ghrelin concentrations were higher during DEF relative to BAL on both days (Cohen’s d = 1·49 (day 1), 1·25 (day 3); P ≤ 0·001). In contrast, PYY (Cohen’s d = 0·90 (day 1), 1·10 (day 3); P ≤ 0·02), GLP-1 (Cohen’s d = 1·76 (day 1), 0·76 (day 3); P ≤ 0·01), PP (Cohen’s d = 0·80 (day 1), 0·50 (day 3); P ≤ 0·01) and insulin (Cohen’s d = 1·03 (day 1), 1·90 (day 3); P ≤ 0·001) concentrations were all lower during DEF relative to BAL on both the first and final days of SUSOPS.
Discussion
Study results demonstrated that changes in appetite ratings during 72-h of prolonged low-to-moderate intensity physical activity and limited sleep simulating sustained military operations were not proportional to changes in energy balance. Associations between energy balance and appetite ratings predicted a mean appetite suppression at energy balance and provided preliminary evidence of a minimum energy deficit that may be expected independent of logistical and other factors that limit food intake during events characterised by prolonged periods of high physical activity and limited sleep. Between-condition differences in GET and circulating concentrations of appetite-mediating hormones identified slowed gastric emptying, increased concentrations of anorexigenic hormones and decreased acylated ghrelin concentrations as potential mechanisms for appetite suppression. Collectively, findings implicate a physiologically mediated attenuation of compensatory responses in appetite to increased PAEE as one factor contributing to the development of energy deficit during sustained military operations and possibly other events characterised by prolonged strenuous activity and limited sleep such as wildland firefighting and ultra-endurance sport.
The precise quantification of energy intake and expenditure along a spectrum of energy deficit to surplus within the same individuals is a strength of this study. The mean decrease in hunger and prospective consumption, and increase in fullness predicted to occur between the range of energy balance to about 25 % energy deficit (0 to about 5·4 MJ/d (1300 kcal/d) in this study; see negative y- and x-intercepts in Table 2) are consistent with an exercise-induced appetite suppression which appears to supersede any stimulatory effects of sleep restriction and energy deficit on appetite. That result is consistent with laboratory ad libitum feeding studies which have reported that progressive increases in PAEE of up to 3·3–5·0 MJ/d (800–1200 kcal/d) over 7–14 d results in energy deficits of about 30 % (about 5·0 MJ/d (1200 kcal/d)) without significant increases in mean daily appetite ratings(Reference Stubbs, Sepp and Hughes47,Reference Whybrow, Hughes and Ritz48) . The findings also align with and extend those of studies which have concluded that energy intake does not increase to fully compensate for acute (<1 d) or short-term (2–14 d) increases in PAEE of lesser(Reference Donnelly, Herrmann and Lambourne23,Reference Schubert, Desbrow and Sabapathy24) or greater(Reference Thurber, Dugas and Ocobock2,Reference Tiller, Roberts and Beasley5) magnitude than those experienced in this study.
Study findings extend those of previous studies conducted in military field training exercises. For example, increases in hunger (18 to about 40 %) that were proportionally less than the magnitude of energy deficit experienced were reported in two separate field training studies where TDEE was high (20·9–25·1 MJ/d (5000–6000 kcal/d)) and energy deficits were similar in magnitude to those imposed herein (40–55 % energy deficit over 4 d)(Reference Margolis, Murphy and Martini10,Reference Tanskanen, Westerterp and Uusitalo12) . Those studies and others have also reported that providing additional food or beverages to augment typical ration provisions (e.g. 3 rations/d) generally results in reduced consumption of the typical provisions(Reference Margolis, Murphy and Martini10,Reference Tanskanen, Westerterp and Uusitalo12,Reference Jacobs, Van Loon and Pasut17,Reference Cline, Tharion and Tulley49,Reference Montain, Shippee and Tharion50) . Energy deficits are therefore attenuated, but not prevented when supplemental energy is provided. Collectively, these observations suggest that achieving energy balance while eating ad libitum during strenuous military operations is unlikely regardless of food availability because appetite does not increase sufficiently to match the high PAEE. Rather, when food availability is not limited, an energy deficit of 25 % may approximate a minimum deficit that can be expected independent of other factors limiting appetite and/or energy intake in those environments. Notably, recent findings suggest that an energy deficit of that magnitude (about 5·4 MJ/d (1300 kcal/d)) could be sustained for up to 2 week before reductions in lower-body physical performance would be expected(Reference Murphy, Carrigan and Philip Karl3); however, decrements in mood and cognition may occur earlier(Reference Giles, Mahoney and Caruso51,Reference Lieberman, Bukhari and Caldwell52) .
The observed appetite suppression appeared to be physiologically mediated. In support, GET, which was increased during BAL, has been inversely associated with appetite at rest, and during and after exercise(Reference Horner, Schubert and Desbrow26,Reference Horner, Byrne and Cleghorn53) , likely due to effects on gastric distention and intestinal exposure to nutrients(Reference Janssen, Vanden Berghe and Verschueren54). GET did not differ between REST and DEF, suggesting that the high physical activity may have attenuated any effects of energy deficit on slowing GET(Reference Horner, Byrne and Cleghorn53) and that the slowed GET during BAL was due, in part, to differences in diet volume. That conclusion would be consistent with results of one meta-analysis which reported that moderate-intensity exercise has no effect or slightly accelerates gastric emptying, while greater food volume is associated with slower gastric emptying during exercise(Reference Horner, Schubert and Desbrow26). In addition, the SmartPill™ used to measure GET generally passes from the stomach only after digestible solids are emptied(Reference Cassilly, Kantor and Knight41). That feature likely explains the above-average GET and prevalence of prolonged gastric retention of the SmartPill™ observed during BAL. Specifically, the increased diet volume and more frequent snacking during BAL relative to DEF and REST likely prevented the breakfast meal from completely emptying the stomach of some participants before the subsequent snack or lunch meal was consumed. Though the testing protocol used to measure GET did differ from clinical protocols using the SmartPill™, the approach is more relevant to the military environments the study was designed to emulate wherein individuals may eat meals or snacks prior to complete gastric emptying of the previous meal. Further, mean/median GET measured during DEF and REST, and during BAL after excluding outliers, was within the normal range for healthy males(Reference Wang, Mohammed and Farmer43,Reference Diaz Tartera, Webb and Al-Saffar44) . Taken together, these data suggest that the combination of higher volume meals and more frequent or higher volume snacks likely contributed to appetite suppression at energy balance, in part, by prolonging GET.
Differences in appetite-mediating hormone concentrations may also have contributed to appetite suppression at energy balance. Relative to both fasting concentrations and those measured during DEF, non-fasting post-exercise insulin, PYY, GLP-1 and PP concentrations were elevated during BAL, whereas non-fasting post-exercise acylated ghrelin concentrations were reduced. Those differences were likely attributable to greater food intake during the breakfast meal (consumed 2·5–3 h prior to the post-exercise blood draw) during BAL, as exercise was matched between conditions. Effects of PP, PYY and GLP-1 include promoting satiety and slowing gastric emptying, whereas ghrelin stimulates hunger and accelerates emptying(Reference Camilleri55–Reference Kojima, Ueno and Asakawa57). Thus, a prolonged postprandial elevation in circulating anorexigenic hormone concentrations and suppression of acylated ghrelin concentrations would collectively be expected to slow gastric emptying, increase satiety and suppress hunger.
Between-group differences in fasting appetite-mediating hormone responses to SUSOPS were notably different from between-group differences in non-fasting measurements. Only fasting acylated ghrelin and leptin differed, both decreasing to a greater extent during DEF than BAL. While it seems counterintuitive that the orexigenic hormone ghrelin would decrease during energy restriction, similar responses have been observed during severe, short-term energy deficit in other studies(Reference Karl, Smith and Wilson20,Reference O’Connor, Scisco and Smith45,Reference Liu, Prudom and Nass58,Reference Clayton, Burrell and Mynott59) , and animal studies suggest that energy deprivation increases neuronal ghrelin sensitivity(Reference Kim, Yoon and Park60,Reference Banks, Burney and Robinson61) . The larger decrease in leptin during DEF may have also contributed to changes in ghrelin sensitivity and appetite. Circulating leptin concentrations are known to decrease immediately and substantially during energy deficit(Reference Park and Ahima62). This response alters central nervous system sensitivity to episodic signals mediating appetite during and between meals(Reference Begg and Woods33) and drives the common tendency to regain lost body mass(Reference Sumithran and Proietto63), as was observed in this study. Thus, the relative appetite suppression observed at energy balance and rapid weight regain following energy deficit, when considered within the context of the between-condition differences in appetite-mediating hormones and GET, are consistent with the concept that biological responses to perturbations in energy balance effectively match energy intake and expenditure, but over timescales longer than meal-to-meal or day-to-day(Reference Edholm, Adam and Healy64,Reference de Castro65) . These findings suggest that responses of episodic and tonic signals mediating appetite and body weight homoeostasis are likely to deter voluntary increases in energy intake to match energy expenditure during short-term periods of high PAEE, but will stimulate weight regain once energy expenditure returns to usual levels, and highlight the importance of allowing adequate rest and recovery to restore body mass losses.
Mitigating rather than preventing energy deficit may therefore be a more realistic goal during periods of prolonged strenuous activity and limited sleep. One means of achieving that goal could include exploiting hedonic factors that influence the preference and desire for particular foods. Hedonic factors are recognised as important determinants of energy intake which can override episodic and tonic mediators of energy balance homoeostasis and promote overconsumption(Reference Berthoud66), and food acceptability is a known factor influencing energy intake in military environments(Reference Hirsch, Matthew Kramer and Meiselman67) and ultra-endurance sport(Reference Tiller, Roberts and Beasley5). For those reasons, it is notable that desire to eat changed in proportion to energy balance and volunteers demonstrated a greater preference, albeit small, for higher fat foods during SUSOPS when in energy deficit. Fat is less satiating per unit energy than carbohydrate or protein(Reference Blundell and MacDiarmid68) and is energy dense. Higher energy density meals and diets consistently result in higher energy intakes, usually without affecting perceived appetite(Reference Karl and Roberts69), and despite postprandial appetite-mediating hormone responses that track energy intake(Reference Karl, Young and Rood70). Higher-fat diets (50–60 % v. 30–35 % of energy) and meals have also been shown to mitigate exercise-induced energy deficits(Reference King and Blundell71–Reference Stubbs, Hughes and Johnstone74) and contribute to increased energy intake in military field training environments(Reference Huang, Gan and Law75). Increasing fat content and energy density of foods (e.g. military rations) consumed during sustained periods of prolonged low-to-moderate intensity physical activity may therefore warrant consideration in future research as possible strategies for attenuating energy deficit. However, those studies will need to consider whether increasing dietary fat content affects the ability to consume recommended intakes of carbohydrate and protein, and any impacts on physical and cognitive performance(Reference Tiller, Roberts and Beasley5,Reference Margolis, Murphy and Martini10,Reference Hoyt, Jones and Rose76) .
The results of this study should be interpreted within the context of several limitations. First, although the study was adequately powered to detect between-condition differences for all of the secondary study outcomes reported herein except PP, the sample size was small and multiple outcomes were assessed, which increases risk of type 1 error. As such, findings warrant cautious interpretation and require replication in larger cohorts. Additionally, the study was not designed to control for all factors that may influence appetite, GET or appetite-mediating hormone concentrations. However, any effects of those factors should have been mitigated by the standardised time periods between eating and blood measurements, and by measuring appetite at multiple time points throughout each day. A second limitation was the mean positive energy balance during BAL. The correlations between energy deficit and appetite ratings which were used to address that limitation do strongly suggest that appetite would have been suppressed had energy balance been maintained during BAL. However, it is possible that the relationship between energy balance and appetite is not linear as the analysis assumed. Third, appetite ratings and food preferences do not necessarily predict eating behaviour(Reference Stubbs, Hughes and Johnstone37). Allowing ad libitum food intake would have increased the external validity of the study, but would also have precluded assessing physiological responses across the spectrum of negative to positive energy balance. Fourth, intra-individual variability in GET measured by the SmartPill™ may be high, as suggested in one study wherein the coefficient of variability for measurements made 2–4 week apart ranged from 20 to 40 %(Reference Diaz Tartera, Webb and Al-Saffar44). However, those values were skewed by a small sample size and 10 % of participants whose GET measured >10 h during one measurement. When those outliers were removed, intra-individual differences in repeated measurements of GET averaged <1 h. Notably, that value is similar to or less than the mean between-condition differences observed after excluding five participants with GET > 10 h from the analysis in the present study (Fig. 4(b)). Finally, study results should not be generalised to women as others have reported sex differences in appetite and related physiological responses to increased exercise(Reference Hagobian, Sharoff and Stephens77).
Reasons for undereating during events requiring prolonged strenuous physical activity and limited sleep such as sustained military operations and ultra-endurance sporting competitions are multi-factorial and often include logistical constraints and limited access to food(19). Study findings suggest that energy balance is unlikely to be achieved by ad libitum eating in these environments, even if food availability is not constrained, due in part to a physiologically mediated suppression of appetite. The resulting energy deficit, if sustained, would be expected to degrade physical performance, cognition and immunity, and prolong recovery(Reference Murphy, Carrigan and Philip Karl3,21,Reference Montain and Young22,Reference Giles, Mahoney and Caruso51) . Study findings therefore provide a physiological basis for testing feeding strategies known to promote overconsumption during events requiring multiple days of prolonged low-to-moderate intensity physical activity such as sustained military operations. Such strategies may include timing meals or snacks to allow for gastric emptying, and providing rapidly digestible, higher-fat, energy-dense foods and beverages.
Acknowledgements
We thank the volunteers who participated in the study. We also thank Dr. Jennifer Rood and the Clinical Chemistry Laboratory team at the Pennington Biomedical Research Center for their assistance with the hormone analyses, Philip Niro for assistance with the figures and Dr. Andrew Young for critical review of the manuscript. Finally, we thank MAJ Julianna Jayne, LTC Nicholas Barringer, Dr. Tracey Smith, Dr. Emily Howard, Dr. Alyssa Varanoske, Svein Martini, Hilde Teien, Nancy Murphy, Chris Carrigan, Anthony Karis, Marques Wilson, Nicholes Armstrong, Susan McGraw, Claire Whitney, Beau Yurkevicius, Karleigh Bradbury, Adam Luippold, SGT Marcus Sanchez, SPC Kristine Chiusano, SPC Cornal Pounds, SSG Stephen Mason, SPC Jason Alaniz, SGT Katakyie Sarpong, SGT Joseph Bistolfi, and SPC Lauren Dare for their expert technical support throughout the study.
Funded by the US Army Medical Research and Development Command, Military Operational Medicine Research Program. The funder had no role in the study design, collection, analysis and interpretation of data, writing of the report or decision to publish.
J. P. K., A. H. M., G. F., J. A. G., L. M. M., S. R. H., J. P. M. and S. M. P. designed the study; A. H. M and J. T. A. coordinated data collection; J. P. K., A. H. M., J. A. T., H. S. F., P. N. R., J .A. G., L. M. M., S. R. H., J. P. M. and S. M. P. participated in data collection; J. P. K., A. H. M., J. T. A., H. S. F., G. F. and P. N. R. managed the data; J. P. K. analysed the data and wrote the manuscript; all authors critically reviewed the manuscript and approved the final version.
The authors declare that there are no conflicts of interest.
The opinions or assertions contained herein are the private views of the authors and are not to be construed as official or reflecting the views of the Army or the Department of Defense. Any citations of commercial organisations and trade names in this report do not constitute an official Department of the Army endorsement or approval of the products or services of these organisations. Approved for public release; distribution is unlimited.
Supplementary material
To view supplementary material for this article, please visit https://doi.org/10.1017/S0007114521000131


