


Postprandial lipaemia (PPL) is a complex and dynamic process that involves alteration of lipids and lipoproteins after one or more meals( Reference Ooi and Nordestgaard 1 ). Since 1947, it has been suggested that PPL plays an atherogenic role( Reference Moreton 2 ) and, consequently, is related to the pathogenesis of CVD( Reference Stefanutti, Labbadia and Athyros 3 – Reference Mora, Rifai and Buring 7 ). Exaggerated elevation of TAG in the postprandial period represents an abnormal response from the metabolism and is associated with increased morbidity and mortality( Reference Miller, Stone and Ballantyne 8 , Reference Nordestgaard and Varbo 9 ) owing to reduced sensitivity to insulin( Reference Bansal, Buring and Rifai 10 ) and endothelial dysfunction by increasing oxidative stress( Reference Bae, Bassenge and Kim 11 ).
Several diet factors, such as sugar-rich meals, can worsen postprandial hypertriacylglycerolaemic response( Reference Lairon, Lopez-Miranda and Williams 5 , Reference Cohen, Noakes and Benade 12 – Reference Parks, Skokan and Timlin 14 ). Among these, fructose stands out. Several studies have shown the effect of fructose-rich diets on postprandial TAG increase( Reference Abdel-Sayed, Binnert and Le 15 , Reference Bidwell, Fairchild and Redmond 16 ) – dose-related for quantities above 50 g/d( Reference Livesey and Taylor 17 ). The mechanisms seem to be associated with the stimulation of liver lipogenesis( Reference Parks, Skokan and Timlin 14 , Reference Stanhope, Schwarz and Keim 18 ), reduction of sensitivity to insulin( Reference Stanhope, Schwarz and Keim 18 , Reference Aeberli, Hochuli and Gerber 19 ) and secretion or reduction of VLDL-TAG clearance( Reference Chong, Fielding and Frayn 20 ). For this connection with the increase of atherogenic lipids and lipoproteins, it was suggested that fructose has an indirect role in increased CVD risk( Reference Miller, Stone and Ballantyne 8 ).
The effects of fructose consumption on fasting( Reference Livesey and Taylor 17 , Reference Chiavaroli, de Souza and Ha 21 , Reference Evans, Frese and Romero 22 ) and postprandial TAG (in acute and chronic forms) have been previously analysed by some systematic reviews with meta-analysis( Reference Livesey and Taylor 17 , Reference Evans, Frese and Romero 23 , Reference David Wang, Sievenpiper and de Souza 24 ). Two of these studies( Reference Chiavaroli, de Souza and Ha 21 , Reference David Wang, Sievenpiper and de Souza 24 ) presented important conflicts of interest declared by investigators arising from funding by the food industry and showed negative effects only when it contributes to excess of energy in the diet. Therefore, the aim of this study was to re-examine the chronic effect (>7 d) fructose consumption has on TAG during postprandial period, in adolescents and adults.
Methods
The entire process used in this study was elaborated in accordance with the guidelines presented in Preferred Reporting Items for Systematic Reviews and Meta-Analyses( Reference Liberati, Altman and Tetzlaff 25 , Reference Shamseer, Moher and Clarke 26 ). This review was registered at http://www.crd.york.ac.uk/prospero as CRD42017059987.
Eligibility criteria
The review considered studies in humans, such as clinical trials (parallel or cross-over designs) that evaluated the effect of fructose consumption (dissolved in liquid or added to some food and preparation) over a period of >7 d. The intervention should be compared with any other carbohydrate that does not contain fructose in the chemical composition, and there is no requirement for energy balance between the comparisons. Research was not limited by illnesses or exercise. The effect of fructose consumption on the postprandial TAG concentration was evaluated by comparing it with another carbohydrate (fructose-free) in hyperenergetic or isoenergetic conditions. Studies evaluating acute intervention were discarded. In cases of studies with several publications, only one was included.
Research strategy
The search was carried out in March 2017 and used different electronic databases such as Medline ® (Pubmed®), Embase® and Cochrane, and manual from the references of studies included. The research was composed of and associated with the following terms (and their respective related terms): ‘fructose’, ‘triglycerides’, ‘hyperlipidemia’. To expand the research, there was no delimitation of type or year of the study. Studies were limited to English, Portuguese and Spanish languages. Research strategy is detailed and available as online Supplementary Material.
Selection of studies
Two investigators (A. F. V. and C. E. J. M.) assessed titles and abstracts independently from all studies found during the research. Whenever the abstract did not provide sufficient information about inclusion and exclusion criteria, the full article was evaluated. Thereafter, the full study was evaluated and selected by the reviewers independently. The selection of studies was based on previously adopted eligibility criteria. Disagreements were settled by consensus, and in the case of continuing disagreement the evaluation was made by a third investigator (R. C. O. M.). Sampling duplication criteria was controlled by screening the period and place of recruitment, and authors were contacted for clarification when necessary.
Data extraction
Standardised form using the software Microsoft Office Excel® was adopted for proper data extraction, executed independently by two reviewers (A. F. V. and C. E. J. M.). The main features of the studies selected, such as author, year of publication, population and sample, methods, intervention, outcome and results, were written in detail. Eventual disagreements were settled by consensus by a third investigator (R. C. O. M.). Missing data were requested to the corresponding author of the study. In case of no answer, denying provision or data loss, the study was excluded. For data that were presented only graphically, the results were extracted using DigitizeIt ® software (I. Bormann). The studies in which the comparison was not made with carbohydrates and/or acute intervention (<7 d), as well as those using intravenous carbohydrate infusion, were excluded.
The outcome was the absolute delta of TAG concentration in a 4-h postprandial period. The deltas were calculated from peak values (4 h) and basal values (immediately before breakfast) for properly representing the postprandial TAG curve( Reference Kolovou, Mikhailidis and Kovar 6 , Reference Kolovou, Mikhailidis and Nordestgaard 27 – Reference Weiss, Fields and Mittendorfer 29 ). Values in mmol/l were transformed to mg/dl, multiplying by 88·5. Standard δ deviation was imputed by the equation proposed by Higgins & Green( Reference Higgins and Green 31 ).
Studies with two or more comparison or intervention groups within the same sample were included only once. When the study presented more than one comparison component (another carbohydrate) for the intervention (fructose), the data were extracted only by the following priority: starch>glucose.
Evaluation of bias risk
Evaluation of the methodological quality of the studies included proper randomisation generation, allocation concealment, blinding participants and/or therapist, blinding the assessors of outcomes and description of losses and exclusions, as proposed by Cochrane( Reference Higgins and Green 31 ). When these characteristics were described in the published document, it was considered that criteria were met and that they were satisfied and classified as ‘low risk’ and otherwise as ‘high risk’. The studies that did not describe these data were classified as ‘unclear risk’. Two reviewers (A. F. V. and C. E. J. M.) carried out quality assessment independently.
Data analysis
The results were presented with mean δ differences among treatments with 95 % CI. Mean difference expresses the difference of the intervention effect, when outcome values are standardised. The calculations were made based on random-effect models. Statistic treatment effect heterogeneity between studies was evaluated by Cochrane’s ‘Q’ test and ‘I 2’ inconsistency test, where it was considered that values higher than 50 % indicated high heterogeneity( Reference Higgins, Thompson and Deeks 32 ). Meta-analysis included comparison of fructose consumption with any other carbohydrate (without fructose in composition) on the variation of postprandial TAG (expressed by the delta values) immediately before breakfast (0) and at the 4-h peak. The value of α ≤0·05 was considered statistically significant.
The following sensitivity analyses were carried out: funding source, randomisation, energy balance, form of the carbohydrate provided, type of comparison (comparator), time of intervention (follow-up), amount of carbohydrate provided and length of analysis. The analysis of period >12 h was also performed by the 4-h data extraction, because not all studies showed the peak values in longer periods. The use of values other than the delta peak (in this case >12 h) would create a confounding factor by the use of another way to measure intervention v. control effect. Subdivision by amounts larger or smaller than 87 g was based in the 95th percentile of fructose consumption (p95) by the American population( Reference Marriott, Cole and Lee 33 ). The software Review Manager version 5.3 (Cochrane Collaboration) was used.
Furthermore, the funnel plot of the variable analysed was carried out to verify the bias of publication. Asymmetry was tested by the Begg and Egger test, being considered meaningful when P<0·10. The trim-and-fill test was used to estimate the publication’s bias effects in interpreting results. The software comprehensive meta-analysis version 2.0 was used.
Results
Research results
A total of 3337 studies were identified as eligible in the database search. After duplicates were removed, there were 2805 studies remaining. Of these, it was determined that 2797 were irrelevant based on title and/or summary review, and there were eight studies left. After integral reading, eight studies( Reference Stanhope, Schwarz and Keim 18 , Reference Bantle, Laine and Thomas 34 – Reference Heden, Liu and Park 40 ) and twelve interest interventions (Fig. 1) were included.
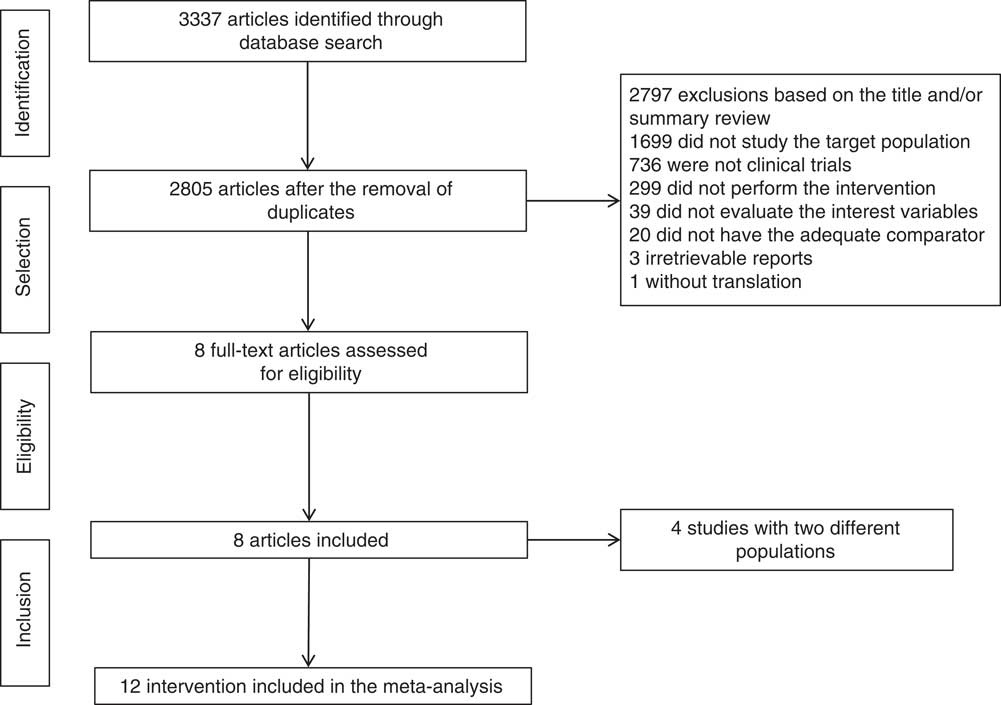
Fig. 1 Flow chart of studies included.
Description of the studies
The complete description of the studies is included in Table 1. Of the twelve interventions selected, five were with healthy individuals (41·6 %)( Reference Bantle, Raatz and Thomas 35 , Reference Swanson, Laine and Thomas 37 , Reference Stanhope, Bremer and Medici 39 , Reference Heden, Liu and Park 40 ), four with diabetics (33·3 %)( Reference Bantle, Laine and Thomas 34 , Reference Bantle, Swanson and Thomas 36 ) and three with overweight/obese individuals (25 %)( Reference Swarbrick, Stanhope and Elliott 38 – Reference Heden, Liu and Park 40 ). A total of 318 participants were included in this meta-analysis, of whom 148 were men (46·6 %) and 170 were women (53·4 %), with a mean age of 31 years (variation, 17–64 years).
Table 1 Characteristics of included studies (Mean values and standard deviations)

M, men; W, women; Ext, external to the laboratory; Lab, laboratory; DM1, type 1 diabetes; DM2, type 2 diabetes.
* Consumption control: dietetic, when all foods, beverages and supplements were provided. Supplementation, when only the intervention carbohydrate was provided by the investigator.
† Two studies presented periods in laboratory (neutral energy balance) and external environment (positive energy balance); however, there was no energy intake difference between the protocols (fructose v. glucose) of the study (isoenergetic).
‡ Two studies characterised participants according to age, amount of fat or BMI. The outcome was analysed with all included, but the group or subgroup’s total mean age was not disclosed.
§ The amount of carbohydrates administered in g/d and total diet energy percentage (%). When preceded by ‘~’, it represents the mean amount estimated reported indirectly by the study. In cases where data were unavailable, the value was calculated from 25 % of the total of a diet of 8368 kJ (2000 kcal).
|| Fructose could be supplied in liquid form (in the form of sweetened drink) or mixed (from solid foods and sweetened drinks).
¶ Comparison component refers to another carbohydrate (control) provided with the intervention (fructose), regardless of whether or not it is hyperenergetic.
** Macronutrients’ energy values for carbohydrates: proteins: fats informed in the study.
†† Represents the ratio between participants’ energy consumption and output. Positive when there was energy surplus. Neutral when both were considered equivalent.
Among the interventions selected, most were carried out in a cross-over (83·3 %) and randomised (75 %) design, and exclusively in an environment external to the laboratory (41·6 %). In most interventions, all foods and drinks of the diet were supplied (75 %). The mean period of intervention was 28 d (variation, 8–70 d).
The amount of fructose provided in the studies had a mean of 92·6 g (variation, 50–182 g) or 20 % of the total energy of the diet (variation, 10–25 %), mainly provided in a mixed form (solid and liquid) (58·3 %). Studies containing fructose in the comparison component’s composition, such as sucrose and maize syrup rich in fructose, were not selected. Thus, 50 % of the interventions used glucose and 50 % used starch as comparison components. The amount of fat at breakfast (the main meal analysed) had a variation of 30–40 % (or 10·6–34·7 g) of the total energy of the meal.
The participants’ diets were mainly composed of 55 % carbohydrates, 15 % proteins and 30 % fats (83·3 %). The energy balance was estimated as neutral (eight interventions) and positive (two interventions). Two interventions had distinct periods (positive and neutral), but were not separated because they have equal amounts of energy and macronutrients between the intervention and the comparator.
The most common analysis period for the referred variable, postprandial TAG, was 4 h (41·6 %). This measure was chosen, primarily, for most studies presenting peak value of this measure and because it provides a good evaluation of lipaemic curve and is a simple protocol that can be used for clinical purpose( Reference Kolovou, Mikhailidis and Kovar 6 , Reference Kolovou, Mikhailidis and Nordestgaard 27 – Reference Weiss, Fields and Mittendorfer 29 ).
Funding source was extracted and detailed from interventions, wherein 41·6 % were detailed, which could generate conflict of interest and alter the outcome of the study( Reference Mozaffarian 41 , Reference Lundh, Lexchin and Mintzes 42 ). Data were extracted as agency or agency/industry funding.
Risk of bias
Among the studies included, 75 % showed proper randomisation, 16·6 % reported allocation concealment, 33·3 % had blinded the participants and investigators, 16·6 % had blinded the assessors to the outcomes and 33·3 % reported description of sample losses (Fig. 2 and 3).
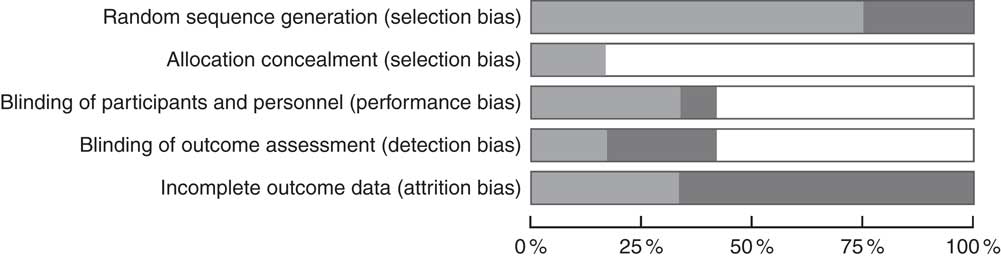
Fig. 2 Risk of bias of the studies included (percentage). ![]() , Low risk of bias;
, Low risk of bias; ![]() , unclear risk of bias;
, unclear risk of bias; ![]() , high risk of bias.
, high risk of bias.
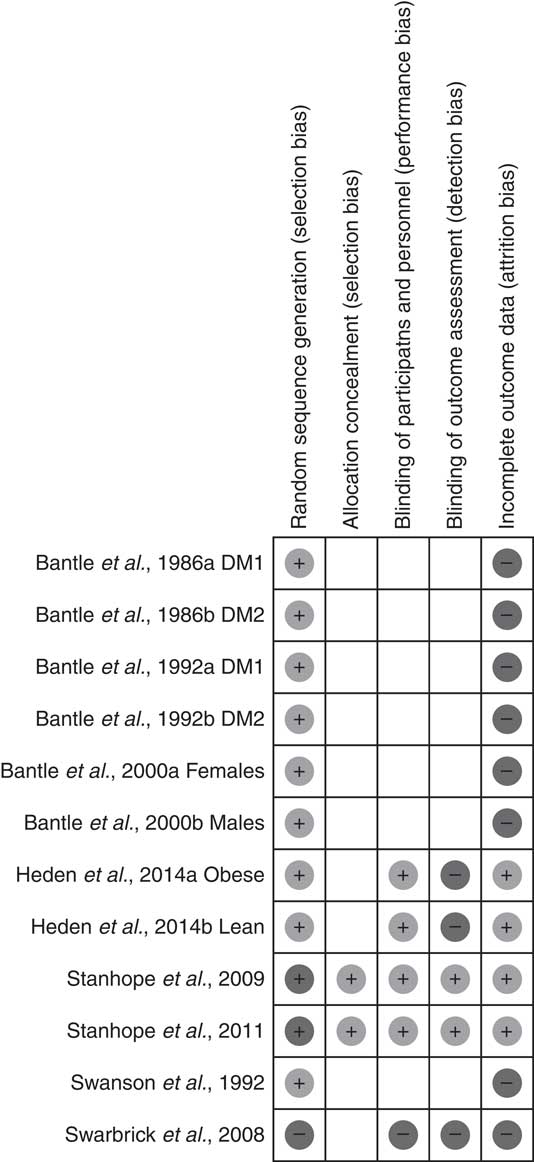
Fig. 3 Summary of risk of bias of the studies included. DM1, type 1 diabetes; DM2, type 2 diabetes.
Postprandial TAG
Compared with other carbohydrates (starch or glucose), fructose generated higher variation (delta) on the concentration of TAG in the postprandial period, evaluated in 4 h (mean difference: 8·02 (95 % CI 0·46, 15·58) mg/dl (0·09 (95 % CI 0·01, 0·18) mmol/l); I 2: 74 %). The high heterogeneity found (P<0·0001) was almost exclusively generated by one study( Reference Stanhope, Bremer and Medici 39 ). Its exclusion did not alter the total result of the meta-analysis (Fig. 4). There was no difference in publication bias analysis (Egger’s regression, P=0·128; online Supplementary Fig. S1).
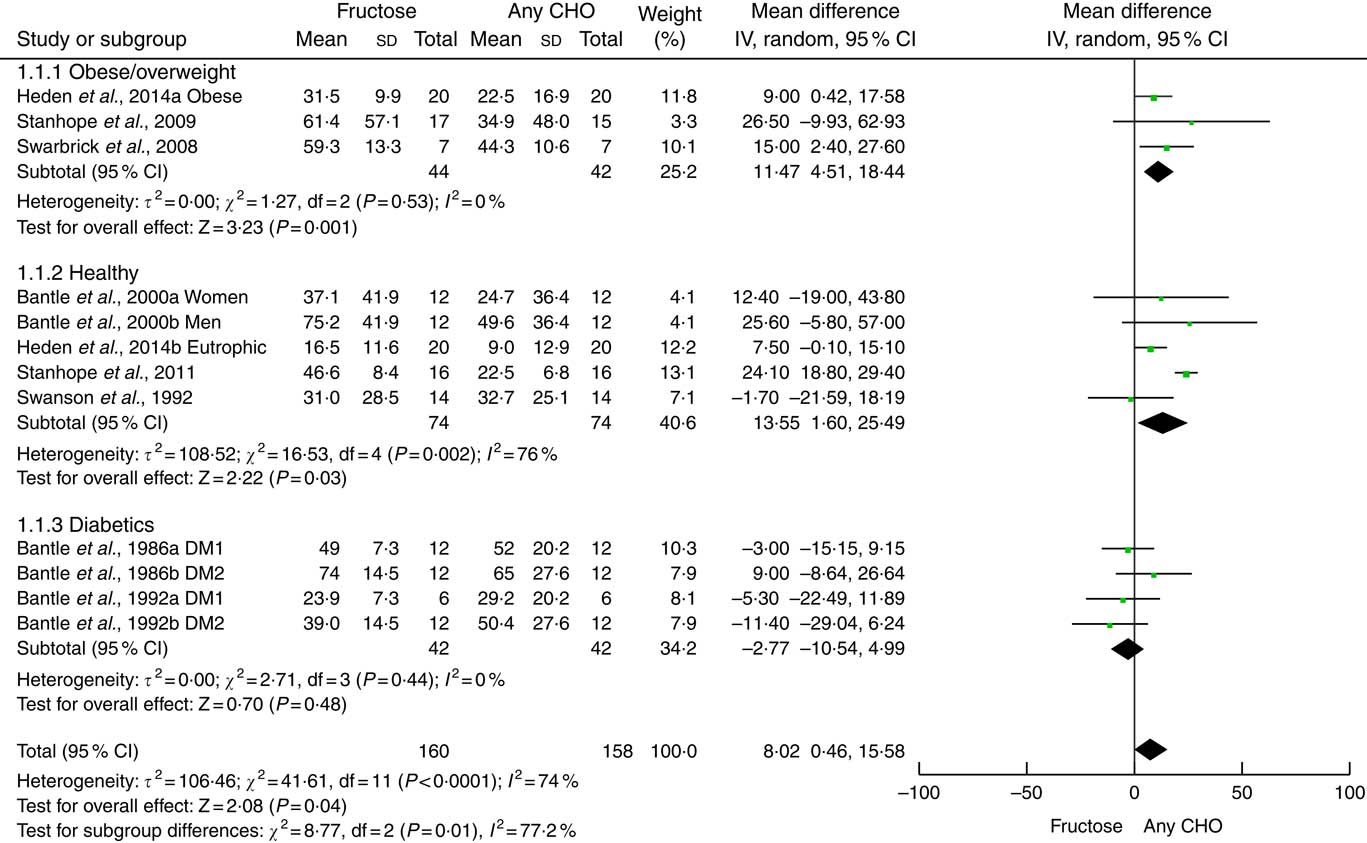
Fig. 4 Forest plot of the effect of fructose or any carbohydrate (CHO) consumption on postprandial TAG in obese/overweight, healthy and diabetic individuals. The estimation for each group (subtotal) and combined effect (total) are detailed. The data are in mean difference and 95 % CI (mg/dl) of the δ between fasting and 4-h peak TAG. Significance values for the random-effect model. Values in mg/dl can be transformed to mmol/l by multiplying by 0·0113. DM, diabetes mellitus.
The analysis of subgroups showed higher variation of TAG concentration for overweight/obese individuals (mean difference: 11·47 (95 % CI 4·51, 18·44) mg/dl (0·13 (95 % CI 0·05, 0·21) mmol/l); I 2: 0 %) and healthy individuals (mean difference: 13·55 (95 % CI 1·60, 25·49) mg/dl (0·15 (95 % CI 0·02, 0·29) mmol/l); I 2: 76%) but not in diabetics (mean difference: −2·77 (95 % CI −10·54, 4·99) mg/dl (−0·03 (95 % CI −0·12, 0·06) mmol/l); I 2: 0 %). High heterogeneity in healthy individuals (P=0·002) was exclusively generated by one study( Reference Stanhope, Bremer and Medici 39 ). Its withdrawal did not alter the result of the subgroup.
Owing to the high heterogeneity, sensitivity analyses were carried out in the interventions for the following: (a) funding, industry/agency (mean difference: −2·63 (95 % CI −9·86, 4·60) mg/dl (−0·03 (95 % CI −0·11, 0·05) mmol/l); P=0·48; I 2: 0 %) and agency (mean difference: 15·20 (95 % CI 7·40, 23·00) mg/dl (0·17 (95 % CI 0·08, 0·26) mmol/l); P=0·0001; I 2: 65 %) (online Supplementary Fig. S2); (b) amount of carbohydrate, <87 g (mean difference: 6·97 (95 % CI 2·14, 11·80) mg/dl (0·08 (95 % CI 0·02, 0·13) mmol/l); P=0·005; I 2: 0 %) and >87 g (mean difference: 7·55 (95 % CI −6·40, 21·49) mg/dl (0·09 (95 % CI −0·07, 0·24) mmol/l); P=0·29; I 2: 81 %) (subdivision by amounts larger or smaller than 87 g was based in the p95 fructose consumption by the American population)( Reference Marriott, Cole and Lee 33 ) (online Supplementary Fig. S3); (c) randomisation, yes (mean difference: 3·93 (95 % CI −1·42, 9·29) mg/dl (0·04 (95 % CI −0·02, 0·10) mmol/l); P=0·26; I 2: 21 %) and no (mean difference: 22·8 (95 % CI 17·96, 27·64) mg/dl (0·26 (95 % CI 0·20, 0·31) mmol/l); P<0·00001; I 2: 0 %) (online Supplementary Fig. S4); (d) energy balance, positive (mean difference: 14·78 (95 % CI 3·94, 25·62) mg/dl (0·17 (95 % CI 0·04, 0·29) mmol/l); P=0·008; I 2: 82 %) and neutral (mean difference: 3·11 (95 % CI −4·80, 11·01) mg/dl (0·04 (95 % CI −0·05, 0·12) mmol/l); P=0·44; I 2: 36 %) (online Supplementary Fig. S5); (e) form of fructose, liquid (mean difference: 14·78 (95 % CI 5·94, 23·62) mg/dl (0·17 (95 % CI 0·07, 0·27) mmol/l); P=0·001; I 2: 76 %) and mixed (mean difference: −0·42 (95 % CI −7·58, 6·75) mg/dl (0·00 (95 % CI −0·09, 0·08) mmol/l); P=0·91; I 2: 6 %) (online Supplementary Fig. S6); (f) type of comparison (comparator), starch (mean difference: 1·19 (95 % CI −7·73, 9·51) mg/dl (0·01 (95 % CI −0·09, 0·11) mmol/l); P=0·78; I 2: 40 %) and glucose (mean difference: 15·33 (95 % CI 6·02, 24·64) mg/dl (0·17 (95 % CI 0·07, 0·28) mmol/l); P=0·001; I 2: 70 %) (online Supplementary Fig. S7); (g) follow-up,<30 d (mean difference: 4·92 (95 % CI −4·41, 14·25) mg/dl (0·06 (95 % CI −0·05, 0·16) mmol/l); P=0·30; I 2: 83 % and >30 d (mean difference: 16·85 (95 % CI 6·35, 27·34) mg/dl (0·19 (95 % CI 0·07, 0·31) mmol/l); P=0·002; I 2: 0 %) (online Supplementary Fig. S8); (h) length of analysis, 4 h (mean difference: −2·63 (95 % CI −9·86, 4·60) mg/dl (−0·03 (95 % CI −0·11, 0·05) mmol/l); P=0·48; I 2: 0 %) and >12 h (mean difference: 15·20 (95 % CI 7·40, 23·00) mg/dl (0·17 (95 % CI 0·08, 0·26) mmol/l); P=0·0001; I 2: 65 %) (online Supplementary Fig. S9).
Apparently, authors or studies that received funding support from the industry had a tendency to show no increase in TAG concentration after fructose consumption. Non-randomised interventions, positive energy balance, liquid fructose, glucose comparison component, total period of intervention >30 d (follow-up) and length of analysis >12 h influenced the results of the study.
Discussion
The main finding of this systematic review with meta-analysis is that chronic fructose consumption (>7 d) causes higher variation of TAG concentration in the postprandial period when compared with other carbohydrates (glucose or starch). This variation (delta) from fasting (immediately before breakfast) to 4-h peak TAG was about 8·02 mg/dl (0·09mmol/l). This effect occurred in healthy and overweight/obese individuals, but not in diabetics.
Fructose is absorbed in the final portion of the duodenum and ileum, in the small intestine, from non-dependent Na process. From portal circulation, the monosaccharide is transported to the liver, where it can be converted to glucose, lactate, glycogen, glycerol and fatty acids( Reference Sun and Empie 43 – Reference Bray, Nielsen and Popkin 45 ), regardless of insulin secretion( Reference Stanhope, Bremer and Medici 39 ). In healthy individuals, fructose is oxidised at approximately 45 %, within a period from 3 to 6 h after ingestion, including the entry of carbons in the lipogenesis pathway( Reference Sun and Empie 43 ). The postprandial hyperlipidic effect of fructose seems to originate directly from the synthesis of fatty acids and glycerol in hepatocytes( Reference Parks, Skokan and Timlin 14 , Reference Chong, Fielding and Frayn 20 ), and indirectly by the smaller withdrawal of TAG from the plasma by reduction in the activation of lipoprotein lipase from the adipose tissue( Reference Chong, Fielding and Frayn 20 ).
Different studies showed that fructose-rich diets induce alterations in the lipid metabolism in eutrophic and overweight/obese individuals( Reference Abdel-Sayed, Binnert and Le 15 , Reference Stanhope, Schwarz and Keim 18 , Reference Stanhope, Bremer and Medici 39 , Reference Faeh, Minehira and Schwarz 46 ). The addition of fructose (1·0–3·0 g/kg per d) to the diet increases fasting( Reference Abdel-Sayed, Binnert and Le 15 , Reference Egli, Lecoultre and Theytaz 47 , Reference Le, Faeh and Stettler 48 ) and postprandial( Reference Bidwell, Fairchild and Redmond 16 , Reference Stanhope, Schwarz and Keim 18 , Reference Stanhope, Bremer and Medici 39 ) lipaemia. Moreover, it is associated with the reduction of liver sensitivity to insulin( Reference Ter Horst, Schene and Holman 49 ), even at moderate doses (40 g/d)( Reference Aeberli, Hochuli and Gerber 19 ), and decrease of fat oxidation( Reference Cox, Stanhope and Schwarz 50 ).
A series of sensitivity analyses was carried out in order to verify heterogeneity on the results found. One analysis accentuated the relation between industry funding and null results of fructose on postprandial TAG. Clearly, the conflict of interests can interfere in the conclusions of a particular study( Reference Lundh, Lexchin and Mintzes 42 ). Currently, the influence of funding by the food industry on several health outcomes has been discussed, as well as how it could modify guidelines of nutrition( Reference Mozaffarian 41 , Reference Bes-Rastrollo, Schulze and Ruiz-Canela 51 , Reference Chartres, Fabbri and Bero 52 ). Some systematic reviews with meta-analysis have been published on the effects of fructose on blood lipids( Reference Livesey and Taylor 17 , Reference Chiavaroli, de Souza and Ha 21 , Reference Sievenpiper, Carleton and Chatha 53 ), glycaemic control on diabetes( Reference Cozma, Sievenpiper and de Souza 54 ), blood pressure( Reference Ha, Sievenpiper and de Souza 55 ), markers of non-alcoholic liver steatosis( Reference Chiu, Sievenpiper and de Souza 56 ), weight gain( Reference Sievenpiper, de Souza and Mirrahimi 57 ), uric acid( Reference Wang, Sievenpiper and de Souza 58 ) and postprandial TAG( Reference David Wang, Sievenpiper and de Souza 24 ). These studies also compared fructose with fructose-containing carbohydrates, including sucrose and high-fructose maize syrup (HFCS), which are more likely to show a small or no effect on different metabolic outcomes( Reference Stanhope, Griffen and Bair 59 ). Despite the fact that all these studies received funding support from the food industry (which produces or uses fructose in products), results remain feasible but must be interpreted with caution.
The median amount of fructose among the studies selected was approximately 93 g, which represents approximately 86 % higher than AHA recommendations, but only approximately 7 % above p95 of the consumption by the American population( Reference Marriott, Cole and Lee 33 ). This meta-analysis found that quantities smaller than 87 g of fructose/d are enough to promote variation in postprandial TAG, as demonstrated in a previous meta-analysis that observed the threshold of 50 g/d for the general population( Reference Livesey and Taylor 17 ) and 60 g/d for type 2 diabetes( Reference Sievenpiper, Carleton and Chatha 53 ). These thresholds are very close to the average consumption (49 g) by the American( Reference Marriott, Cole and Lee 33 ) and Dutch( Reference Sluik, Engelen and Feskens 60 ) population. However, some authors stated that this effect only occurs when there is positive energy balance or when fructose is generating a hyperenergetic condition in comparison with another carbohydrate( Reference Chiavaroli, de Souza and Ha 21 , Reference David Wang, Sievenpiper and de Souza 24 ). This effect was equally found in our study from sensitivity analysis.
The recent meta-analysis by Evans et al. ( Reference Evans, Frese and Romero 23 ) found no difference in postprandial TAG with acute fructose consumption when compared with glucose or sucrose. Furthermore, the authors also propose replacing those sugars for fructose, once they did not find TAG alterations, and glycaemia and insulinaemia reduction were found in the postprandial period. Our view is contrary, as our sensitivity analysis showed that a total time of intervention (follow-up) extended for over 30 d influenced TAG variation. Although increasingly studied, the effects of chronic fructose consumption are still discordant and are not fully elucidated in the literature because of a number of confounding factors (e.g. fructose dose, excess of energy in the diet, diabetes, obesity)( Reference Tappy and Le 61 ).
Some limitations are present in our study. (1) Data showed high heterogeneity; sensitivity analysis demonstrated that this effect was being almost exclusively generated by one study( Reference Stanhope, Bremer and Medici 39 ) but its removal does not alter the result of subgroups and total results of the meta-analysis. (2) The inclusion of a study with adolescents( Reference Heden, Liu and Park 40 ) could create a confusion factor, but it was considered important for representing the metabolic intervention effect on different age groups. (3) One study( Reference Swarbrick, Stanhope and Elliott 38 ) did not clearly show the amount of fructose provided (in grams or % of the diet) and, in this case, had to be removed. (4) The amount of fructose varied to a great extent among studies (50–182 g), showing lack of intervention standardisation and often the provision of supraphysiological doses( Reference Choo and Sievenpiper 62 ). (5) All interventions that evaluated diabetics analysed plasma TAG over a period of 4 h, which may represent a bias; studies with longer analysis periods especially in diabetic subjects are needed. (6) The quality of studies varied between groups, presenting higher risk of bias in diabetes interventions.
Findings from this systematic review with meta-analysis update the results previously described by Wang et al. ( Reference David Wang, Sievenpiper and de Souza 24 ) and showed the negative effects of chronic (>7 d) fructose consumption on postprandial TAG, in healthy adolescents and adults, as well as in overweight/obese individuals, but not in diabetics. As chronic ingestion of fructose may promote lipaemic alterations, and hypertriacylglycerolaemia in the postprandial period is associated with increased morbimortality, recommendations for the population are needed to limit intake, especially from liquids (e.g. sweetened beverages). Longitudinal studies (>30 d), well-controlled, with habitual doses of consumption between 49 and 87 g (close to the p95 of the population) and in different forms (free fructose, HFCS, sucrose) are necessary to clarify the interrelationship between fructose, lipaemia and CVD.
Acknowledgements
The authors thank authors Timothy Daniel Heden, Jill Kanaley and John Sievenpiper for responding our emails and Josianne Krause and Daniel Umpierre for aiding with data analysis.
C. E. J. M. has received PhD scholarship from the Coordenação de Aperfeiçoamento de Pessoal de Nível Superior.
R. C. O. M. formulated the research question; A. F. V. and C. E. J. M. read and extracted data. A. F. V., C. E. J. M., R. C. O. M. analysed the data. R. C. O. M., A. F. V., C. E. J. M. and A. R.-O. wrote, reviewed, performed and perfected this study.
The authors declare that there are no conflicts of interest to declare.
Supplementary material
For supplementary material/s referred to in this article, please visit https://doi.org/10.1017/S0007114518001538


