


Dietary intake of young children is an important determinant of their current and future health(Reference Brisbois, Farmer and McCargar1,Reference Dwyer2) . Growing evidence demonstrating the association between poor dietary habits during early childhood and future risks of chronic diseases(Reference Brisbois, Farmer and McCargar1,Reference Dwyer2) has made optimising dietary intakes of young children an increasing priority. Accurate assessment of young children’s diets is thus essential to understand their nutritional status and changes in diet over time.
FFQ are commonly used in large cohort studies, as the average long-term diet (e.g. intakes over weeks) is conceptually more important in epidemiological research than intakes over a few specific days (using short-term food recalls or diet records)(Reference Willett3). Having an age appropriate, as well as a reliable and valid FFQ is essential to accurately capture dietary intakes of the population under study(Reference Shim, Oh and Kim4), as different age groups consume different range and variety of foods. Several FFQ have been developed to capture dietary intake of children younger than 12 years of age(Reference Olukotun and Seal5,Reference Saravia, Miguel-Berges and Iglesia6) . These FFQ are most often completed by a parent or primary caregiver due to children’s limited knowledge of foods, and ability to recall foods eaten and estimate portion size. Validation studies of these FFQ have shown that parent-administered FFQ, especially those that involve the child, are relatively valid in assessing the child’s dietary intakes when compared with a reference method(Reference Olukotun and Seal5,Reference Saravia, Miguel-Berges and Iglesia6) .
The widespread usage of computers or mobile devices with Internet access in recent years has led to the emergence of web-based dietary assessment tools(Reference Garcia-Segovia, Gonzalez-Carrascosa and Martinez-Monzo7,Reference Storey8) . The development and use of web-based FFQ have been increasingly common in cohort studies(Reference Storey8,Reference Long, Littlefield and Estep9) due to the lesser demand on manpower for administration and data entry. The accessibility of the Internet means that web-FFQ can be administered at any time and location with Internet access. Additionally, the capacity to incorporate extensive food and portion size photographs can enhance food recognition and portion size estimation by participants, thus eliminating the need for trained interviewers without compromising on data quality(Reference Garcia-Segovia, Gonzalez-Carrascosa and Martinez-Monzo7–Reference Long, Littlefield and Estep9). The web-FFQ can also be pre-programmed to check for missing or multiple response and alert participants to correct these errors. Taken together, the web-FFQ represents a more cost-effective method to collect repeated dietary data on a large scale, compared with traditional paper and pencil FFQ.
The web-FFQ is thus advantageous for large cohort studies to assess dietary intakes of participants longitudinally, such as the Growing Up in Singapore Towards healthy Outcomes (GUSTO) study(Reference Soh, Tint and Gluckman10) which aims to track the diets of Singaporean children till adolescence and possibly adulthood. However, some participants within the same study may not be able to complete the FFQ online or may choose to only complete a paper-based version. Differences in the formats of the web- and paper-FFQ raise questions about whether data captured using these different formats can be pooled.
A previously validated paper-FFQ for assessing dietary intakes of 5-year-old children in GUSTO(Reference Sugianto, Chan and Wong11) was modified to capture dietary intakes of 7-year-old children. A web-FFQ was then developed based on this modified paper-FFQ. The present study aimed to: (1) compare estimates of intakes obtained using the paper-FFQ with those obtained using the web-FFQ and (2) examine the relative validity of the paper- and web-FFQ against 3-d diet records (3DDR).
Methods
Study sample
The GUSTO study is an ongoing mother–offspring cohort study in Singapore which recruited pregnant women during their first-trimester between June 2009 and September 2010, and followed their offspring prospectively since birth(Reference Soh, Tint and Gluckman10). The primary objective of GUSTO is to study the relationships of early life environmental factors and their influence on offspring’s health and development. The cohort design and study protocol have been published previously(Reference Soh, Tint and Gluckman10).
The present study is nested within GUSTO’s follow-up when the children were 7 years of age, and conducted in a subset who attended clinic visits between June 2017 and June 2018 (the main GUSTO’s clinic visits ran from November 2016 to June 2018). All procedures in GUSTO have received ethical approval from the Institutional Review Boards at KK Women’s and Children’s Hospital (CIRB 2018/2767) and National University Hospital (DSRB D/2009/00021, B/2014/00406) where the participants were recruited, and were conducted in accordance to the Declaration of Helsinki. Written informed consent was acquired from participants at study recruitment and subsequently at each sub-study.
Study design
The main GUSTO follow-up asked all mothers (or main caregivers familiar with the child’s diet) to complete one version of the FFQ (paper or web) and a 3DDR at home prior to their visit at the clinic. Mothers were encouraged to complete the dietary assessments together with their child. For this study, mother–child pairs were asked to complete a paper-FFQ, a web-FFQ and a 3DDR. Mother–child pairs scheduled to attend GUSTO’s clinic visits during June–December 2017 were assigned to first complete the paper-FFQ at home and then invited to complete the web-FFQ at the clinic (Group 1). Those scheduled to attend clinic visits during January–June 2018 were assigned to first complete the web-FFQ at home and then invited to complete the paper-FFQ at the clinic (Group 2). This is to account for sequence effect, as mothers may become familiar with the FFQ after completing the first time and become better at completing the second time. Completion of a second version of the FFQ is entirely voluntary. We ceased recruitment after 120 mother–child pairs completed two separate versions of FFQ at home and at the clinic, as well as a 3DDR (following Willett’s recommendation of at least 100 participants for a validation study(Reference Willett3)). Out of the 120 who have completed all three dietary assessments, only those with no more than 20 % missing responses in paper-FFQ and with 3 d of complete data in the 3DDR were included in this analysis (Fig. 1).

Fig. 1. Flow chart of mother–child pairs included in evaluation of the FFQ in the GUSTO study. 3DDR, 3-d diet records; GUSTO, Growing Up in Singapore Towards healthy Outcomes.
Either the paper-FFQ or an instruction sheet containing the log-in details to the web-FFQ (e.g. hyperlink, unique username and password) was mailed to participants 7 weeks before their clinic visit depending on the sequence allocated (Fig. 2). The 3DDR was mailed together with the paper-FFQ or the web-FFQ instruction sheet. Mothers were instructed to only complete the FFQ and 3DDR 2 weeks’ prior to their clinic visit. SMS text messaging reminders were sent when the time comes for mothers to complete the FFQ and 3DDR at home. The contact number of a designated research staff was included in the mail package to facilitate answering questions related to filling out the FFQ and 3DDR when at home. Those who completed both the paper- and web-FFQ were asked to complete a usability questionnaire at the clinic.

Fig. 2. Timeline of FFQ and diet records administration for evaluation of the web-based, pictorial FFQ in the GUSTO study. 3DDR, 3-d diet records; GUSTO, Growing Up in Singapore Towards healthy Outcomes; SMS, short message service.
Additionally, mothers’ self-reported ethnicity, highest education attained and monthly household income were collected at the recruitment visit (< 14 weeks’ gestation). Information on the child’s sex was extracted from hospital delivery records. At the Year-7 study visit, child’s height was measured to the nearest 0·1 cm using a stadiometer (SECA 213) and weight measured to the nearest gram using calibrated weighing scales (SECA 803). Age and sex-specific BMI z-scores were derived using WHO reference(Reference de Onis, Onyango and Borghi12); children with BMI z-scores > 1 SD were classified as overweight or obese.
Growing Up in Singapore Towards healthy Outcomes Year-7 paper-FFQ
The paper-FFQ assesses food intake of 7-year-old children over the past 1 month through parent report. It is a quantitative FFQ, self-administered by mothers or main caregivers familiar with the child’s diet. The paper-FFQ was modified from the previously validated paper-FFQ designed to assess dietary intakes of 5-year-old children in GUSTO(Reference Sugianto, Chan and Wong11), to more closely reflect dietary habits of children of this age. Further details on the Year-7 paper-FFQ are described in online Supplementary Methods. In brief, mothers were asked to indicate their child’s consumption of 120 food items from seven frequency options ranging from ‘never’ to ‘2–3 times per day’, and the average amount consumed using household measurements. To assist in portion size estimation, images of standard household utensils (e.g. bowls, spoons and a standard plate) and portion sizes (2–3 photographs per item) of twelve food items (e.g. dessertspoons of meat or vegetables, pieces of fruits, a bowl of cereals, a slice of cake) were provided in a separate sheet.
Growing Up in Singapore Towards healthy Outcomes Year-7 web-FFQ
The content of the web-FFQ is identical to the paper-FFQ in terms of wording of questions, number of food items and number of frequency options, but with an expanded list of portion size options (described below). The web-FFQ was also designed to be self-administered by mothers or main caregivers and can be completed using computers, tablets or mobile devices. The design of the web-FFQ was guided by a review of literature on existing computer- or web-based FFQ(Reference Storey8,Reference Long, Littlefield and Estep9,Reference Kristal, Kolar and Fisher13–Reference Labonte, Cyr and Baril-Gravel15) , and additionally incorporated automated skipping of infrequently consumed food items, inclusion of food pictures and portion size photographs for each FFQ item, and real-time checking of missing or multiple responses.
With automated skipping, mothers will be taken through different food categories to select foods (each represented with a generic food picture) consumed by their child in the past month, instead of going through a lengthy list of food items as in the paper-based version. Subsequent questions on consumption frequency and portion size will focus on the foods they have selected. Questions on foods they have not selected (i.e. infrequently consumed) will be skipped. With this feature, the completion time of the web-FFQ averages 20–30 min compared with 45–60 min for the paper-FFQ (based on observing those who completed either of the FFQ at clinic visit).
Unlike the paper-FFQ where images were limited to twelve foods and only 2–3 portion size images per food, the web-FFQ had a food picture and 3–6 standardised portion size photographs for every food item in the FFQ (refer to online Supplementary Methods for detailed photography protocol). The options for portion sizes were based on commonly reported portion sizes of children and their mothers collected at earlier time points of the GUSTO study(Reference Sugianto, Chan and Wong11,Reference Lim, Toh and Tan16) .
By incorporating real-time checking of missing responses, participants will be alerted to indicate a frequency of consumption and a portion size for every food item selected before being able to proceed to answer questions on the next food item.
Prototypes of the web-FFQ were subjected to a few rounds of in-house testing among the research team. The final beta-version was tested among a group of mothers (n 10) with young children (3–7 years of age) not involved in the GUSTO study. During each testing, research staffs reviewed the web-FFQ with the user to identify questions or graphics that were confusing or portion sizes that were too small or large. Any issues identified and feedback obtained during testing were used to inform the final version of the web-FFQ.
3-d diet records
Written instructions (including examples) and answers to frequently asked questions regarding diet record keeping were provided together with the 3DDR to help mothers complete with sufficient details and precision. Food photographs of standard household measuring utensils and commonly consumed portion sizes were also provided. This method was adopted as mothers would have been coached on how to complete diet records at previous GUSTO time points. Mothers were instructed to record their child’s food intake over 2 weekdays and 1 weekend day, and preferably non-consecutive days. Records of 1 weekday and 2 weekend days as well as records of consecutive days were permitted, if mothers found it challenging to record non-consecutive 2 weekdays and 1 weekend day.
Usability questionnaire
We developed a paper-based usability questionnaire by adapting questions used in previous studies(Reference Beasley, Davis and Riley14,Reference Vereecken, Covents and Maes17–Reference Carter, Albar and Morris19) to obtain feedback on the format preference of the FFQ (paper- or web-based), as well as the ease of use, attractiveness, clarity, overall completion experience of the web-FFQ. Mothers were asked to rate their level of agreement with ten usability statements on a 5-point Likert scale, ranging from strongly agree to strongly disagree. The questions alternated between positively phrased and negatively phrased statements to reduce acquiescent bias (i.e. agreeing to all statements). Percentages for each agreement level were calculated for each question. For easier analysis, agree and strongly agree were merged as well as disagree and strongly disagree.
Dietary data analyses
As aforementioned, paper-FFQ with ≤ 20 % missing responses were included in the validation study. These missing responses were imputed with mode or median values from the whole cohort. Following previous methods(Reference Sugianto, Chan and Wong11,Reference Lim, Toh and Tan16) , nutrient analysis of data from all three dietary assessments was performed using the nutrient analysis software Dietplan (Forestfield Software) based on a food composition database containing local foods.
The 120 food items of both FFQ were collapsed into twenty-five food groups based on similar nutrient profile (online Supplementary Table S1). The same number of food groups and food group definitions was used for 3DDR. Food groups, identified from any of the dietary assessments, to have a high proportion of participants with no consumption in a day (> 33·3 % in online Supplementary Table S1) were excluded from comparison: spreads, oats and breakfast cereals, other types of cereals, flavoured rice dishes, porridge, soup, legumes, nuts and soyabean products, dried fruits, processed meat, local steamed snacks, sweetened and non-sweetened drinks. This is such that all food groups intakes can be evenly split across tertiles for calculation of Cohen’s κ and joint cross-classification analysis (described below). The remaining thirteen food groups were included in analysis.
Statistical analyses
To account for misreporting of dietary intake, children with energy intake outside of 2000–20000 kJ/d(Reference Moghames, Hammami and Hwalla20,Reference Preston, Palacios and Rodriguez21) assessed by any of the dietary assessments were excluded from analysis. The distributions of food groups and nutrients were skewed and were log-transformed. All food groups and nutrients (except energy) were energy adjusted using the residual method(Reference Willett3). Average daily intakes of energy, eleven nutrients and thirteen food groups, estimated using paper-FFQ, web-FFQ and 3DDR were compared using Kruskal Wallis tests with Bonferroni post hoc analysis to identify significant differences in intakes among the dietary assessments.
The correlations of energy, nutrients and food groups intakes measured by the paper-FFQ, web-FFQ and 3DDR were examined using Pearson’s correlation coefficients. The agreement of the three dietary assessments was evaluated using Lin’s concordance coefficients and Bland–Altman plots. These methods evaluate dietary variables in a continuous scale(Reference Lin22,Reference van Stralen, Dekker and Zoccali23) . In addition, categorical agreement, the ability to correctly categorise subjects using the dietary assessments, was examined using Cohen’s κ coefficients with quadratic weightings and joint cross-classification analysis which estimates the percentage of children classified by each pairing of dietary assessments into the same or extreme tertiles. Based on cut-offs commonly used in literature, Pearson’s correlation coefficients of ≥ 0·50 were considered good and 0·30–0·49 were considered acceptable(Reference Masson, McNeill and Tomany24,Reference Willett25) . Lin’s concordance coefficients were interpreted similar to Pearson’s correlation(Reference Altman26,Reference Akoglu27) . Cohen’s κ values of ≤ 0·20 indicate poor-slight agreement, 0·21–0·40 fair agreement, 0·41–0·60 moderate agreement and > 0·60 substantial-perfect agreement(Reference Landis and Koch28). For percentages of tertile agreement, ≥ 50 % correct classification into the same tertile and ≤ 10 % misclassification into extreme tertiles were considered good(Reference Masson, McNeill and Tomany24); percentages close to recommended (i.e. ≥ 40 % correct classification and ≤ 15 % misclassification) were considered acceptable. All statistical analyses were performed using Stata version 14 (StataCorp).
Results
After excluding those with ≥ 20 % missing responses in paper-FFQ, less than 3 d data in the 3DDR, data loss in web-FFQ and reported energy intakes outside of the plausible range, the final analysis compared dietary intakes of ninety-two children (Fig. 1).
Characteristics of mother–child pairs
The study sample for this analysis consisted of 51·1 % male and 48·9 % female children, with ethnic proportions of 51·1 % Chinese, 31·5 % Malay and 17·4 % Indian, respectively. Mothers of most children (73·9 %) attained post-secondary educational level, and 31·5 % children were of households with the highest monthly income (> SGD $6000). The ethnic profile and socio-economic status of the current study sample were comparable to the larger GUSTO cohort(Reference Soh, Tint and Gluckman10). Approximately 30·4 % of these children were classified as overweight or obese.
Comparison between paper- and web-FFQ
Comparing the average intakes between the FFQ, the paper-FFQ significantly over-estimated energy and majority of nutrients, except for fibre, Fe and β-carotene (Table 1). However, the paper- and web-FFQ showed good correlations (≥ 0·50) in estimating energy and nutrients intakes (Table 2). Likewise, their concordance for energy and the majority of nutrients intakes ranged between acceptable to good (0·31–0·69), except for carbohydrate, protein and total fat. Based on Cohen’s κ values, both FFQ showed moderate to substantial agreement (0·46–0·69) in classifying according to energy and nutrients intakes. Similarly, ≥ 50 % correct classification into same tertile and ≤ 10 % misclassification into extreme tertiles were observed for energy and all nutrient intakes.
Table 1. Average daily energy, nutrients and food groups intakes estimated from the paper- and web-based FFQ, and 3-d diet records in the Growing Up in Singapore Towards healthy Outcomes cohort
(Median values and interquartile ranges, n 92)

DR, diet records; IQR, inter-quartile range.
* P-values are for Kruskal Wallis tests of differences between groups
† median values in a row without a common symbol differ, P < 0·05 based on Bonferroni post hoc analysis.
‡ Intakes are expressed in units of ml/d instead of g/d.
Table 2. Pearson’s correlation, Lin’s concordance, Cohen’s κ and cross-classification of tertiles between the paper- and web-based FFQ in the Growing Up in Singapore Towards healthy Outcomes cohort
(95 % confidence intervals, n 92)

r, Pearson’s correlation coefficient; r c , Lin’s concordance coefficient; κ, Cohen’s κ coefficient.
* Based on log-transformed, energy-adjusted values.
The paper-FFQ significantly over-estimated majority of food groups intakes except for breads, cruciferous and dark green vegetables, and other vegetables, when comparing the average intakes with those of the web-FFQ (Table 1). Pearson’s correlation coefficients of ≥ 0·50 were observed for majority of food groups except for dairy products (excluding milk) (Table 2). Similarly, acceptable to good concordance (0·43–0·84) was observed for majority of food groups except for dairy products (excluding milk). The κ values showed fair to substantial agreement (0·34–0·71) between the paper- and web-FFQ in classifying children according to their food groups intakes. Likewise, ≥ 40 % correct classification into same tertile with ≤ 15 % of misclassification into extreme tertiles was observed for all food groups intakes.
Validation of paper-FFQ against 3-d diet record
When compared against 3DDR, the paper-FFQ significantly over-estimated energy and majority of nutrients, except for fibre and Fe (Table 1). The paper-FFQ demonstrated acceptable to good correlations with 3DDR (0·31–0·70) in estimating intakes of energy and most nutrients, but poor correlations (< 0·30) in estimating intakes of total fat and specific types of fats (Table 3). In contrast, the paper-FFQ had poor concordance with 3DDR in estimating intakes of energy and most nutrients (< 0·30), except for vitamin A, β-carotene and Ca intakes which had acceptable concordance (0·38–0·46). The Bland and Altman plots comparing nutrients with Lin’s concordance values of ≥ 0·40 between paper-FFQ and 3DDR (online Supplementary Fig. S1(a)) showed no obvious bias pattern with mean differences close to zero for β-carotene intake; however, the differences for Ca intake appear to decrease with increasing intake. As expected, bias patterns began to show and the differences deviated further from zero for nutrients with Lin’s concordance values < 0·40 (plots not shown). The κ values showed fair to substantial agreement (0·25–0·61) between the paper-FFQ and 3DDR in classifying children according to tertiles of energy and nutrients intakes, except a poor agreement for polyunsaturated fat (0·20) (Table 3). Results from joint cross-classification analysis are in line, whereby ≥ 40 % of children were correctly classified into the same tertile, and ≤ 15 % of children were misclassified into extreme tertiles, except for polyunsaturated fat.
Table 3. Pearson’s correlation, Lin’s concordance, Cohen’s κ and cross-classification of tertiles between the paper-based FFQ and 3-d diet records in the Growing Up in Singapore Towards healthy Outcomes cohort
(95 % confidence intervals, n 92)

r, Pearson’s correlation coefficient; r c, Lin’s concordance coefficient; κ, Cohen’s κ coefficient.
* Based on log-transformed, energy-adjusted values.
Comparing average food groups intakes, the paper-FFQ significantly over-estimated majority of food groups, except for breads, and cruciferous and dark green vegetables (Table 1). The paper-FFQ had acceptable to good correlations (0·30–0·70) with 3DDR in estimating food groups intakes, but poor correlations (< 0·30) were observed for desserts and sweet snacks, fast food and fried snacks (Table 3). Poor concordance (< 0·30) was observed between paper-FFQ and 3DDR in estimating most food groups intakes, except for cruciferous and dark green vegetables, and milk which had good concordance (≥ 0·50). The Bland and Altman plots comparing food groups intakes with Lin’s concordance values of > 0·40 between paper-FFQ and 3DDR (online Supplementary Fig. S2(a)) showed no obvious bias pattern with mean differences close to zero for cruciferous and dark green vegetables. Comparing milk intake, however, the differences tended to increase with increasing amounts consumed. As expected, bias patterns began to show and the differences deviated further from zero for food groups with Lin’s concordance values < 0·40 (plots not shown). The κ values showed fair to substantial agreement (0·28–0·63) between the paper-FFQ and 3DDR in classifying children according to tertiles of food groups intakes (Table 3), but poor agreement (≤ 0·20) for noodles and pasta, desserts and sweet snacks as well as fast food and fried snacks. Joint cross-classification analysis yielded similar levels of tertile agreement.
Validation of web-FFQ against 3-d diet record
Overall, the median intakes from the web-FFQ were similar to the 3DDR except for Ca and β-carotene (Table 1). The web-FFQ demonstrated acceptable to good correlations (0·35–0·70) with 3DDR in estimating intakes of protein, fibre and micronutrients intakes, but poor correlations (< 0·30) in estimating intakes of energy, carbohydrate, total fat and specific types of fats (Table 4). Results from Lin’s concordance are in line with Pearson’s correlations. The Bland and Altman plots comparing β-carotene, Ca, fibre and Fe intakes between web-FFQ and 3DDR (Lin’s concordance ≥ 0·40) showed no particular bias pattern with the differences scattered randomly about the value of zero (online Supplementary Fig. S1(b)). Plots are not shown for nutrients with Lin’s concordance values < 0·40 as bias patterns with mean differences far from zero are expected. The κ values showed fair to substantial agreement (0·30–0·61) between web-FFQ and 3DDR in classifying children according to tertiles of energy and nutrients intakes, except a poor agreement (0·20) for carbohydrate (Table 4). Joint cross-classification analysis between web-FFQ and 3DDR showed ≥ 40 % of children correctly classified into the same tertile, and ≤ 15 % of children misclassified into extreme tertiles of energy and nutrients intakes, except for carbohydrate and saturated fat.
Table 4. Pearson’s correlation, Lin’s concordance, Cohen’s κ and cross-classification of tertiles between the web-based FFQ and 3-d diet records in the Growing Up in Singapore Towards healthy Outcomes cohort
(95 % confidence intervals, n 92)

r, Pearson’s correlation coefficient; r c, Lin’s concordance coefficient; κ, Cohen’s κ coefficient.
* Based on log-transformed, energy-adjusted values.
Comparing average food groups intakes, the web-FFQ significantly over-estimated other vegetables, fruits, fish and seafood, eggs, desserts and sweet snacks, fast food and fried snacks, while under-estimated poultry and meat (Table 1). The web-FFQ demonstrated acceptable to good correlations with 3DDR (0·31–0·76) in estimating food groups intakes, except for desserts and sweet snacks, fast food and fried snacks which had poor correlations (< 0·30) (Table 4). Acceptable to good concordance (0·32–0·72) between the web-FFQ and 3DDR was observed for seven of thirteen food groups intakes, while poor concordance (< 0·30) was observed for breads, fruits, poultry and meat, desserts and sweet snacks, fast food and fried snacks, and dairy products (excluding milk). The Bland and Altman plots comparing intakes of cruciferous and dark green vegetables, milk, noodles and pasta, fish and seafood (Lin’s concordance > 0·40) between the web-FFQ and 3DDR (online Supplementary Fig. S2(b)) suggest no bias pattern, and the differences were randomly scattered around zero. Plots are not shown for food groups with Lin’s concordance values < 0·40. The κ values showed fair to substantial agreement (0·28–0·63) between the web-FFQ and 3DDR in classifying children according to tertiles of food groups intakes (Table 4), but poor agreement (≤ 0·20) was observed for poultry and meat, desserts and sweet snacks, fast food and fried snacks. Joint cross-classification analysis yielded similar levels of tertile agreement.
Usability results
A total of eighty-nine mothers completed the usability questionnaire. Majority indicated that they preferred the web-FFQ over the paper-FFQ (81 %) and agreed that the web-FFQ was interesting and fun to complete (91 %), and user-friendly (89 %). Most of them also agreed that the images (95 %) and instructions (97 %) were clear (Fig. 3(a)). Only a small percentage of them (7 %) indicated that they were not confident in using a web-based tool (Fig. 3(b)). Some experienced long loading time (10 %) or encountered technical problems (14 %) while completing the web-FFQ, while 12–13 % did not find the portion images helpful or did not like the layout of the web-FFQ.
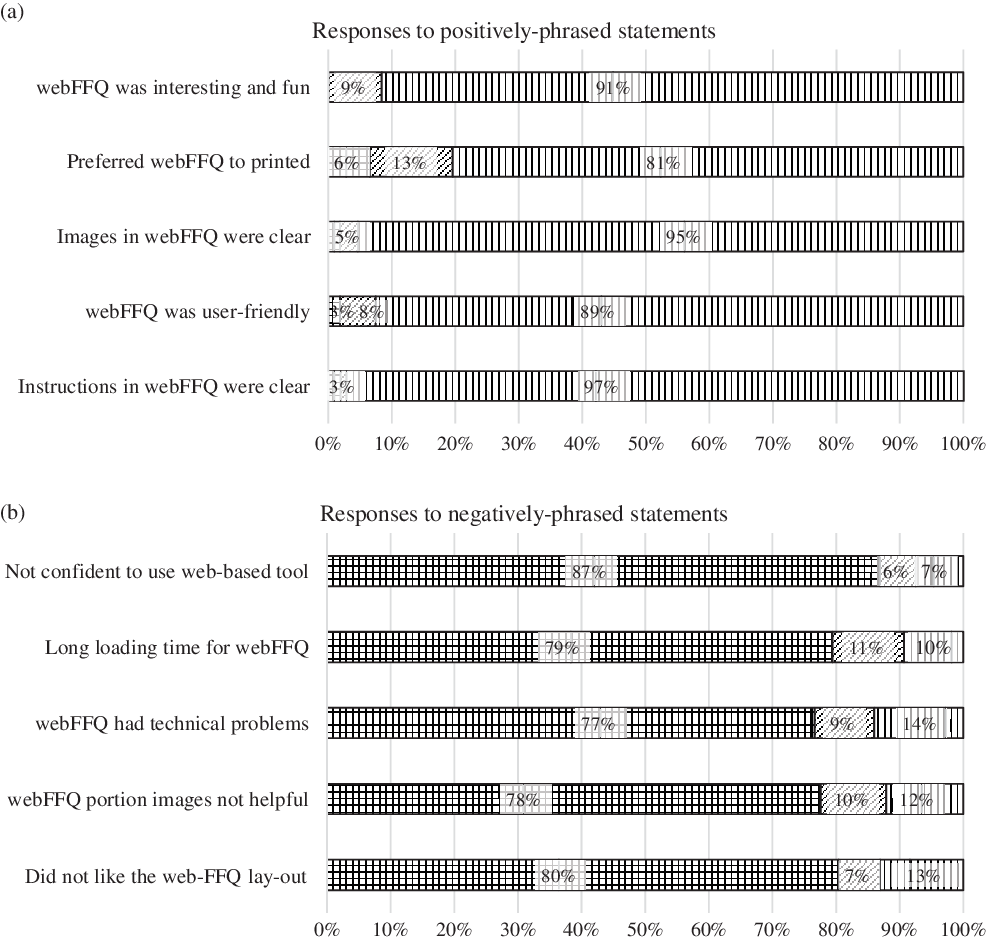
Fig. 3. Percentages of participants (n 89) agreeing or disagreeing to positively phrased (a) and negatively phrased (b) usability questionnaire statements for web-FFQ. ![]() , disagree;
, disagree; ![]() , neutral;
, neutral; ![]() , agree.
, agree.
Discussion
Overall, our study results suggest that the paper- and web-FFQ produce comparable estimates; the web-FFQ had acceptable to good agreement while the paper-FFQ had poor agreement, with 3DDR when evaluating dietary variables in a continuous scale. Both FFQ had acceptable to good tertile agreement with the 3DDR. Additionally, majority of the participants responded positively to the web-FFQ and preferred to complete the web-FFQ over the paper-FFQ.
Overall, nutrients intakes estimated from both paper- and web-FFQ were comparable in several aspects. The correlation coefficients (0·51–0·75) in our study were similar to those (0·35–0·84) reported in previous studies examining comparability of paper v. web-FFQ self-administered by adults(Reference Al-Shaar, Yuan and Rosner29–Reference Lo Siou, Csizmadi and Boucher32), although these FFQ assessed dietary intakes of adults and not young children. Results from categorical agreement (κ and cross-classification analyses) were also in line. While our percentages of classification into the same category (43–71 %) were slightly lower than a previous study (45–86 %)(Reference Forster, Fallaize and Gallagher31), we classified according to tertiles instead of quartiles. Our study additionally showed that both FFQ were in agreement for assessing absolute nutrient intakes except for carbohydrate, protein and total fat. Likewise, food groups intakes were also comparable between both FFQ. The correlation coefficients (0·47–0·87) and percentages of classification into the same category (49–72 %) were similar to previous studies(Reference Apovian, Murphy and Cullum-Dugan30,Reference Forster, Fallaize and Gallagher31) (0·29–0·79 and 35–73 %, respectively), except for dairy products (excluding milk). We suspect that collapsing FFQ items with large daily variation in intakes (e.g. malt beverages intake: 0–625 ml by web-FFQ and 0–1563 ml by paper-FFQ) with intakes of items with smaller daily variation (e.g. dairy-based drinks intake: 0–54 ml by web-FFQ and 0–625 ml by paper-FFQ) may have skewed the distributions of dairy products (excluding milk) and affected the comparison results.
In general, when compared with 3DDR as the reference method, the relative validity of the paper-FFQ in examining absolute energy and nutrients intakes is considered weak. Although the overall correlation coefficients (0·31–0·70) are comparable (except for fats) to those reported in a recent meta-analysis of studies examining relative validity of caregiver- or child-administered paper-FFQ (0·35–0·56)(Reference Saravia, Miguel-Berges and Iglesia6), results from Lin’s concordance and Bland–Altman plots suggest an overall poor agreement when examining absolute intakes. This finding concurred with previous studies assessing validity of FFQ in children that FFQ generally have poorer level of agreement in absolute intakes(Reference Tabacchi, Filippi and Breda33–Reference Vereecken, Covents and Maes36). Nevertheless, the ability of the paper-FFQ to classify children according to categories of energy and nutrients intakes is mostly acceptable to good (except polyunsaturated fat). Our percentages of classifications were somewhat similar to previous studies considering the differences in number of categories (5–14 % misclassified into extreme tertiles in our study v. 0–15 % misclassified into extreme quartiles/quintiles in previous studies(Reference Marcinkevage, Mayén and Zuleta35,Reference Rodriguez, Smith and Villamor37–Reference Scagliusi, Garcia and Indiani39) ). Very few studies have calculated Cohen’s κ statistics for adequate comparison. The relative validity of the paper-FFQ against 3DDR in assessing food groups intakes follows a similar pattern to energy and nutrients intakes. The paper-FFQ were adequately robust in classifying children according to food groups intakes except for noodles and pasta, desserts and sweet snacks, fast food and fried snacks, but the overall relative validity in estimation of absolute food groups intakes is weak despite similar correlation coefficients (0·22–0·70) to previous studies (0·07–0·76(Reference Vereecken, Covents and Maes36,Reference Lillegaard, Øverby and Andersen40,Reference Saeedi, Skeaff and Wong41) ).
The relative validity of the web-FFQ against the 3DDR in examining absolute intakes of protein, fibre and micronutrients is acceptable to good but for energy, carbohydrate and fats is weak. Our correlation coefficients (0·19–0·67) were within the ranges (0·12–0·98) reported in previous studies examining relative validity of a web-FFQ self-administered by adults or children/adolescents(Reference Labonte, Cyr and Baril-Gravel15,Reference Tabacchi, Filippi and Breda33,Reference Deierlein, Bihuniak and Nagi42–Reference Christensen, Moller and Bonn45) . In line with previous studies(Reference Tabacchi, Filippi and Breda33,Reference Verger, Armstrong and Nielsen44,Reference Christensen, Moller and Bonn45) , there was a generally poor agreement in absolute intakes between the web-FFQ and the reference method judging from Lin’s concordance and Bland–Altman plots; however, it was encouraging to observe acceptable to good agreement for micronutrients. In contrast, the web-FFQ was able to classify children according to categories of energy and nutrients intakes with acceptable to good agreement (except carbohydrate). Our κ values (0·20–0·61) were within the range reported in previous studies (–0·07–0·39(Reference Tabacchi, Filippi and Breda33,Reference Bjerregaard, Halldorsson and Kampmann43) ), and percentages of classification (36–58 % same tertile) are comparable to one study which calculated tertile agreement (38–51 % same tertile)(Reference Verger, Armstrong and Nielsen44). Our correlation coefficients for food groups (0·19–0·67) were similar to previous studies (0·03–0·88(Reference Tabacchi, Filippi and Breda33,Reference Deierlein, Bihuniak and Nagi42–Reference Verger, Armstrong and Nielsen44,Reference Alawadhi, Fallaize and Franco46,Reference Fallaize, Forster and Macready47) ). There were acceptable to good agreement between web-FFQ and 3DDR in estimating absolute intakes of several food groups. Likewise, the web-FFQ were adequately robust in classifying children according to most food groups intakes except for poultry and meat, desserts and sweet snacks, fast food and fried snacks, and our κ values (0·12–0·63) were comparable to previous studies (0·04–0·51(Reference Tabacchi, Filippi and Breda33,Reference Bjerregaard, Halldorsson and Kampmann43) ). None of these studies has performed cross-classifications into tertiles to allow direct comparison. The inclusion of portion size photographs for all food items in the web-FFQ likely improved the estimation of amounts consumed, which is in line with a previous review showing image-assisted dietary assessment to produce closer estimates to the reference method(Reference Boushey, Spoden and Zhu48).
Taken together, we observed that both FFQ had poor relative validity with 3DDR in estimating macronutrients intakes especially carbohydrate and fats. This finding reminisce several FFQ validation studies in Asian populations reporting poorer relative validity for macronutrients, which the authors speculate to be due to a much greater variation in foods/snacks which are high in carbohydrate and fat(Reference Whitton, Ho and Tay49,Reference Noor Hafizah, Ang and Yap50) . Furthermore, both FFQ had poor relative validity with 3DDR in estimating intakes of desserts and sweet snacks, fast food and fried snacks. As compared with diet records over a few days, the habitual consumption of less frequently consumed foods may have been more accurately captured by FFQ which assesses consumption over the past month(Reference Willett3). Thus, it is questionable whether 3DDR is a good reference method for validation of foods not commonly consumed on a daily basis such as desserts and sweet snacks, fast food and fried snacks intakes(Reference Labonte, Cyr and Baril-Gravel15).
Although our results suggest both paper- and web-FFQ to have similar relative validity when compared with a 3DDR as the reference method, the overall positive acceptance of web-FFQ, as reflected by responses in the usability questionnaire, suggests that the web-FFQ is a feasible tool for future dietary data collection. Additionally, the web-FFQ addressed several limitations of the paper-FFQ: (1) more accurate estimation of food intakes with the help of portion size photographs evidenced by having similar median intakes and better concordance with 3DDR, (2) shorter time spent in completing the web-FFQ and (3) absence of missing responses (with the exception of data loss due to technical issues). Furthermore, direct capture of data by the web system eliminates the need for data entry unlike the paper-FFQ.
The strength of this study includes counterbalancing the sequence of completing the dietary assessments, thus reducing the bias due to repeated administrations. Several limitations were noted that could affect the validation results. The use of a 3DDR as a reference method in our validation study makes interpretation of results challenging, as diet records are also subjected to self-reporting bias and only capture foods consumed over a few days thus not representative of foods consumed in a whole month(Reference Kirkpatrick, Baranowski and Subar51). Nonetheless, results from this study can be useful to guide choosing of most appropriate way to examine dietary intakes estimated using either FFQ (e.g. examining intakes as categorical variables, and focusing on micronutrients and certain food groups that have consistently shown acceptable-good relative validity). There may be fatigue in completing three dietary assessments within a span of 2 months thus affecting reporting accuracy. Another issue unique to children of this age group is the large variability in knowledge or information the mother has on foods that are eaten outside of their supervision such as when the child is in school.
In conclusion, our study demonstrates that the paper- and web-FFQ produce comparable estimates of dietary intakes, indicating that data collected from both FFQ can be combined. Both FFQ were relatively valid compared with a 3DDR in classifying children according to intakes of energy, nutrients and most food groups. Additional refinements and calibrations are needed in order to investigate absolute intakes estimated using both FFQ, although the web-FFQ demonstrated acceptable to good relative validity against 3DDR in assessing absolute intakes of micronutrients and several food groups. Nevertheless, the ability of our FFQ to accurately classify according to categories of intakes may be more conceptually important to examine in nutrition epidemiology rather than the absolute intakes. In addition, the web-FFQ has added advantages in terms of being more usable and preferred, shorter completion time, few missing responses and less labour intensive; thus, the web-FFQ is a feasible tool in replacement of the paper-FFQ to assess dietary intakes of GUSTO children.
Acknowledgements
We would like to acknowledge the contribution of the GUSTO study group: Airu Chia, Allan Sheppard, Amutha Chinnadurai, Anna Magdalena Fogel, Anne Eng Neo Goh, Anne Hin Yee Chu, Anne Rifkin-Graboi, Anqi Qiu, Arijit Biswas, Bee Wah Lee, Birit Froukje Philipp Broekman, Bobby Kyungbeom Cheon, Boon Long Quah, Candida Vaz, Chai Kiat Chng, Cheryl Shufen Ngo, Choon Looi Bong, Christiani Jeyakumar Henry, Ciaran Gerard Forde, Claudia Chi, Daniel Yam Thiam Goh, Dawn Xin Ping Koh, Desiree Y. Phua, Doris Ngiuk Lan Loh, E Shyong Tai, Elaine Kwang Hsia Tham, Elaine Phaik Ling Quah, Elizabeth Huiwen Tham, Evelyn Chung Ning Law, Evelyn Xiu Ling Loo, Faidon Magkos, Falk Müller-Riemenschneider, George Seow Heong Yeo, Hannah Ee Juen Yong, Helen Yu Chen, Heng Hao Tan, Hong Pan, Hugo P S van Bever, Hui Min Tan, Iliana Magiati, Inez Bik Yun Wong, Ives Yubin Lim, Ivy Yee-Man Lau, Izzuddin Bin Mohd Aris, Jeannie Tay, Jeevesh Kapur, Jenny L. Richmond, Jerry Kok Yen Chan, Jia Xu, Joanna Dawn Holbrook, Joanne Su-Yin Yoong, Joao Nuno Andrade Requicha Ferreira, Johan Gunnar Eriksson, Jonathan Tze Liang Choo, Jonathan Y. Bernard, Jonathan Yinhao Huang, Joshua J. Gooley, Karen Mei Ling Tan, Kenneth Yung Chiang Kwek, Keri McCrickerd, Kothandaraman Narasimhan, Krishnamoorthy Naiduvaje, Kuan Jin Lee, Leher Singh, Li Chen, Lieng Hsi Ling, Lin Lin Su, Ling-Wei Chen, Lourdes Mary Daniel, Lynette Pei-Chi Shek, Marielle V. Fortier, Mark Hanson, Mary Rauff, Mei Chien Chua, Melvin Khee-Shing Leow, Michael J. Meaney, Michelle Zhi Ling Kee, Min Gong, Mya Thway Tint, Navin Michael, Neerja Karnani, Ngee Lek, Oon Hoe Teoh, P. C. Wong, Paulin Tay Straughan, Peter David Gluckman, Pratibha Keshav Agarwal, Priti Mishra, Queenie Ling Jun Li, Rob Martinus van Dam, Salome A. Rebello, Sambasivam Sendhil Velan, Seang Mei Saw, See Ling Loy, Seng Bin Ang, Shang Chee Chong, Sharon Ng, Shiao-Yng Chan, Shirong Cai, Shu-E Soh, Sok Bee Lim, Stella Tsotsi, Stephen Chin-Ying Hsu, Sue-Anne Ee Shiow Toh, Suresh Anand Sadananthan, Swee Chye Quek, Varsha Gupta, Victor Samuel Rajadurai, Walter Stunkel, Wayne Cutfield, Wee Meng Han, Wei Wei Pang, Wen Lun Yuan, Yanan Zhu, Yin Bun Cheung, Yiong Huak Chan, Yung Seng Lee.
The GUSTO study is supported by the Singapore National Research Foundation under its Translational and Clinical Research (TCR) Flagship Programme and administered by the Singapore Ministry of Health’s National Medical Research Council (NMRC), Singapore (NMRC/TCR/004-NUS/2008; NMRC/TCR/012-NUHS/2014). Additional funding is provided by the Singapore Institute for Clinical Sciences, Agency for Science Technology and Research (A*STAR). K. M. G. is supported by the National Institute for Health Research (NIHR) through the NIHR Southampton Biomedical Research Centre and by the European Union’s Seventh Framework Programme (FP7/2007–2013), project EarlyNutrition under grant agreement n°289346. The funding bodies had no influence on the study design, data collection, analysis, interpretation and content of the manuscript.
J. S. L. and M. F-F. C. designed the research. J. S. L. and J. L. performed statistical analysis and wrote the manuscript. M. F.-F. C. reviewed and edited the manuscript. J. S. L. and M. F.-F. C. had primary responsibility for final content. J. Y. T. and M. C. contributed to the development of dietary assessments, data collection and cleaning. R. S. contributed to statistical analysis and data interpretation. K. H. T., F. K. P. Y., Y.-S. C. and K. M. G. led the GUSTO study. All authors critically reviewed the manuscript for scientific content, read and approved the final manuscript; agreed to be accountable for all aspects of the work.
F. K. P. Y., K. M. G. and Y-S. C. have received reimbursement for speaking at conferences sponsored by companies selling nutritional products. K. M. G. and Y-S. C. are part of an academic consortium that has received research funding from Abbott Nutrition, Nestlé and Danone. All other authors declared no conflicts of interest.
Supplementary material
For supplementary material referred to in this article, please visit https://doi.org/10.1017/S0007114521004517


