


Low- and middle-income countries are undergoing a rising prevalence of weight excess (WE), although a large prevalence of undernutrition is still present(Reference Ford, Patel and Narayan1). Together, WE or undernutrition affects almost 2·5 billion people worldwide(2).
The co-existence of undernutrition and WE is defined as the double burden of malnutrition (DBM) and occurs either in the same individual, within a family or in a population(3). The DBM has been reported in Latin America(Reference Pomeroy, Stock and Stanojevic4–Reference Caleyachetty, Thomas and Kengne6), Eastern Europe(Reference Doak, Adair and Bentley7), Southeast Asia(Reference Ramachandran8,Reference Khan and Khoi9) and Africa(Reference Zeba, Delisle and Renier10,Reference Jones, Acharya and Galway11) , especially sub-Saharan Africa(Reference Popkin, Corvalan and Grummerstrawn12). In Brazil, a prevalence of 0·3 % DBM was found, especially among adolescents older than 14 years(Reference Uzêda, Ribeiro-Silva and Silva13).
It is well known that undernutrition or WE is accompanied by profound endocrine changes. For example, undernutrition is associated with a decrease in insulin(Reference Martins and Sawaya14), leptin and thyroid hormone concentrations(Reference Martins, Neves and Franco15,Reference Nijjar and Stafford16) . It is believed that the decrease in these hormones aims to reduce energy expenditure. In contrast, WE increases insulin(Reference Romualdo, Nóbrega and Escrivão17), leptin(Reference Gruzdeva, Borodkina and Uchasova18) and thyroid hormones(Reference Martins, Filgueiras and Almeida19). Some authors have suggested that the increase in leptin and thyroid hormones could counteract the excess energy stored and facilitate increased expenditure(Reference Reinehr20,Reference Fontenelle, Feitosa and Severo21) .
Profound metabolic consequences as a result of these endocrine changes are well known. For example, increases in glucose(Reference Frithioff-Bøjsøe, Lund and Kloppenborg22) and TAG(Reference Nogueira-de-Almeida and Mello23) have been described in obese children. In contrast, the glucose concentration may be normal in stunted children(Reference Martins and Sawaya14) but is decreased among more severe cases of undernutrition(Reference Bhutta, Berkley and Bandsma24). Increased insulin sensitivity occurs in this condition(Reference Martins and Sawaya14). A new way to analyse alterations in glucose and TAG called the metabolic load index (MLI) has recently been proposed(Reference Emerson, Haub and Teeman25). This index is a way to express the metabolic challenge faced by cells, as it is known that high metabolic loads can predispose cells to diseases(Reference Emerson, Haub and Teeman25).
There is increasing evidence that the consumption of hyperpalatable foods is associated with symptoms of food addiction(Reference Gearhardt, Grilo and Dileone26,Reference De Macedo, De Freitas and Da Silva Torres27) . One study indicated that adults with a positive score for food addiction have more difficulties losing weight and maintaining health status(Reference Burmeister, Hinman and Koball28), representing an additional risk for the development of CVD and metabolic diseases. In addition, the presence of food addiction and its symptoms demand new methodologies and specific treatments for nutritional disorders. One study found a prevalence of food addiction of 2·6 % overall among Dutch adolescents (14–21 years), but the prevalence doubled (5·9 %) among those with WE(Reference Mies, Treur and Larsen29). A much higher prevalence was found among Brazilian children. A recent study from our research group found a prevalence of food addiction of 24 % among Brazilian children with WE (9–11 years old)(Reference Filgueiras, Pires de Almeida and Koch Nogueira30).
To our knowledge, studies of DBM that analysed stunting plus WE in the same child or adolescent and its association with food addiction are non-existent. This is important to provide subsidies for the prevention and treatment of this condition, as it aggravates their disease condition. With this aim, we investigated in children and adolescents the presence of food addiction, thyroid status, leptin, insulin, glucose and lipid profiles, as well as body composition and the MLI in DBM and compared them with eutrophic controls and those with WE and without stunting.
Materials and methods
Study design and population
A cross-sectional study was conducted with children and adolescents from 7 to 16 years of age, both sexes, from eight public schools located in a low-income area of João Pessoa city (Brazil). In these schools, anthropometric evaluations were performed on 2966 students. The subjects included in the study were divided as follows: (1) control group (C), height-for-age Z score (HAZ) > 0·0 and < 2·0 and BMI for age (BMI/A) > −1·0 and < 0·5 Z score; (2) WE group, HAZ > 0·0 and < 2·0 Z score and BMI/A > 1·0 Z score; and (3) DBM group (mild stunting plus WE in the same child/adolescent), HAZ < −1·0 Z score and BMI/A > 1·0 Z score, matched for age and sex. All students who met the DBM criteria (n 48) were invited to participate; however, nineteen did not agree, and seven were excluded due to autoimmune or neurological diseases. None of the participants in the present study had CVD, renal or endocrine diseases.
The present study was approved by the Research Ethics Committee of the Federal University of Paraíba (CAAE 97686018.0.0000.5188), and all procedures were conducted following the Helsinki Declaration. All parents and participants signed consent to participate in the research.
Anthropometric assessment
The students were weighed on a digital scale platform (Wiso – W721) with a capacity of 180 kg and a precision of 100 g. Height was measured using a stadiometer (Alturaexata) with a precision of 1 mm. All anthropometric measurements were obtained using the method described by Lohman et al. (Reference Lohman, Roche and Martorell31). Nutritional status was calculated using WHO AnthroPlus software (v1.0.4 WHO).
Waist circumference and hip circumference were evaluated with the individual standing, with the abdomen relaxed and arms relaxed at the side of the body, using an inelastic measuring tape with a precision of 1 mm. The waist-to-hip ratio was assessed by the simple division of waist circumference by hip circumference in centimetres, and the waist-to-height ratio (WHtR) was also assessed by the division of waist circumference by height.
Body composition
Triceps and subscapular skinfolds were measured by an adipometer (Sanny – AD1009), and the body fat percentage was calculated according to Slaughter et al. (Reference Slaughter, Lohman and Boileau32). The measurements were obtained in duplicate, always on the left side of the body, by the same evaluator in all children and adolescents.
Biochemical analysis
Blood samples were obtained after an overnight fast of 12 h and centrifuged at 3000 rpm for 15 min. The serum was stored at −80°C for further analysis. Total cholesterol, HDL, LDL, TAG and glucose were analysed by the enzymatic colorimetric method in an automated analyser (Chem Well T – Labtest) following the manufacturer’s recommendations (Bioclin, Belo Horizonte).
Insulin, thyroid-stimulating hormone, free T3 and free T4 were measured by the chemiluminescence method, and leptin was measured by ELISA according to the protocol recommended by the manufacturer. The MLI was calculated as the sum of TAG and glucose (both in mg/dl) to quantify the metabolic state(Reference Emerson, Haub and Teeman25). This index is associated with the metabolic challenge during fasting or after a meal due to the adjustments necessary to the maintenance of energetic homoeostasis. The homeostasis model assessment of insulin resistance (HOMA-IR) was employed to analyse insulin resistance according to Matthews et al. (Reference Matthews, Hosker and Rudenski33).
Assessment of food addiction and socio-economic status
The Yale Food Addiction Scale for Children (YFAS-C) was developed by Gearhardt et al. (Reference Gearhardt, Roberto and Seamans34) to investigate food addiction in children using a questionnaire with twenty-five items grouped in accordance with seven symptoms: tolerance; withdrawal; taking the substance often in larger amounts or over a longer period than was intended; persistent desire or unsuccessful effort to cut down or control substance use; spending a great deal of time in activities necessary to obtain or use the substance or to recover from its effects; giving up social, occupational or recreational activities because of substance use; and continuing the substance use with the knowledge that it is causing or exacerbating a persistent or recurrent physical or psychological problem. To be classified as food addiction, clinical distress and three or more symptoms are necessary(Reference Gearhardt, Roberto and Seamans34). The YFAS-C, validated in Brazilian children and adolescents(Reference Filgueiras, Sesso and Almeida35), was applied to identify the presence of food addiction in the participants of the present study. YFAS-C is categorised into specific symptoms that resemble substance dependence. The participants’ mother/father answered a questionnaire about family socio-economic status and the health of children/adolescents.
Statistical analysis
The variables were assessed for normality using the Shapiro–Wilk test. Variables without a normal distribution were log-transformed when applicable, and geometric means are shown. Anthropometric, socio-economic, biochemical, and hormone data and the mean of the symptoms of food addiction were analysed by two-way ANOVA, by group and sex, and Bonferroni adjustment was used for multiple comparisons. ANCOVA correcting for sex and weight was used for body composition data. The χ 2 test was used to analyse food addiction. Hormones, anthropometric data and food addiction were analysed using Pearson’s correlation or Spearman’s analysis. The level of significance adopted was 5 % (α < 0·05). For statistical analysis, SPSS software (IBM version 20.0) was used.
For the sample size calculation (Epi Info software version 7.2.3.0), the prevalence of 0·3 % (n 37; 95 % CI 0·23, 0·45) of participants presenting the DBM was used, along with 27·3 % of controls being exposed (fourteen), paired at a 1:2 ratio between cases and controls, a power of 80 % and a CI of 95 %, resulting in sixty participants being required and divided into the three groups. To predict losses and to avoid possible confounding factors, 25 % was added to this number, resulting in a total of seventy-three being divided into the groups.
Results
Table 1 summarises the socio-economic and anthropometric characteristics of the participants. No differences between groups were found in the years of schooling of the legal guardian, the number of people at the residence or the family income. The mean ages were similar among groups. The WE group showed a higher weight than the DBM and C groups. Height and HAZ were significantly lower in the DBM group than in the other two groups, while BMI/A and waist circumference were significantly higher in the DBM and WE groups. The waist-to-hip ratio was significantly higher in DBM than in C subjects. WE subjects showed a higher WHtR than DBM and C subjects, while DBM individuals had a higher WHtR than C subjects. The WHtR of the boys in the C group was higher than that of the girls, but the girls in the DBM and WE groups had a higher WHtR than the boys (interaction, P = 0·045).
Table 1. Socio-economic and anthropometric characteristics of the studied groups
(Median values and minimum–maximum values; mean values and standard deviations)

DBM, double burden of malnutrition; HAZ, height-for-age; BMI/A, BMI for age; WC, waist circumference; WHR, waist-to-hip ratio; WHtR, waist-to-height ratio.
* Kruskal–Wallis or two-way ANOVA (group and sex). Age: (group (F(2,67) = 0·376), sex (F(1,67) = 2·181), interaction factor (F(2,67) = 0·608); P = 0·547); weight: (group (F(2,67) = 11·631), sex (F(1,67) = 1·712), interaction factor (F(2,67) = 0·618); P = 0·542); height: (group (F(2,67) = 14·034), sex (F(1,67) = 0·247), interaction factor (F(2,67) = 0·334); P = 0·717); HAZ: (group (F(2,67) = 123·481), sex (F(1,67) = 2·058), interaction factor (F(2,67) = 0·585); P = 0·560); BMI/A: (group (F(2,67) = 121·171), sex (F(1,67) = 0·048), interaction factor (F(2,67) = 0·302); P = 0·741); WC: (group (F(2,67) = 21·202), sex (F(1,67) = 0·031), interaction factor (F(2,67) = 0·714); P = 0·493); WHR: (group (F(2,67) = 4·347), sex (F(1,67) = 14·960), interaction factor (F(2,67) = 1·488); P = 0·233); WHtR: (group (F(2,67) = 73·962), sex (F(1,67) = 1·659), interaction factor (F(2,67) = 3·257); P = 0·045).
† Mean value was significantly different from the control group (Bonferroni’s post-test).
‡ Mean value was significantly different from the weight excess group (Bonferroni’s post-test).
Table 2 shows the distribution of positive symptom scores and food addiction diagnoses. The DBM group showed a higher percentage of the symptom ‘persistent desire or repeated unsuccessful attempt to quit’ than the other two groups. The WE and DBM groups showed a higher percentage of the symptom ‘continued use despite knowledge of adverse consequences’ and ‘withdrawal’ than the C children. In addition, these two groups showed a tendency (χ 2 test, P = 0·05) of a higher percentage of ‘clinical distress’ symptoms than the C group. There was no significant difference between the groups in the percentage of food addiction as a final diagnosis. The WE and DBM groups showed a higher mean of symptoms of food addiction than the controls.
Table 2. Symptom scores, food addiction diagnoses and total numbers of symptoms in the studied groups
(Numbers and percentages; mean values and 95 % confidence intervals)

DBM, double burden of malnutrition.
* χ 2 test or two-way ANOVA (group and sex). Total symptoms of food addiction: (group (F(2,67) = 6·394), sex (F(1,67) = 0·913); P = 0·343, interaction factor (F(2,67) = 0·434); P = 0·649).
† Participants who scored positively for the symptom (%).
‡ Yale Food Addiction Scale for Children food addiction diagnosis: the presence of three or more symptoms and clinical impairment or distress.
§ Mean value was significantly different from the control group (Bonferroni’s post-test).
DBM and WE subjects showed a higher fat mass, expressed as either absolute or percentage values, and lower fat-free mass compared with those in the C group (Table 3). No differences in fat mass were found between the WE and DBM groups.
Table 3. Body composition of the studied groups
(Mean values and 95 % confidence intervals)
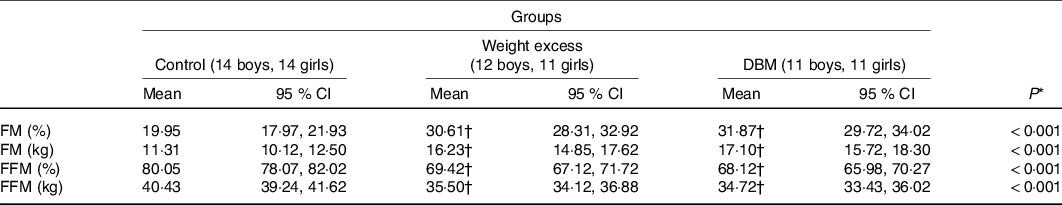
DBM, double burden of malnutrition; FM, fat mass; FFM, fat-free mass.
* ANCOVA corrected for sex and weight.
† Mean value was significantly different compared with the control group (Bonferroni’s post-test).
Total cholesterol, insulin, leptin and HOMA-IR of the DBM and WE groups were significantly higher than those of the C group (Table 4). The WE group had a higher LDL concentration than the C group, and DBM showed a higher glucose concentration than the WE group. The DBM group showed a higher concentration of TAG but without a difference in the post hoc Bonferroni test. The MLI was higher in the DBM group than in the C group. No differences were found for thyroid-stimulating hormone, free T3 or free T4 between groups. Boys showed higher mean free T3 levels than girls (5·51 (95 % CI 5·26, 5·78) and 4·99 (95 % CI 4·76, 5·24) pmol/l, respectively), and girls had a higher concentration of leptin than boys (21·71 (95 % CI 16·11, 29·27) and 7·57 (95 % CI 5·68, 10·09) ng/dl, respectively). No interactions between group and sex were found.
Table 4. Metabolic and hormonal profiles of the studied groups
(Mean values and standard deviations; geometric means and 95 % confidence intervals)
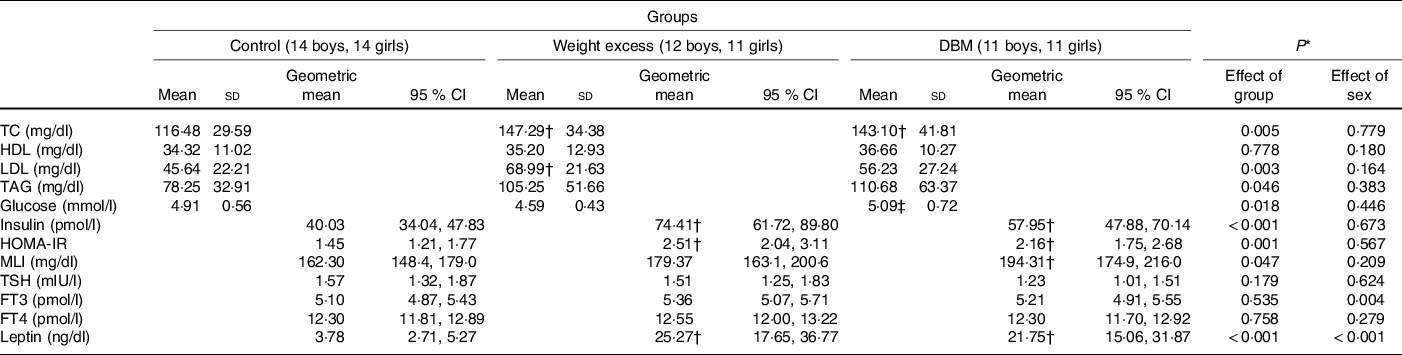
DBM, double burden of malnutrition;TC, total cholesterol; HOMA-IR, homoeostasis model assessment of insulin resistance; MLI, metabolic load index; TSH, thyroid-stimulating hormone; FT3, free triiodothyronine; FT4, free thyroxine.
* Two-way ANOVA (group and sex). Total cholesterol: (group (F(2,67) = 5·671), sex (F(1,67) = 0·080), interaction factor (F(2,67) = 0·481); P = 0·620); HDL: (group (F(2,67) = 0·252), sex (F(1,67) = 1·834), interaction factor (F(2,67) = 0·043); P = 0·958); LDL: (group (F(2,67) = 6·190), sex (F(1,67) = 1·978), interaction factor (F(2,67) = 0·853); P = 0·431); TAD: (group (F(2,67) = 3·213), sex (F(1,67) = 0·772), interaction factor (F(2,67) = 1·275); P = 0·286); glucose: (group (F(2,67) = 4·289), sex (F(1,67) = 0·588), interaction factor (F(2,67) = 0·224); P = 0·800); insulin: (group (F(2,67) = 11·992), sex (F(1,67) = 0·180), interaction factor (F(2,67) = 0·224); P = 0·800); HOMA-IR: (group (F(2,67) = 8·055), sex (F(1,67) = 0·331), interaction factor (F(2,67) = 0·159) P = 0·854); MLI: (group (F(2,67) = 3·211), sex (F(1,67) = 1·611), interaction factor (F(2,67) = 0·968) P = 0·385); TSH: (group (F(2,66) = 1·768), sex (F(1,66) = 0·242), interaction factor (F(2,66) = 1·397); P = 0·255); FT3: (group (F(2,67) = 0·630), sex (F(1,67) = 8·663), interaction factor (F(2,67) = 0·848); P = 0·433); FT4: (group (F(2,67) = 0·278), sex (F(1,67) =1·190), interaction factor (F(2,67) = 0·263); P = 0·770); leptin: (group (F(2,67) = 37·408), sex (1,67) = 25·765), interaction factor (F(2,67) = 0·442); P = 0·645).
† Mean value was significantly different from the control group (Bonferroni’s post-test).
‡ Mean value was significantly different from the weight excess group (Bonferroni’s post-test).
Table 5 shows the correlations between anthropometric/biochemical variables and food addiction symptoms. Apart from two symptoms (‘substance taken in larger amount and for longer period than intended’ and ‘tolerance’), all other symptoms showed positive correlations with body fat and BMI/A. Specifically, positive correlations were found between the symptoms 2 – ‘persistent desire or repeated unsuccessful attempt to quit’, 5 – ‘continued use despite knowledge of adverse consequences’ and 7 – ‘characteristic withdrawal symptoms and substance taken to relieve withdrawal’ and BMI/A, WHtR, % of fat mass and leptin. Symptom 3 – ‘Much time/activity to obtain, use, or recover’ was negatively correlated with age but positively correlated with BMI/A, percentage of fat mass and leptin. Symptom 7 – ‘characteristic withdrawal symptoms and substance taken to relieve withdrawal’ was the most correlated symptom, as it was positively correlated with all anthropometric variables studied, total cholesterol, LDL and leptin. There was no correlation between the MLI and the symptoms of food addiction.
Table 5. Correlation of anthropometric characteristics, metabolic factors, leptin concentration and symptoms of food addiction
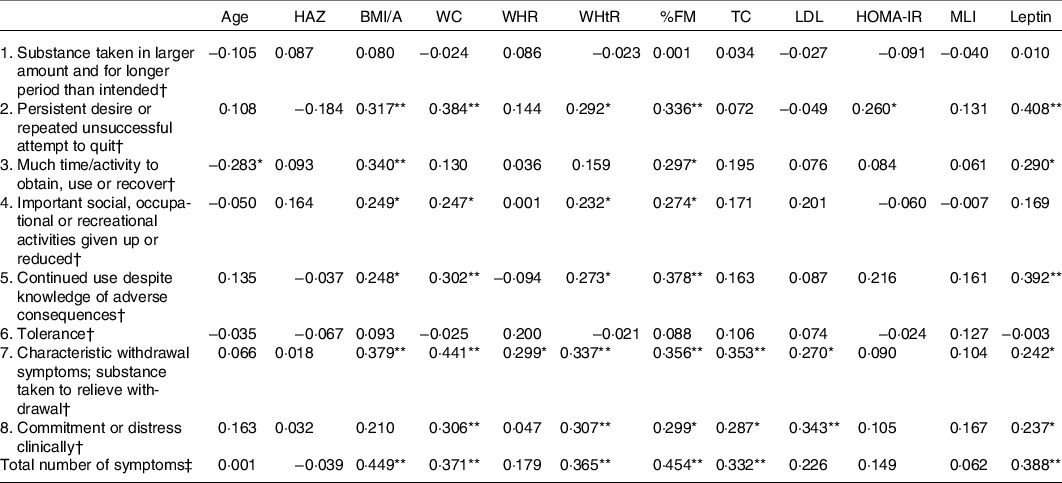
HAZ, height-for-age; BMI/A, BMI for age; WC, waist circumference; WHR, waist-to-hip ratio; WHtR, waist-to-height ratio; %FM, percentage of fat mass; TC, total cholesterol; HOMA-IR, homoeostasis model assessment of insulin resistance; MLI, metabolic load index.
* P < 0·05
** P < 0·01 (two-tailed).
† Spearman’s correlation.
‡ Pearson’s correlation.
Discussion
The presence of food addiction in children and adolescents is being increasingly recognised, especially among individuals with WE(Reference Filgueiras, Pires de Almeida and Koch Nogueira30,Reference Burrows, Kay-Lambkin and Pursey36) . This condition may aggravate the deleterious effects of the disease while further hindering treatment and preventing WE.
It is possible that the DBM represents an even more complex situation due to the metabolic changes that have been described in chronic undernutrition during growth and stunting(Reference Martins, Toledo Florêncio and Grillo37). In fact, a study from our research group investigated the ability of stunted children to control food intake and appetite at lunch when snacks were offered in the mid-morning(Reference Hoffman, Sawaya and Verreschi38). The results showed impaired control of food intake among stunted children, as the daily energy intake per body weight was higher in stunted children than in controls, signalling that these children tended to overeat when food was available. In addition, these findings suggested that this behaviour could be associated with the higher susceptibility to weight gain found among stunted children(Reference Florêncio, Ferreira and de França39,Reference Martins, Hoffman and Fernandes40) .
The previous results that stunted children tend to overeat opportunistically(Reference Hoffman, Sawaya and Verreschi38) can help to explain the findings of the present study. In particular, the symptom of ‘persistent desire or repeated unsuccessful attempt to quit’ was more prevalent among DBM children and adolescents than in the other two groups. This symptom, in fact, was found in almost 50 % of the subjects with DBM.
Another important finding of the present study was that the correlation data provide evidence that BMI/A, body fat and leptin are positively correlated with many food addiction symptoms. Specifically, the great majority (5–6 out of 8) of the symptoms were positively correlated with BMI/A, abdominal fat mass, % fat mass and leptin. The total number of symptoms of food addiction was also positively correlated with the BMI/A and leptin concentrations.
Another important finding was that there was a higher metabolic challenge in DBM children and adolescents than in controls. This implies an availability of energetic substrates for tissues and an additional demand for physiological systems for proper control. The maintenance of high glucose over time can increase the allostatic load and predispose individuals to the development of type 2 diabetes(Reference Stumvoll, Tataranni and Stefan41).
Serum glucose was higher in DBM children and adolescents than in those with WE. It has been described that undernourished children show alterations in glucose and insulin metabolism, with an increase in insulin sensitivity and lower insulin production among stunted individuals(Reference Martins and Sawaya14), but as these children gain body weight (HAZ Z scores ≥−2 and <−1 and BMI/A > 85 P), there is an increase in insulin resistance(Reference Santos, Clemente and Martins42). The increase in cortisol concentration found in stunted children(Reference Martins, Neves and Garcia43) can contribute to the development of insulin resistance(Reference Reynolds, Li and Gray44), and the unhealthy lifestyle and increase in BMI/A in children with DBM contribute to the impairment of glucose metabolism(Reference Wells, Sawaya and Wibaek45).
A limitation of the present study is the low number of children and adolescents studied. The reason was the low prevalence of DBM found in this population, although almost 3000 children and adolescents were evaluated from eight different schools. A further difficulty was the need to select participants with similar age, sex and socio-economic conditions to compose the three study groups. Despite the low number of children and adolescents studied, our findings showed the importance of this study and the need for further investigations. Another limitation that needs to be acknowledged is the cross-sectional design, which does not allow for cause/effect analysis.
In conclusion, the present data provide preliminary evidence consistent with the suggestion that DBM children and adolescents may have a persistent desire to eat, but further studies are required to confirm these results in a larger population. Food addiction symptoms were best correlated with body fat and leptin. Together, these findings indicate changes in the DBM associated with the development of non-communicable diseases in the long term and the need for specific attention to aspects related to food addiction.
Acknowledgements
The authors are grateful for the participation of all children and adolescents involved, as well as their parents and/or guardians.
This research was supported by Fundação de Amparo à Pesquisa do Estado de São Paulo (FAPESP, Brazil) – grant number 2018/04164-1. A. L. S. was supported by the CNPQ (Conselho Nacional de Desenvolvimento Científico e Tecnológico) fellowship, number 302602/2018-6, and was responsible for obtaining the funding (FAPESP). R. C. S. M. was supported by CAPES – Coordination for the Improvement of Higher Education Personnel. Both institutes had no role in the design, analysis or writing of this manuscript.
V. J. B. M., A. R. F. and A. L. S. were responsible for designing the study. R. C. S. M., J. K. G. P., A. C. A. V. and M. O. L. F. were responsible for collecting data. R. C. S. M., A. L. S. and V. J. B. M. were responsible for data analysis and the writing of the manuscript. J. L. B. A. was responsible for biochemical analyses. R. C. S. M., V. J. B. M. and A. L. S. were responsible for interpreting results. A. L. S. was responsible for the grant.
None of the authors has any conflicts of interest to declare.


