Glucose is an important energy and carbon source. Owing to the protein-saving effect of carbohydrate, the addition of carbohydrate can reduce the use of protein raw materials in fish feed. Appropriate dietary carbohydrate can both promote fish growth and reduce feed cost(Reference Azaza, Khiari and Dhraief1). However, excessive dietary carbohydrate can exert negative impacts on the growth performance and physiological functions(Reference Zhou, Ge and Liu2).
Moreover, fish muscle quality can also be changed by excessive dietary carbohydrate(Reference Liu, Deng and Pan3,Reference Suárez, Martínez and Abellán4) . The research in dentex (Dentex dentex) found that higher dietary carbohydrate level (28 % v. 4 %) decreased the muscle hardness and caused higher glycogen content in muscle(Reference Suárez, Martínez and Abellán4). In post-mortem fish muscles, glycogen produces lactic acid by anaerobic respiration, which leads to a decrease of muscle pH and meat softening. Glycogen level was proved to be the principal determinant of post-mortem pH in fish(Reference Skjervold, Fjæra and Østby5). Meanwhile, the massive intracellular glycogen accumulation in muscle was proved to be associated with the soft texture in another study of Atlantic salmon (Salmo salar)(Reference Torgersen, Koppang and Stien6). In our previous study, excessive dietary carbohydrate (24 %) reduced the muscle hardness of olive flounder (Paralichthys olivaceus). Meanwhile, it increased the muscle glycogen content(Reference Liu, Deng and Pan3). These results suggested that in fish, the dietary carbohydrate may influence the meat quality by affecting the glycogen content in muscle.
At the same time, research found that excessive dietary carbohydrate content can suppress the immune functions and the anti-oxidative capacities as well as reduce the growth performance in some fish species(Reference Zhou, Ge and Liu2,Reference Liu, Xie and Ge7) . In the study of mammalian cell, high glucose was proved to stimulate reactive oxygen species (ROS) production and suppress mammalian target of rapamycin (mTOR) signalling pathway(Reference Wang, Feng and Li8). High glucose leads to mitochondrial dysfunction and promotes the release of cytochrome C (CytC) form mitochondria, which results in oxidative stress and cell apoptosis(Reference Tiong, Ng and Koh9). ROS was proved to impair flesh quality. It can lead to the oxidation of subcellular membranes and structural proteins, which affect both the meat texture and the muscle water holding capacity, and increase the risk of post-mortem oxidative rancidity in meat(Reference Salami, Majoka and Saha10). Research in broiler found that the oxidative stress in muscle can increase the drip loss and the speed of pH drop by accelerating post-mortem glycolysis. Changes in these meat quality parameters can cause PSE-like (pale, soft and exudative) muscle(Reference Zhang, Xiao and Lee11). In common carp (Cyprinus carpio), research found that the oxidative stress significantly reduced the muscle physicochemical properties(Reference Morachis-Valdez, Dublán-García and López-Martínez12). In the studies of land animals and fish, nutritional factor was proved to be one of the causes of oxidative stress in meat(Reference Salami, Majoka and Saha10,Reference Østbye, Kjær and Rørå13) . As an important nutritional factor, glucose may also play a role in promoting the production of ROS in fish and thereby affect the fish muscle quality.
High glucose-induced oxidative stress was found to inhibit the phosphorylation level of mTOR(Reference Wang, Feng and Li8), which negatively affects the protein synthesis and cell growth. Researchers found that the oxidative stress can disrupt the balance between degradation and resynthesis of skeletal muscle proteins. The application of H2O2 inhibited the proliferation accompanied by decreasing the activity of mTOR and p70 ribosomal S6 kinase (p70S6k). At the same time, ROS can also promote proteolysis. Study performed in C2C12 cells found H2O2 treatment increased the mRNA expressions of the two E3 ubiquitin ligases (MAFbx and MuRF-1), which mediate in skeletal muscle catabolism(Reference Li, Chen and Li14). In some research with fish cells, the uptake and metabolism of glucose was studied(Reference Magnoni, Vraskou and Palstra15,Reference Sánchez-Gurmaches, Cruz-Garcia and Gutiérrez16) . However, there is little research on the effect of high glucose on fish cells, the mechanism of high glucose on retarded growth and oxidative stress is not yet entirely clear in fish species.
Olive flounder (P. olivaceus) is an economically important marine carnivorous fish species in East Asia. Previous studies showed that excessive dietary carbohydrate level negatively regulated the growth performance and muscle quality of olive flounder(Reference Liu, Deng and Pan3,Reference Deng, Pan and Liu17) . Further research is needed to understand how the high glucose condition affect the muscle of olive flounder. In the present study, the primary cultured muscle cells of olive flounder were used to focus on the accumulation of glycogen, apoptosis and muscle growth under high glucose condition. The aim of the present study is to explore the effect of high glucose on fish muscle cells and its potential mechanism.
Materials and methods
Ethical statement
The present study was performed in strict accordance with the recommendations in the Guide for the Use of Experimental Animals of Ocean University of China. The protocols for animal care and handing used in this study were approved by the Institutional Animal Care and Use Committee of Ocean University of China.
Animals
Olive flounder with weight ranging from 8 to 10 g were purchased from a commercial fish farm in Haiyang city, Shandong, China. After disinfection, fish were kept in 0·4 m3 tanks with a re-circulating water system at 23°C.
Primary cell cultures
The muscle cells of olive flounder were isolated according to the protocols described by Magnoni et al.(Reference Magnoni, Vraskou and Palstra15) with some modifications. The detail steps of cell culture and verification were according to the previous study(Reference Liu, Pan and Huang18). Briefly, fish was euthanised by immersion in eugenol (Sigma, St. Louis, MO, USA) (80 mg/l). White epaxial muscle was excised under sterile conditions and minced. The Dulbecco’s Modified Eagle Medium (without glucose) (Sangon Biotech and Ham’s F12 medium (F12) (HyClone) were mixed 1:1 to make the basal medium (5 mM D-glucose). The basal medium was supplemented with 10 % fetal bovine serum (FBS) (Bioind) and antibiotics (Penicillin-Streptomycin, 100 U/ml) (HyClone, Logan, UT, USA) to make the complete medium. The fragments were centrifuged and digested by Type II collagenase (0·2 %) (MP Biomedicals, Solon, OH, USA) and trypsin (0·1 % final concentration in the basal medium) (HyClone). The suspension was centrifugated, and the supernatant was collected in cold basal medium containing fetal bovine serum (FBS) (Bioind) and antibiotics (Penicillin-Streptomycin, 100 U/ml) (HyClone). After centrifugation, the resulting pellet was resuspended in the complete medium and filtered through a 40-μm nylon cell strainer. Cells were incubated at 23°C without CO2.
Glucose concentration in medium of high glucose condition
As there is little research on effects of high glucose concentration on fish cells in vitro, the present study referred the literatures from other species(Reference Halliwell19–Reference Gonzalez and Yamazaki25). The treatment of high glucose on cells usually used the medium containing 20 mM, 25 mM, 33 mM or 50 mM of glucose. To choose a suitable ‘high’ glucose level, a series of medium with graded levels of glucose were designed. The cell viability was tested by Cell-Counting Kit-8 (CCK-8) reagents (Sigma) after the 24-h incubation of the medium containing 5 mM, 20 mM, 25 mM, 33 mM or 50 mM of D-glucose (Sigma). Using the decrease of cell viability as indicator, 33 mM and 50 mM of glucose were considered as high glucose level for olive flounder muscle cells (Fig. 1(a)). However, 55 mM might be excessive high compared with 33 mM. In order to avoid the potential effects unrelated to glucose, the 33 mM of glucose was chosen as the high glucose condition in the present study to investigate the effect of high glucose on olive flounder muscle cells.
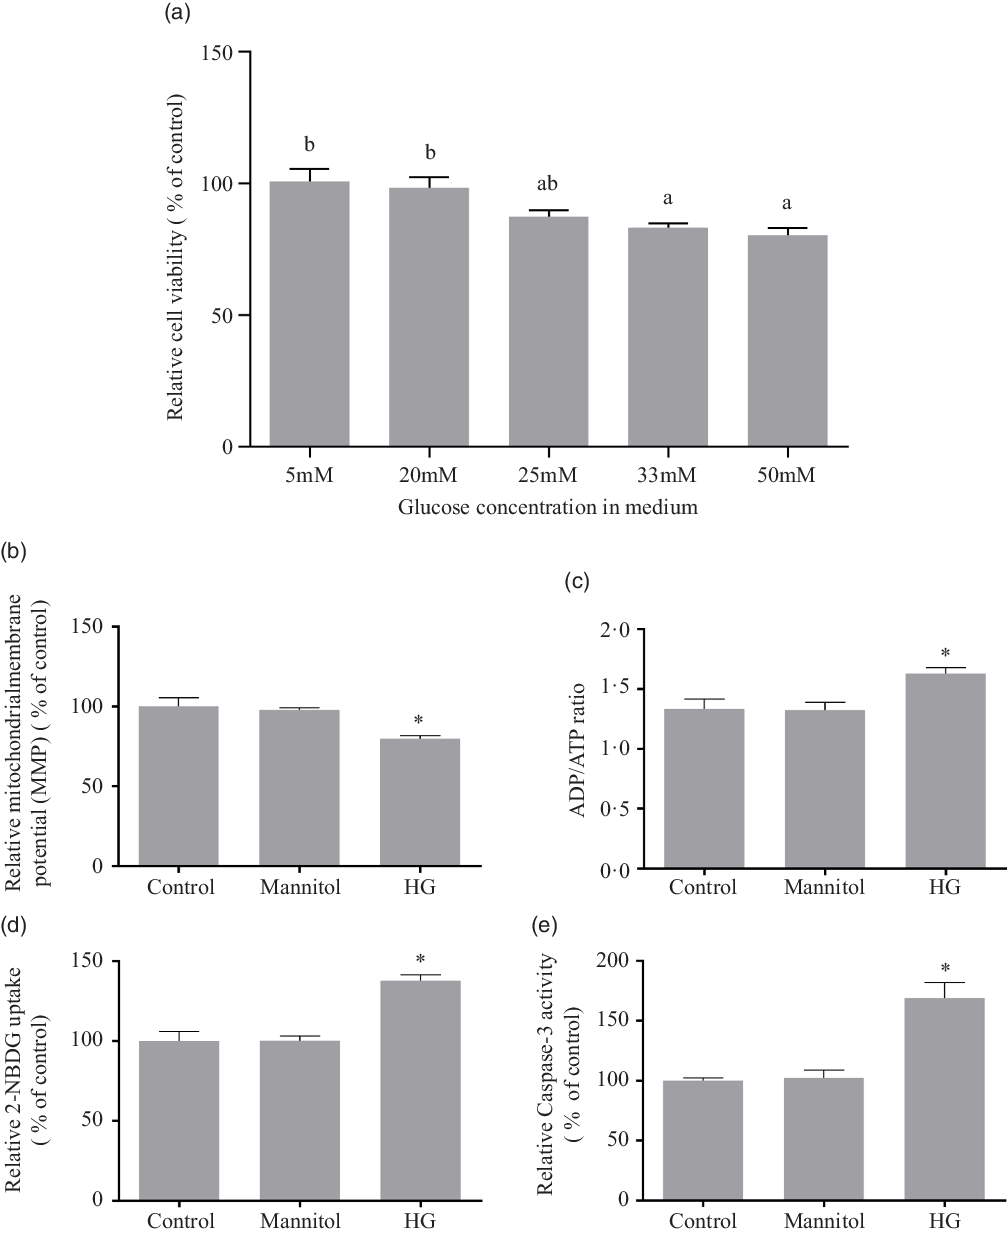
Fig. 1. Effect of different medium glucose concentration on the muscle cells viability of olive flounder (a) and the effects of high glucose on mitochondrial function, glucose uptake ability and caspase-3 activity (b–e). (b) Relative MMP as shown by the red/green fluorescence intensity ratio with JC-1 dye. (c) Relative ADP/ATP ratio in olive flounder muscle cells. (d) 2-[N-(7-nitrobenz-2-oxa-1,3-diazol-4-yl) amino]-2-deoxy-D-glucose (2-NBDG) (a fluorescent indicator for direct glucose uptake measurement) uptake in olive flounder muscle cells. (e) Relative caspase-3 activity in olive flounder muscle cells. Results are represented as mean ± sd (n 3). Values with different letters mean significant differences (P < 0·05). *means significantly different compared with the Control group.
Analysis of reactive oxygen species
The levels of intracellular ROS were determined by 2’, 7’-dichlorofluorescein diacetate (DCFH-DA) (Sigma) assay. Briefly, olive flounder muscle cells were plated in 96-well plates (Corning) (5 × 10³ cells/well) or in 6-well culture plates (Corning) (1 × 10⁵ cells/well) in the complete medium. After 24-h incubation, cells were treated with the complete medium containing 5 mM D-glucose, 5 mM D-glucose and 28 mM mannitol (Merck KGaA, Darmstadt, Germany) (as an isotonic contrast) or 33 mM D-glucose. These three groups were named as the Control group, the Mannitol group and the HG (high glucose) group, respectively. After 24 h, the cells were incubated with 10 μM DCFH-DA for 15 min at 23°C. For the cells in 96-well plates, intracellular fluorescence was measured at an excitation wavelength of 485 nm and an emission wavelength of 530 nm using a fluorescence microplate reader (Spectra Max i3x, Molecular Devices). The values were normalised on cell proliferation by MTT assay (C0009, Beyotime Institute of Biotechnology). Three independent experiments were performed for each assay condition. Meanwhile, the ROS levels in cells in 6-well plates were determined using a fluorescence microscope (Echo Laboratories).
Apoptosis assay
The apoptosis of cells was detected by an annexin V-fluorescence image in the fluorescein isothiocyanate and propidium iodide kit (Vazyme, A211–01). The cells were incubated as stated above. After staining, the cells were analysed on a flow cytometer (Beckman, CA, USA) to determine the rate of apoptosis. Briefly, cells were trypsinised, centrifuged, washed twice with ice-cold PBS (HyClone). The cells were then resuspended in binding buffer containing annexin-fluorescence image in the fluorescein isothiocyanate and propidium iodide. Cells were incubated at room temperature for 10 min and then analysed by flow cytometry within 1 h.
Caspase-3 activity assay
Caspase-3 activity in the cells was detected using a caspase-3 Activity assay kit (C1115, Beyotime Institute of Biotechnology) according to the manufacturer’s instruction. Briefly, after incubating as stated above, the cells were collected and lysed with lysis buffer on ice. The cell lysate was subsequently centrifuged (16 000 × g, 10 min, 4°C), and then the supernatant was collected. Protein concentrations were measured using a bicinchoninic acid assay kit (P0012, Beyotime Institute of Biotechnology). The acetyl-Asp-Glu-Val-Asp p-nitroanilide (Ac-DEVD-pNA) was added to the supernatant. The absorbance was measured at 405 nm with a microplate reader, and the data were normalised by protein concentration.
Measurement of mitochondrial membrane potential and ADP/ATP ratio
The mitochondrial membrane potential (MMP) was detected by a JC-1 kit (C2006, Beyotime Institute of Biotechnology) according to the manufacturer’s instructions. In brief, after the treatment, muscle cells were collected and incubated with JC-1 working solution at 37°C for 20 min. After that, cells were washed by JC-1 dye buffer twice. The fluorescence intensity was immediately measured using fluorescence microplate reader. The ratio of red fluorescence intensity to green fluorescence intensity was used to represent the level of MMP. The ratio of ADP:ATP was measured using the Enzylight ADP/ATP ratio assay kits (ELDT-100, BioAssay Systems) in accordance with manufacturer’s recommendations.
Glucose uptake assay
Cells were seeded in 96-well plates at a density of 5 × 10³ cells/well and incubated at 23°C for 24 h. Then, the cells were incubated as stated above. After the 24-h incubation, the cells were washed with PBS and treated with 100 nM 2-[N-(7-nitrobenz-2-oxa-1,3-diazol-4-yl) amino]-2-deoxy-D-glucose (2-NBDG) (Invitrogen, Carlsbad, CA, USA) (a fluorescent indicator for direct glucose uptake measurement) for 30 min. Then cells were washed twice with ice-cold PBS, and intracellular fluorescence intensity was measured with a fluorescence microplate reader at an excitation wavelength of 485 nm and emission wavelength of 538 nm. The values were normalised on cell proliferation by MTT assay.
Cell glycogen analysis and periodic acid-schiff assay
To analyse cell glycogen concentration, cells were seeded in 6-well plates at a density of 1 × 10⁵ cells/well and incubated at 23°C for 24 h. The cells were incubated as stated above for another 24 h. After incubation, cells were washed with PBS, and then the glycogen content was determined by using a glycogen content assay kit (BC0345, Solarbio Science and Technology Co., Ltd.) according to the manufacturer’s instructions. Glycogen staining was performed with a periodic acid-Schiff staining kit (G1360, Solarbio Science and Technology Co., Ltd.) according to the manufacturer’s protocol.
Gene expression
After treatment, the medium was removed, and cells in 6-well plates were washed three times with 2 ml PBS per well and lysed in 1 ml Trizol (Invitrogen). RNA from cells was extracted by Trizol and quantified on a spectrophotometer (NanoDrop 2000, Thermo Fisher Scientific). Reverse transcription was performed using PrimeScript RT reagent kit with gDNA Eraser (Perfect Real Time, Takara). The quantity of cDNA for each transcript was analysed on the ABI7500 system (Applied Biosystems) using TB Green Fast qPCR Mix (Takara, Shiga, Japan). The present study analysed target genes including: optic atrophy protein1(opa1), mitofusin 1 (mfn-1), mitofusin 2 (mfn-2), glycogen synthase (gysm: muscle type), glycogen phosphorylase (pygm: muscle type), phosphofructokinase (pfk), pyruvate kinase (pk), myostatin-1 (mstn-1), muscle RING-finger protein 1 (murf-1), muscle atrophy F-box protein (mafbx), myoblast determination protein (myod), myogenin (myog), muscle-specific regulatory factor 4 (mrf4) and myogenic factor 5 (myf5). The primers for gene expression analysis were obtained from the previous studies(Reference Liu, Deng and Pan3,Reference Deng, Pan and Liu17) . Relative quantifies of target genes were calculated by the ΔΔCt method using β-actin gene expression as reference. All the primers used in the present study were listed in Table 1.
Table 1. List of PCR primer pairs used for the real-time Q-PCR analysis

Western blot analysis
After treatment, the medium was removed, and cells in 6-well plates were washed three times with 2 ml PBS per well and lysed in 200 μl radioimmunoprecipitation lysis buffer (Solarbio Science and Technology Co., Ltd.) supplemented with protease and phosphatase inhibiter cocktail (Roche) at 0°C for 30 min. Homogenates were centrifuged at 12 000 g for 10 min at 4°C, and the protein concentration in the supernatant was determined using a bicinchoninic acid protein assay kit. Nuclear protein and mitochondria protein were extracted using a NE-PER Nuclear and Cytoplasmic Extraction Reagents Kit (Thermo Fisher Scientific) and a Cell Mitochondria Isolation Kit (C3601, Beyotime Institute of Biotechnology) according to the manufacturers’ instructions, respectively. Equal amounts of protein were separated by SDS-PAGE and transferred to 0·45 μm PVDF membrane (Millipore). Incubation with the primary antibody was performed overnight at 4°C. The primary antibodies used were phospho-AMP-activated protein kinase (AMPK) (Thr172) (dilution 1:1000, Beyotime Institute of Biotechnology, cat. No. AA393), AMPK (dilution 1:1000, Cell Signaling Technology Inc., Cat. No. 5831), phospho-mTOR (Ser2448) (dilution 1:1000, Cell Signaling Technology Inc., Danvers, MA, Cat. No. 2971), mTOR (dilution 1:1000, Cell Signaling Technology Inc., Cat. No. 2972), phospho-S6 (Ser235/236) (dilution 1:2000, Cell Signaling Technology Inc., Cat. No. 4858), S6 (dilution 1:1000, Cell Signaling Technology Inc., Cat. No. 2217), phosphor-4EBP-1 (Thr37/46) (dilution 1:500, Cell Signaling Technology Inc., Cat. No. 2855), 4EBP-1 (dilution 1:500, Beyotime Institute of Biotechnology, cat. No. AF5159), nuclear factor erythroid 2-related factor 2 (Nrf2) (dilution 1:500, Cell Signaling Technology Inc., Cat. No. 12 721), uncoupling protein 2 (UCP2) (dilution 1:2000, Protein Tech, Cat. No. 11 081–1-AP), CytC (dilution 1:500, Beyotime Institute of Biotechnology, cat. No. AC909), cleaved caspase-3 (dilution 1:1000, WanleiBio, Cat. No. WL01992), PGC-1α (dilution 1:1000, Abcam, Cat. No. ab54481), glucose transporter 4 (GLUT4) (dilution 1:1000, WanleiBio, Cat. No. WL02425), COX IV (dilution 1:1000, Cell Signaling Technology Inc., Cat. No.4850), Lamin B1 (dilution 1:500, WanleiBio, cat. No. WL01775) and β-actin (dilution 1:5000, Bioss Antibodies, Cat. No. bs-0061R). All the antibodies were selected in accordance with the method described by Skiba-Cassy et al.(Reference Skiba-Cassy, Lansard and Panserat26) and Shi et al.(Reference Shi, Jin and Sun27), and most of the antibodies had been successfully used in fish species such as olive flounder(Reference Liu, Deng and Pan3), turbot (Scophthalmus maximus)(Reference Jiang, Bian and Zhou28), Nile tilapia (Oreochromis niloticus)(Reference Han, Wang and Li29), rainbow trout (Oncorhynchus mykiss)(Reference Aedo, Fuentes-Valenzuela and Molina30) and zebrafish (Danio rerio)(Reference Yogev, Williams and Hinits31). After the incubation, the membrane was washed with Tris-buffered saline with Tween and incubated with secondary antibody (HRP-labelled goat anti-Rabbit lgG) (Beyotime Institute of Biotechnology, Nanjing, China) at 1:5000 dilution for 1 h at room temperature. After that, the membrane was developed with Beyo ECL Plus reagent (Beyotime Institute of Biotechnology) and exposed to the X-ray file. The band densities were quantified using ImageJ software (National Institutes of Health).
Statistical analysis
All statistical evaluations were analysed by software SPSS 22.0 (IBM Corp). The cell viability in different medium glucose concentration was analysed by ANOVA followed by Tukey’s multiple range tests. Other statistical analyses were analysed by t test compared with the Control group. All data were expressed as means ± sem. Differences were considered significant when P < 0·05.
Results
Changes in mitochondrial membrane potential and relative ADP/ATP ratio in cells
The high glucose treatment significantly reduced the MMP (P < 0·05), and mannitol did not affect the MMP of olive muscle cells (P > 0·05) (Fig. 1(b)). The ADP/ATP ratio (Fig. 1(c)) was significantly increased in HG group compared with the Control group (P < 0·05), while the addition of mannitol did not change it significantly (P > 0·05).
2-NBDG uptake in cells
It was found that, after the 24-h incubation, high glucose condition significantly induced glucose uptake in olive flounder muscle cells (P < 0·05). No significant difference was found between the Mannitol group and the Control group (P > 0·05) (Fig. 1(d)).
Relative quantification of reactive oxygen species level in cells
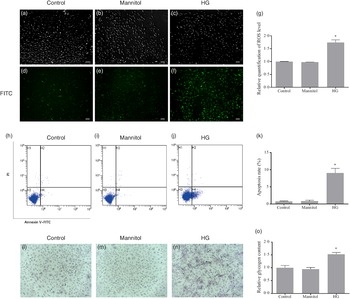
The fluorescence intensity of fluorescent 2',7'dichlorofluorescein (oxidation product of DCFH-DA by hydrogen peroxide) in the HG group was significantly higher than that in the Control group (P < 0·05). No difference was found between the Mannitol group and the Control group (Fig. 2(g)). As the fluorescence intensity represents the level of ROS production, this result showed that high glucose could increase the production of ROS in cultured olive flounder muscle cells. Meanwhile, more intense fluorescence signal was found in the HG group (Fig. 2(f)). The fluorescence micrographs also showed that the intracellular ROS level was induced by high glucose condition.

Fig. 2. Effects of high glucose on intracellular reactive oxygen species (ROS) content (a–g), cell apoptosis (h–k) and intracellular glycogen content (l–o). (a–f) Fluorescence micrographs of generation of ROS in olive flounder muscle cells. The fluorescence intensity generated by 2',7'dichlorofluorescein represents the content of ROS. Fluorescence image in the fluorescein isothiocyanate channel showed the intracellular ROS level was induced by high glucose condition (f). (g) Relative quantification of ROS level in muscle cells of olive flounder. Apoptosis of muscle cells of the Control group (h), the Mannitol group (i) and the high glucose (HG) group (j). (k) The percentage of total apoptosis cells (early apoptotic cells and late apoptotic cells). Periodic acid-Schiff (PAS) analysis of the glycogen concentration in the Control group (l), the Mannitol group (m) and the HG group (n); bar = 100 µm, cells were stained for glycogen (pink). High glucose treatment increased the glycogen concentration (n) in olive flounder muscle cells. (o) Relative glycogen content in olive flounder muscle cells. Results are represented as mean ± sd (n 3). *means significantly different compared with the control group.
Apoptosis detection of cells
After annexin V and propidium iodide double stating, induction of cell apoptosis by high glucose was detected and quantified by flow cytometry. Apoptosis of cells in different groups was shown in four-quadrant diagram (Fig. 2(h)–(j)). The average percentages of apoptotic cells were 0·75 %, 0·86 % and 9·06 % in the Control group, the Mannitol group and the HG group, respectively (Fig. 2(k)). The apoptotic percentage in the HG group was significantly higher than that in the Control group (P < 0·05). At the same time, the high glucose condition induced the activity of caspase-3 (P < 0·05) (Fig. 1(e)), which is also a marker of apoptosis. No difference was found between the Mannitol group and the Control group.
Glycogen concentration in cells
The cells in the HG group had a significant higher glycogen concentration than those in the Control group (P < 0·05). No significant difference was detected between the cells in Mannitol group and cells in the Control group (P > 0·05) (Fig. 2(o)). To show intracellular glycogen concentration results more intuitively, periodic acid-Schiff staining was used to analyse the intracellular glycogen concentration. The high glucose-treated cells stained more positively for glycogen (Fig. 2(l)–(n)). High glucose treatment increased the glycogen concentration in olive flounder muscle cells.
Relative expressions of mitochondria-related genes, glycogen metabolism genes, protein degradation genes and myogenic regulatory factors
After treated with high glucose, the mRNA levels of optic atrophy protein1(opa1) and mitofusin 2 (mfn-2) were significantly decreased (P < 0·05), while mitofusin 1 (mfn-1) expression remained unchanged (P > 0·05). (Fig. 3(a)). The expressions of glycogen metabolism genes were also affected by high glucose treatment. In the HG group, the mRNA level of glycogen synthase (gysm: muscle type) significantly increased (P < 0·05), while the mRNA level of glycogen phosphorylase (pygm: muscle type) significantly decreased (P < 0·05). However, the gene expressions of the two rate-limiting enzymes of glycolysis: phosphofructokinase (pfk) and pyruvate kinase (pk) remained unchanged in the three groups (P > 0·05) (Fig. 3(b)). The expressions of myostatin-1 (mstn-1), muscle RING-finger protein 1 (murf-1) and muscle atrophy F-box protein (mafbx) were all induced by the high glucose treatment (P < 0·05) (Fig. 3(c)). High glucose significantly affected the gene expressions of myogenic regulatory factors. The mRNA expressions of myoblast determination protein (myod), myogenin (myog) and myogenic factor 5 (myf5) were significantly decreased in the HG group (P < 0·05), while the gene expression of muscle-specific regulatory factor 4 (mrf4) was not changed by the high glucose treatment (P > 0·05) (Fig. 3(d)). No significant difference was found between the Mannitol group and the Control group (P > 0·05).
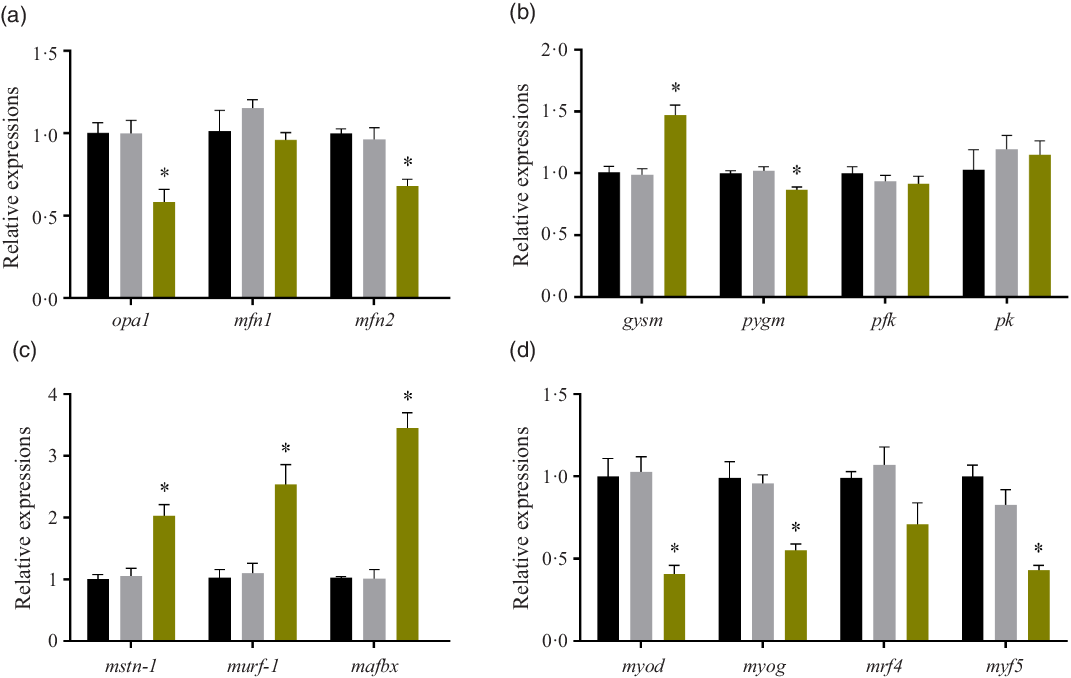
Fig. 3. Effect of high glucose on gene expressions. (a) Relative expressions of mitochondria-related genes after the high glucose treatment in olive flounder muscle cells. (b) Relative expressions of glycogen metabolism genes after the high glucose treatment in olive flounder muscle cells. (c) Relative expressions of protein degradation gene after the high glucose treatment in olive flounder muscle cells. (d) Relative gene expressions of myogenic regulatory factors (MRF) after the high glucose treatment in olive flounder muscle cells. Results are represented as mean ± sd (n 3). * means significantly different compared with the Control group. ![]() , Control;
, Control; ![]() , Mannitol;
, Mannitol; ![]() , HG.
, HG.
Western blot analysis in cells after high glucose treatment
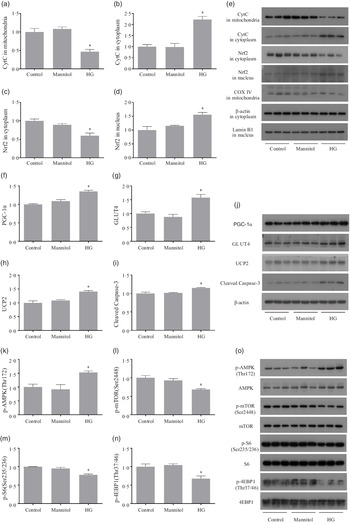
After treated with high glucose, the CytC level in mitochondria was significantly decreased (P < 0·05), while the CytC level in cytoplasm was significantly increased (P < 0·05). The downregulation of Nrf2 in cytoplasm (P < 0·05) was observed in cells of the HG group, and Nrf2 in nucleus was significantly increased in the HG group (P < 0·05) (Fig. 4(a)–(e)). Cells treated with high glucose had significantly higher protein levels of PGC-1α, GLUT4, UCP2 and cleaved caspase-3 (P < 0·05) (Fig. 4(f)–(j)). The phosphorylation level of AMPK (Thr172) was significantly increased in the HG group, while the phosphorylation levels of mTOR (Ser2448), S6 (Ser235/236) and 4EBP-1 (Thr37/46) were significantly decreased in the HG group (P < 0·05) (Fig. 4(k)–(o)). No significant difference of these protein expressions was found between the Mannitol group and the Control group (P > 0·05).

Fig. 4. The results of Western blot analysis. High glucose increased the release of mitochondrial CytC as well as increases the nuclear translocation of Nrf2 (a–e). High glucose increased the expressions of PGC-1α, GLUT4, UCP2 and cleaved caspase-3 (f–j). High glucose increased the phosphorylation level of AMPK as well as inhibits the mTOR signalling (k–o). Results are represented as mean ± sd (n 3). *means significantly different compared with the Control group.
Discussion
Mitochondria plays a vital part in energy production in fish skeletal muscle. Besides being the main sites for energy production, mitochondria are also the major regulators of apoptosis. The mitochondrial dysfunction and oxidative stress-mediated mitochondrial injuries play important roles in cell apoptosis(Reference Makino, Suarez and Gawlowski32). MMP is a central bioenergy parameter controlling ATP synthesis, respiratory rate and ROS production. It is controlled by electron transfer and proton leakage. Loss of MMP is one of the causes of mitochondrial dysfunction, and the loss of MMP caused by high glucose treatment has been reported(Reference Makino, Suarez and Gawlowski32). Meanwhile, decreased MMP indicates mitochondrial damage and the early phase of apoptosis. In the present study, high glucose treatment significantly decreased the MMP in olive flounder muscle cells. It is indicated that the mitochondrial function was affected by high glucose. Mitochondria are the major source of ROS generation. When damaged by oxidative stress, mitochondria product more superoxide. As the key responders of the stress, mitochondria are the most immediate targets of the oxidative damage inflicted by ROS. ROS can elicit mitochondrial dysfunction and loss of ATP in cells, in turn, mitochondrial dysfunction leads to excessive accumulation of ROS and ATP consumption(Reference Brownlee33). Oxidative stress was proved to shift mitochondria towards consuming rather than synthesising ATP, which may be one of the reasons for the decrease of ATP/ADP ratio under high glucose condition(Reference Chinopoulos and Adam-Vizi34). In the present study, cells treated with high glucose accumulated significantly higher amount of ROS. Meanwhile, the ADP/ATP ratio was significantly increased in the HG group, which is a manifestation of mitochondrial dysfunction.
Optic atrophy protein 1 (OPA1), mitofusin 1 (MFN1) and mitofusin 2 (MFN2) are three proteins required for mitochondrial fusion and modulating mitochondrial architecture. OPA1 is associated with better mitochondrial function and energy efficiency. It can also reduce the ROS generated by mitochondria. Mitofusins were found to increase the mitochondrial energetic efficiency and MMP(Reference Schisano, Harte and Lois35). Previous study found that Mfn2 deficiency induced mitochondrial dysfunction and ROS production(Reference Sebastián, Hernández-Alvarez and Segalés36). In the present study, the decreased expressions of opa1 and mfn2 were accompanied by increased ROS content in the HG group. This is consistent with the results of previous studies(Reference Hüttemann, Pecina and Rainbolt37,Reference Ramzan, Vogt and Kadenbach38) . It is suggested that high glucose might negatively affect mitochondrial function partly by downregulating the mRNA expressions of mitochondrial fusion proteins.
The damage of the mitochondrial membrane by ROS leads to leakage of CytC followed by cell apoptosis. CytC is essential for the mitochondrial electron transport and cell apoptosis. The release of CytC from mitochondria to cytoplasm is a key step in the apoptotic cascade. ROS mediates MMP loss and mitochondrial permeability transition, then the CytC is released into the cytoplasm and results in the activation of caspase cascades, thus lead to cell apoptosis(Reference Hüttemann, Pecina and Rainbolt37). Caspase proteases family has a vital catalytic role in apoptosis, and caspase-3 is the most critical one. The activity of caspase-3 would give an index to the process of apoptosis. The present study found that high glucose treatment induced the expression of cleaved caspase-3 (active form) and increased the activity of caspase-3, which are indexes to the process of apoptosis. Actually, the results of apoptosis determined by flow cytometer also confirmed the increased cell apoptosis in the HG group. Moreover, high glucose condition was proved to cause ROS overproduction by increasing metabolic input into mitochondria and disrupting the electron transport chain(Reference Brownlee33). Overproduction of ROS could lead to oxidative damage of lipids, DNA and proteins, as well as lead to cell and tissue injury by apoptosis and mitochondrial dysfunction(Reference Ramzan, Vogt and Kadenbach38). As ROS(Reference Salami, Majoka and Saha10) and cell apoptosis(Reference Zhang, Wang and Huang39) were both reported to affect muscle quality, the excessive ROS produced from mitochondria and the cell apoptosis in high glucose condition might be some of the reasons that high glucose affect the muscle quality of olive flounder.
UCP2 is a mitochondrial carrier protein. It is identified as a critical regulator of cellular fuel utilisation and involved in the defense against the generation of ROS(Reference Patanè, Anello and Piro40). Under oxidative stress, UCP2 decreases MMP by mediating proton leak across the inner mitochondrial membrane. Meanwhile, it regulates the ADP/ATP ratio by decreasing ATP production. Like the result from previous study(Reference Patanè, Anello and Piro40), the UCP2 expression in olive flounder muscle cells is also positively regulated by high glucose. The depressed MMP and elevated ADP/ATP ratio in the HG group might be the result of enhanced expression of UCP2. Nrf2 is a transcription factor that plays a crucial role in cellular defense. The nuclear translocation of Nrf2 accelerates the removal of ROS thus relieving oxidative stress(Reference Yu, Peng and Liao41). In the present study, the nuclear translocation of Nrf2 and upregulation of UCP2 may function as alternate adaptive responses to the overproduction of ROS from mitochondria. It can be inferred that olive flounder muscle cells had the protective mechanisms against oxidative stress when high glucose caused damage to the mitochondrial health and function.
The present study found that high glucose treatment significantly increased the glucose uptake in olive flounder muscle cells, as evaluated by 2-NBDG. In addition to this, the expression of GLUT4, which plays a key role in glucose uptake in muscle(Reference Richter and Hargreaves42), was also tested. The protein expression of GLUT4 was significantly increased in the HG group. These results indicate that the cells in the HG group had an enhanced ability of glucose uptake. AMPK is a sensor of cell energy state. The ratio of ADP/ATP is positively correlated with AMPK activity. ROS has been shown to stimulate glucose uptake in skeletal muscle, as AMPK is also activated by metabolic stress condition such as oxidative stress(Reference Hardie, Ross and Hawley43). In the present study, the ADP/ATP ratio and ROS level were both significantly increased in the HG group. The results of these two regulators of AMPK can explain the up-regulated phosphorylation level of AMPK in the HG group. The enhancement of AMPK phosphorylation increases the glucose uptake through a GLUT4-mediated mechanism. In muscle cells of brown trout (Salmo trutta), the activation of AMPK increased the mRNA level of GLUT4, thus increased the glucose uptake(Reference Magnoni, Vraskou and Palstra15). The activation of AMPK in the HG group could be the major reason for the enhanced glucose uptake.
The glycogen content in cells was induced by the high glucose treatment in the present study. PGC-1α has the ability to enhance the muscle glycogen storage by increasing the expression of GLUT4 and decreasing the expression of glycogen phosphorylase(Reference Summermatter, Santos and Pérez-Schindler44). It is reported that glycogen synthase and glycogen phosphorylase are the two major enzymes affecting the muscle glycogen metabolism. The glycogen synthesis and glycogen decomposition in muscle are promoted by glycogen synthase and glycogen phosphorylase, respectively(Reference Furukawa, Irachi and Koyama45). It was found in the present study that the expressions of PGC-1α and GLUT4 in the HG group were significantly increased. The mRNA expression of pygm was decreased, while the mRNA expression of gysm was upregulated in the HG group. The glycogen accumulation in the cells of the HG group might be partly due to the increased glucose uptake, upregulation of glycogen synthesis and the reduced glycogen decomposition capacity. PGC-1α is a downstream factor of AMPK, and the activation of AMPK can increase the expression of PGC-1α (Reference Magnoni, Vraskou and Palstra15). In this study, the activation level of AMPK was also increased in the HG group. Considering all these results, it was suggested that high glucose might lead to muscle glycogen accumulation by affecting glucose uptake and glycogen metabolism in fish via the activation of AMPK/PGC-1α. At the same time, the increased glycogen content will inevitably affect the glycolysis potential and the pH of fish muscle(Reference Skjervold, Fjæra and Østby5), thus having a negative impact on muscle texture.
The growth and development of skeletal muscle requires activation of myogenic regulatory factors, including MyoD, Myf5, MyoG and Mrf4. MyoD and Myf5 regulate proliferation of myoblasts, while MyoG and Mrf4 control the differentiation and the fusion of myoblasts(Reference Watabe46). Myostatin (MSTN) is a negative regulator of muscle growth. It has been shown that MSTN can decrease the mRNA levels of myogenic regulatory factors in fish(Reference Liu, Pan and Huang18). High glucose has been reported to inhibit myogenesis of C2C12 mouse myoblast cells by decreasing intracellular levels of MyoD and MyoG and increasing the cellular content of MSTN(Reference Luo, Ai and Wang47). In the present study, high glucose significantly increased the mRNA level of mstn-1. At the same time, the gene expressions of myod, myog and myf5 were significantly decreased in the HG group. The C2C12 cells and the cells used in the present study are both muscle derived. These results indicate that the myogenesis of olive flounder muscle cells was suppressed by high glucose treatment. High glucose level might be an abnormal nutritional condition that can inhibit the differentiation of myoblasts and finally reduce the number of muscle fibers(Reference Luo, Ai and Wang47) in olive flounder. Concurrently, the mRNA expressions of murf-1 and mafbx were significantly increased in the HG group. MuRF-1 and MAfbx are two ubiquitin ligases that participate in fish muscle atrophy. Research in C2C12 myotubes showed that oxidative stress increases the expressions of MAFbx and MuRF1(Reference Li, Chen and Li14). Besides, MSTN was also reported to increase the gene expressions of mafbx and murf-1 (Reference McFarlane, Plummer and Thomas48). In the present study, increased oxidative stress was proved to exist in the HG group by the enhanced ROS level. The mRNA expressions of murf-1 and mafbx might be stimulated by the increased ROS level and the upregulated mstn-1 expression. The increased expressions of these two E3 ubiquitin ligases (murf-1 and mafbx) may contribute to the protein degradation of olive flounder muscle cells under high glucose condition.
mTOR is a serine-threonine kinase, it controls translation, protein stability and transcription. The mTOR/p70S6K/4EBP-1 signalling pathway is essential for cell growth and protein synthesis; p70S6K and 4EBP-1 are two downstream effectors of mTOR that promote protein synthesis(Reference Ohanna, Sobering and Lapointe49). In the present study, the activation state of mTOR in olive flounder muscle cells was analysed. Results showed that the phosphorylation level of mTOR was reduced by high glucose treatment. At the same time, the phosphorylation levels of 4EBP-1 and S6 were also downregulated in the HG group. S6 is a primary substrate of p70S6K, and its phosphorylation level reflects the phosphorylation level of p70S6K(Reference Ruvinsky and Meyuhas50). Thus, it can be concluded that high glucose inhibits the activation of mTOR/p70S6K/4EBP-1 signalling pathway, which could inhibit the protein synthesis and growth of olive flounder muscle cells. Similar results were found in the studies of other cells, in which the high glucose treatment significantly inhibit the activation of mTOR(Reference Wang, Feng and Li8,Reference Tiong, Ng and Koh9) . High glucose was shown to be a nutritional state unfavourable to the growth of olive flounder muscle cells. Apart from the inhibited mTOR singnalling pathway, the AMPK activity and mstn-1 expression were increased in the HG group. AMPK and MSTN were proved to be upstream regulatory elements of mTOR. Studies have identified that both the activation of AMPK and MSTN result in the inhibition of mTOR signalling pathway, thus suppressing protein synthesis(Reference Deldicque, Theisen and Francaux51,Reference Seiliez, Taty Taty and Bugeon52) . Therefore, high glucose could inhibit mTOR activity through AMPK and MSTN-1. It is reasonable to infer that high glucose has negative effects on the growth, protein synthesis and myogenesis of olive flounder muscle cells. These results are consistent with the growth decline of some cultured fish under high dietary carbohydrate level(Reference Zhou, Ge and Liu2,Reference Wang, Li and Han53) and explain this phenomenon to a certain extent at the cellular level. Previous studies found that high dietary carbohydrate level led to growth inhibition and inflammation in olive flounder. Accompanied with these changes, one of the main physiological indicators in the olive flounder fed with high carbohydrate diet is the significantly higher blood glucose level compared with the fish fed with lower carbohydrate diet(Reference Deng, Pan and Liu17,Reference Liu, Deng and Sampath54,Reference Yang, Deng and Pan55) . In the present study, 33 mM of medium glucose concentration led to a significant decrease in cell viability, which is a critical in vitro parameter, so this concentration of medium glucose may mimic the adverse physiological conditions of blood glucose change caused by high carbohydrate diet in olive flounder, and the present study may provide a cell-based insight into the effect of high glucose on olive flounder.
In conclusion, high glucose increased apoptosis, glycogen accumulation and inhibited protein synthesis in primary cultured muscle cells of olive flounder. Based on the results from the present study, the underlying mechanisms could be concluded as follows: High glucose caused damage to the mitochondrial health and function thus induced the mitochondria mediated apoptotic signalling pathway. It might lead to muscle glycogen accumulation by affecting glucose uptake and glycogen metabolism. In addition, high glucose has negative effects on the activity of mTOR signalling pathway and the expressions of myogenic regulatory factors. It also induced the expressions mstn-1 and E3 ubiquitin ligases (murf-1 and mafbx), thus inhibiting the growth, protein synthesis and myogenesis of olive flounder muscle cells (Fig. 5).

Fig. 5. Summary of the proposed mechanism of the effect of high glucose on olive flounder muscle cells.
Acknowledgements
This work was supported by the National Key R & D Program of China (2019YFD0900200, 2018YFD0900400).
J. L. Data curation, formal analysis, writing-original draft; M. P., D. H., J. W., Y. L. and Y. G. Data curation; W. Z. Conceptualisation, funding acquisition, methodology, supervision, writing-review & editing; K. M. conceptualisation, methodology.
The authors declare no conflicts of interest.