Iodine, as one of the essential trace elements for the human body, is an important raw material for the synthesis of thyroid hormone, which has an important influence on the growth and metabolism of humans(Reference Wang, Cui and Chen1–Reference Zhang, Chen and Cao4). It has been reported that long-term iodine deficiency and iodine excess can lead to the enlargement of thyroid volume (Tvol) and even the development of goiters(Reference Lv, Zhao and Xu5). Since universal salt iodisation was implemented in 1995 to prevent iodine deficiency disorders, China has made remarkable achievements(Reference Wang, Zhang and Ge6). By 2005, iodine deficiency disorder had been eliminated at the national level. However, the problem of excessive iodine is becoming increasingly prominent(Reference Li, Teng and Ba7).
In the 1980s, areas with high water iodine concentration (WIC) were first discovered in Hebei Province, China(Reference Yu8). According to the results of the China National Drinking Water Iodine Survey in 2005, nine provinces, including Anhui, Hebei, Henan and Shanxi, had areas with high WIC, and approximately 30 million people were threatened. Since 2007, China has conducted iodised salt monitoring in areas with high WIC, and since 2012, it has strengthened the monitoring of drinking water iodine and goiters in children. The results of the 2017 National Drinking Water Iodine Survey showed that the number of provinces with excessive iodine in water has expanded to 19, covering a population of 40·65 million, which has become an obvious public health problem(Reference Zhou, Liu and Shen9,Reference Wang, Wan and Liu10) .
Thyroid diseases caused by iodine excess are threatening people’s health. Children, in particular, are in a critical period of growth and development and are very sensitive to iodine excess(Reference Campanozzi, Rutigliano and Macchia11). At present, some cross-sectional studies have been conducted to explore the effects of excess iodine on goiters in children(Reference Medani, Elnour and Saeed12–Reference Chen, Li and Wu14). A study from Port Sudan showed that the goiter rate (GR) was as high as 34·86 %, which was related to excessive iodine(Reference Medani, Elnour and Saeed12). The increase in Tvol observed in southern Brazil was also associated with iodine excess(Reference Duarte, Tomimori and de Camargo13). According to Zhang Wanqi’s research, when the iodine intake of children aged 7–10 years is higher than 250 µg/l and the iodine intake of children aged 11–14 years is higher than 300 µg/l, the GR is over 5 %(Reference Chen, Li and Wu14). Unfortunately, at present, prevention and control measures have not been fully implemented in areas with iodine excess.
National monitoring indicators of areas with high WIC in China were modified in 2018. Therefore, according to the survey results from 2018 to 2020, based on the generalised additive model (GAM), this study explored the factors that influence children’s GR in areas with high WIC and analysed the threshold value of the GR increase caused by the WIC, hoping to clarify the influence of the external environment’s WIC on the GR and provide the basis for formulating and perfecting prevention and control strategies in areas with high WIC, to ensure people’s health.
Materials and methods
Survey areas and subjects
According to the monitoring of areas with high WIC in China in 2018, 2019 and 2020, a cross-sectional study was conducted in provinces with high WIC, including Tianjin, Hebei, Shanxi, Jiangsu, Anhui, Shandong, Henan and Shaanxi. In each year’s monitoring, five villages were selected from the counties with high iodine villages in the above eight provinces by systematic sampling(Reference Lv, Zhao and Xu5,Reference McGarvey, Burch and Matthews15) . If there were fewer than five villages with high WIC in the selected county, all of the villages would be taken, and if there were some villages with WIC above 300 µg/l, at least one village should be sampled. From each village, forty non-boarding students (the number of boys and girls was comparable, age was also balanced) aged 8–10 years were randomly selected from the primary school in the village or central primary school in the township where the sampled villages were located (when the number was less than 40, the age was extended to 6–12 years old). In total, 200 children were surveyed in each county, and the Tvol was measured. Children with hyperthyroidism, thyroiditis and thyroid tumours were excluded. Edible salt, urine and drinking water samples were collected.
Because the sampling and detection methods and detection content were consistent over the years, the data of three years were combined and analysed together.
Ethics statement
This study was conducted according to the guidelines laid down in the Declaration of Helsinki, and all procedures involving human subjects were approved by the Medical Ethics Committee of the Center for Endemic Disease Control of Harbin Medical University. We obtained informed consent from the guardians of the participating children, which was in writing(Reference Liu, Liu and Shen16).
Measurements
Water iodine
Each village was divided into five directions: east, south, west, north and middle. In villages with more than fifty wells, 10 % of the wells were randomly selected in each direction. In villages where the number of wells was less than 50, one well was randomly selected from each direction. If one village had fewer than five wells, all wells were sampled. In the case of a centralised water supply, two peripheral water samples were collected, and the WIC was measured (and the average of two samples was calculated). The WIC was determined by arsenic-cerium catalytic spectrophotometry(Reference Wang, Liu and Li17).
Urine iodine and salt iodine
Children’s middle urine samples were collected with dry plastic pipes without iodine, placed in a refrigerator at −20°C and measured within 4 months(Reference Cui, Liu and Su2,Reference Zhang, Yan and Liu18) . At the same time, 50 g of edible salt samples was collected from the home of each child. Hands were washed before collecting the salt and urine samples to avoid cross-infection. The urinary iodine concentration (UIC) was determined by arsenic-cerium catalysis spectrophotometry, and the determined range is 0–300 µg/l and the minimum determination limit is 2 µg/l(Reference Zhang, Yan and Liu18). If the UIC exceeded the iodine concentration range of the standard curve, samples were diluted down to appropriate concentration (1/5, 1/10, etc.) and re-measured diluted samples using an iodine standard of 0–300 µg/l. The edible salt iodine content was determined by a semi-quantitative (iodine-starch staining) method to identify iodised salt or non-iodised salt(Reference Pandav, Arora and Krishnan19,Reference Torheim, Granli and Sidibé20) .
Thyroid volume
Tvol was measured by experienced inspectors from provincial and municipal centres for disease control and prevention. Training was conducted by a national expert group before the measurements were taken, and the standards were unified. Tvol was measured by B-ultrasound, and the frequency of the B-ultrasound probe was 7·5 MHz and above. The length (l), width (w) and depth (d) of the left and right lobes of the thyroid were measured(Reference Kaloumenou, Alevizaki and Ladopoulos21). The Tvol is equal to the sum volume of the left and right lobes, excluding the thyroid isthmus. The calculation formula of the single Tvol is as follows: V (ml) = 0·479 × d(mm) × w(mm) × l(mm) × 0·001(Reference Wang, Luo and Zang22). The GR was calculated according to the Chinese ‘diagnostic criteria of endemic goiter’ (WS 276-2007). The Tvol of children 6, 7, 8, 9, 10, 11 and 12 years of age exceeds 3·5, 4·0, 4·5, 5·0, 6·0, 7·0 and 8·0 ml, respectively, which is defined as goiter.
Quality control
The professional and technical personnel who participated in the investigation were trained to ensure the standardisation of investigation methods and evaluation indicators. The standard samples were determined to ensure that the results of the determination of the standard materials were within a given range. The national reference lab of iodine deficiency disorders was responsible for surveillance and guidance of the lab determination quality.
Statistical and data analysis
R language 4.0 was used for data processing and statistical analysis. Because the WIC, UIC and Tvol have skewed distributions, the median was used to describe their concentration trend, and the rank sum test was used to compare them between groups. The prevalence was used to describe the GR. A comparison of the counting data was conducted by the χ 2 test. Correlation between age and Tvol was performed by Spearman rank correlation analysis.
The GAM was used to analyse the influencing factors of Tvol and GR in this study. The median of water iodine concentration (MWIC) of each village was sequenced. When the MWIC is lower than 500 µg/l, every 10 µg/l is a group. Because there were few villages with MWIC greater than 500 µg/l, such areas were combined into a group. Thus, they were divided into fifty-one groups (online Supplementary Table S1 shows the grouping situation). MWIC, median of urinary iodine concentration (MUIC) and the non-iodised salt coverage rate (NISCR) in each group were incorporated into the GAM. Finally, the GAM was verified. The GAM test was mainly used to evaluate the quality of the optimal model by the gam.check function in the mgcv package of the R language.
Results
Sample characteristics
In this study, 54 050 children 6–12 years of age were investigated in areas with high WIC of eight provinces in China, and their Tvol was measured. The overall MWIC was 127·0 µg/l, MUIC was 318 µg/l, NISCR was 63·51 %, the median of thyroid volume (TvolM) in the children was 2·79 ml and the total GR was 3·34 %. The MWIC, MUIC, Tvol and GR in Shanxi province are higher than those of other provinces, which were 225·3 µg/l, 480 µg/l, 3·05 ml and 5·66 %, respectively. Table 1 showed the basic situation in each province.
Table 1. Results of high water iodine areas in different provinces
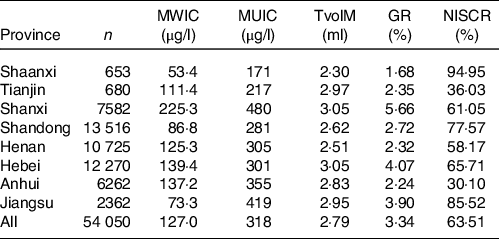
MWI, median of water iodine concentration; MUI, median of urinary iodine concentration; TvolM, median of thyroid volume; GR, goiter rate; NISCR, non-iodised salt coverage rate.
Age and sex are related to thyroid volume and goiter rate
The results showed that Tvol in children increases with age. There was a positive correlation between age and TvolM by Spearman rank correlation analysis (r 0·24, P < 0·001). There were differences in Tvol between the different sexes (P < 0·05), and boys were larger than girls.
In this study, the GR of the 6-year-olds and 7-year-olds were higher, and they were 6·70 and 7·18 %, respectively, both higher than 5 %. The GR of children 8–12 years of age decreases gradually with age. The TvolM and GR among the different ages are shown in Table 2.
Table 2. Results of TvolM and GR of children aged 6–12 years old
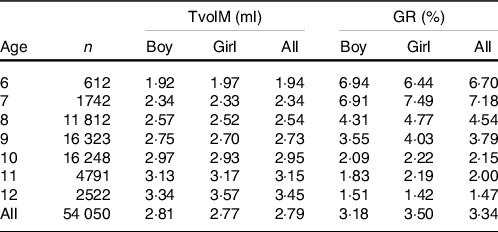
TvolM, median of thyroid volume; GR, goiter rate.
Analysis of factors that influence median of thyroid volume based on the generalised additive model
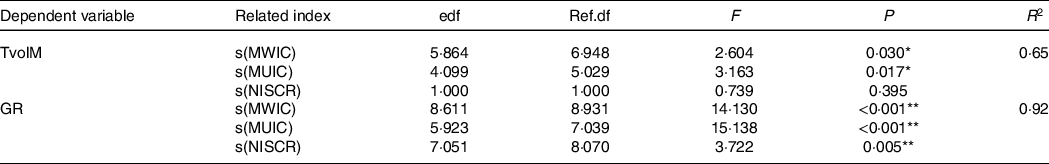
The results of the GAM showed that the effects of the MWIC and MUIC on TvolM were statistically significant, while NISCR had no effect on TvolM.
According to the non-linear effect diagram fitted by the GAM (Fig. 1), when the MWIC was above 120 µg/l, the TvolM continuously increased with increasing MWIC. Until the MWIC was 500 µg/l, TvolM reached a peak. The relationship between MUIC and Tvol presented a complex cubic curve. When the MUIC was more than 800 µg/l, the TvolM was higher. The results are shown in Table 3, and the non-linear effect diagram of the influencing factors of the TvolM is shown in Fig. 1.

Fig. 1. Figure of factors affecting TvolM based on GAM. The non-linear diagram of TvolM and the related index by GAM. When the MWIC was above 120 µg/l, the TvolM continuously increased with increasing MWIC. Until the MWIC was 500 µg/l, TvolM reached a peak. When the MUIC was more than 800 µg/l, the TvolM was higher. The solid line is the model fitting curve, and the broken line is the CI. TvolM, median of thyroid volume; GAM, generalised additive model; MWIC, median of water iodine concentration.
Table 3. Result of factors affecting TvolM and GR based on GAM
MWIC, median of water iodine concentration; MUIC, median of urinary iodine concentration; TvolM, median of thyroid volume; GR, goiter rate; NISCR, non-iodised salt coverage rate; edf, estimated degrees of freedom; Ref.df: Reference degrees of freedom; R 2, coefficient of determination.
GAM was used to analyse the influencing factors of Tvol and GR.
*P < 0·05; **P < 0·01.
The analysis of the influencing factors of TvolM based on the GAM showed that R 2 was 0·65 and the deviance explained rate was 72·7 %, which indicates that the model has a relatively good degree of interpretation.
Analysis of factors that influence the goiter rate based on the generalised additive model
MWIC, MUIC and NISCR were incorporated into the GAM, and under the best degree of freedom, the results of the GAM showed that the effects of MWIC, MUIC and NISCR on the GR were statistically significant (Table 3).
According to the non-linear effect diagram fitted by a GAM (Fig. 2), when the MWIC was less than 420 µg/l, the GR had no significant change. When the MWIC exceeds 420 µg/l, the GR rose rapidly until the MWIC reaches 500 µg/l. There was a cubic curve relationship between MUIC and GR. Initially, with the increase in MUIC, the GR of children presented an increasing trend. When the MUIC reached 450 µg/l, the GR showed a short-term downward trend; when the MUIC exceeded 600 µg/l, the GR increased gradually; especially when the MUIC reached 800 µg/l, the GR was over 5 %. When NISCR reached 40 %, the children’s GR decreased significantly and then showed a wave change. When the NISCR reached more than 85 %, the GR was the lowest. The non-linear effect diagram of the influencing factors of the GR is shown in Fig. 2

Fig. 2. Figure of factors affecting GR based on GAM. The non-linear diagram of GR and the related index by GAM. When the MWIC exceeds 420 µg/l, the GR rises rapidly until the MWIC reaches 500 µg/l. When the MUIC exceeded 600 µg/l, the GR increased gradually; especially when the MUIC reached 800 µg/l, the GR was increased rapidly. When the NISCR reached more than 85 %, the GR was the lowest. The solid line is the model fitting curve, and the broken line is the CI. GR, goiter rate; GAM, generalised additive model; MWIC, median of water iodine concentration.
The analysis of the influencing factors of the GR based on the GAM shows that R 2 was 0·92 and the deviance explained rate was 95·3 %, which indicates that the model has a good degree of interpretation.
Verify the model
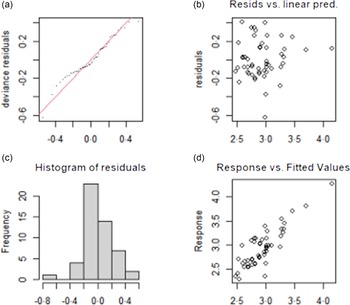
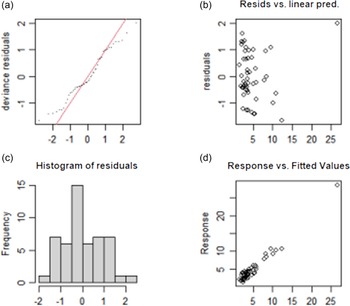
The test results of the fitting model of TvolM and GR are shown in Fig. 3 and Fig. 4, respectively. The residual values (b) are concentrated at approximately 0, which indicates that the model had a good degree of fitting. The observed value and the fitted value (d) are basically all in accordance with the y = x distribution, which indicates that the fitted value of the model has a high degree of matching with the actual observed value. In summary, the fitting effect of the GAM has high reliability.
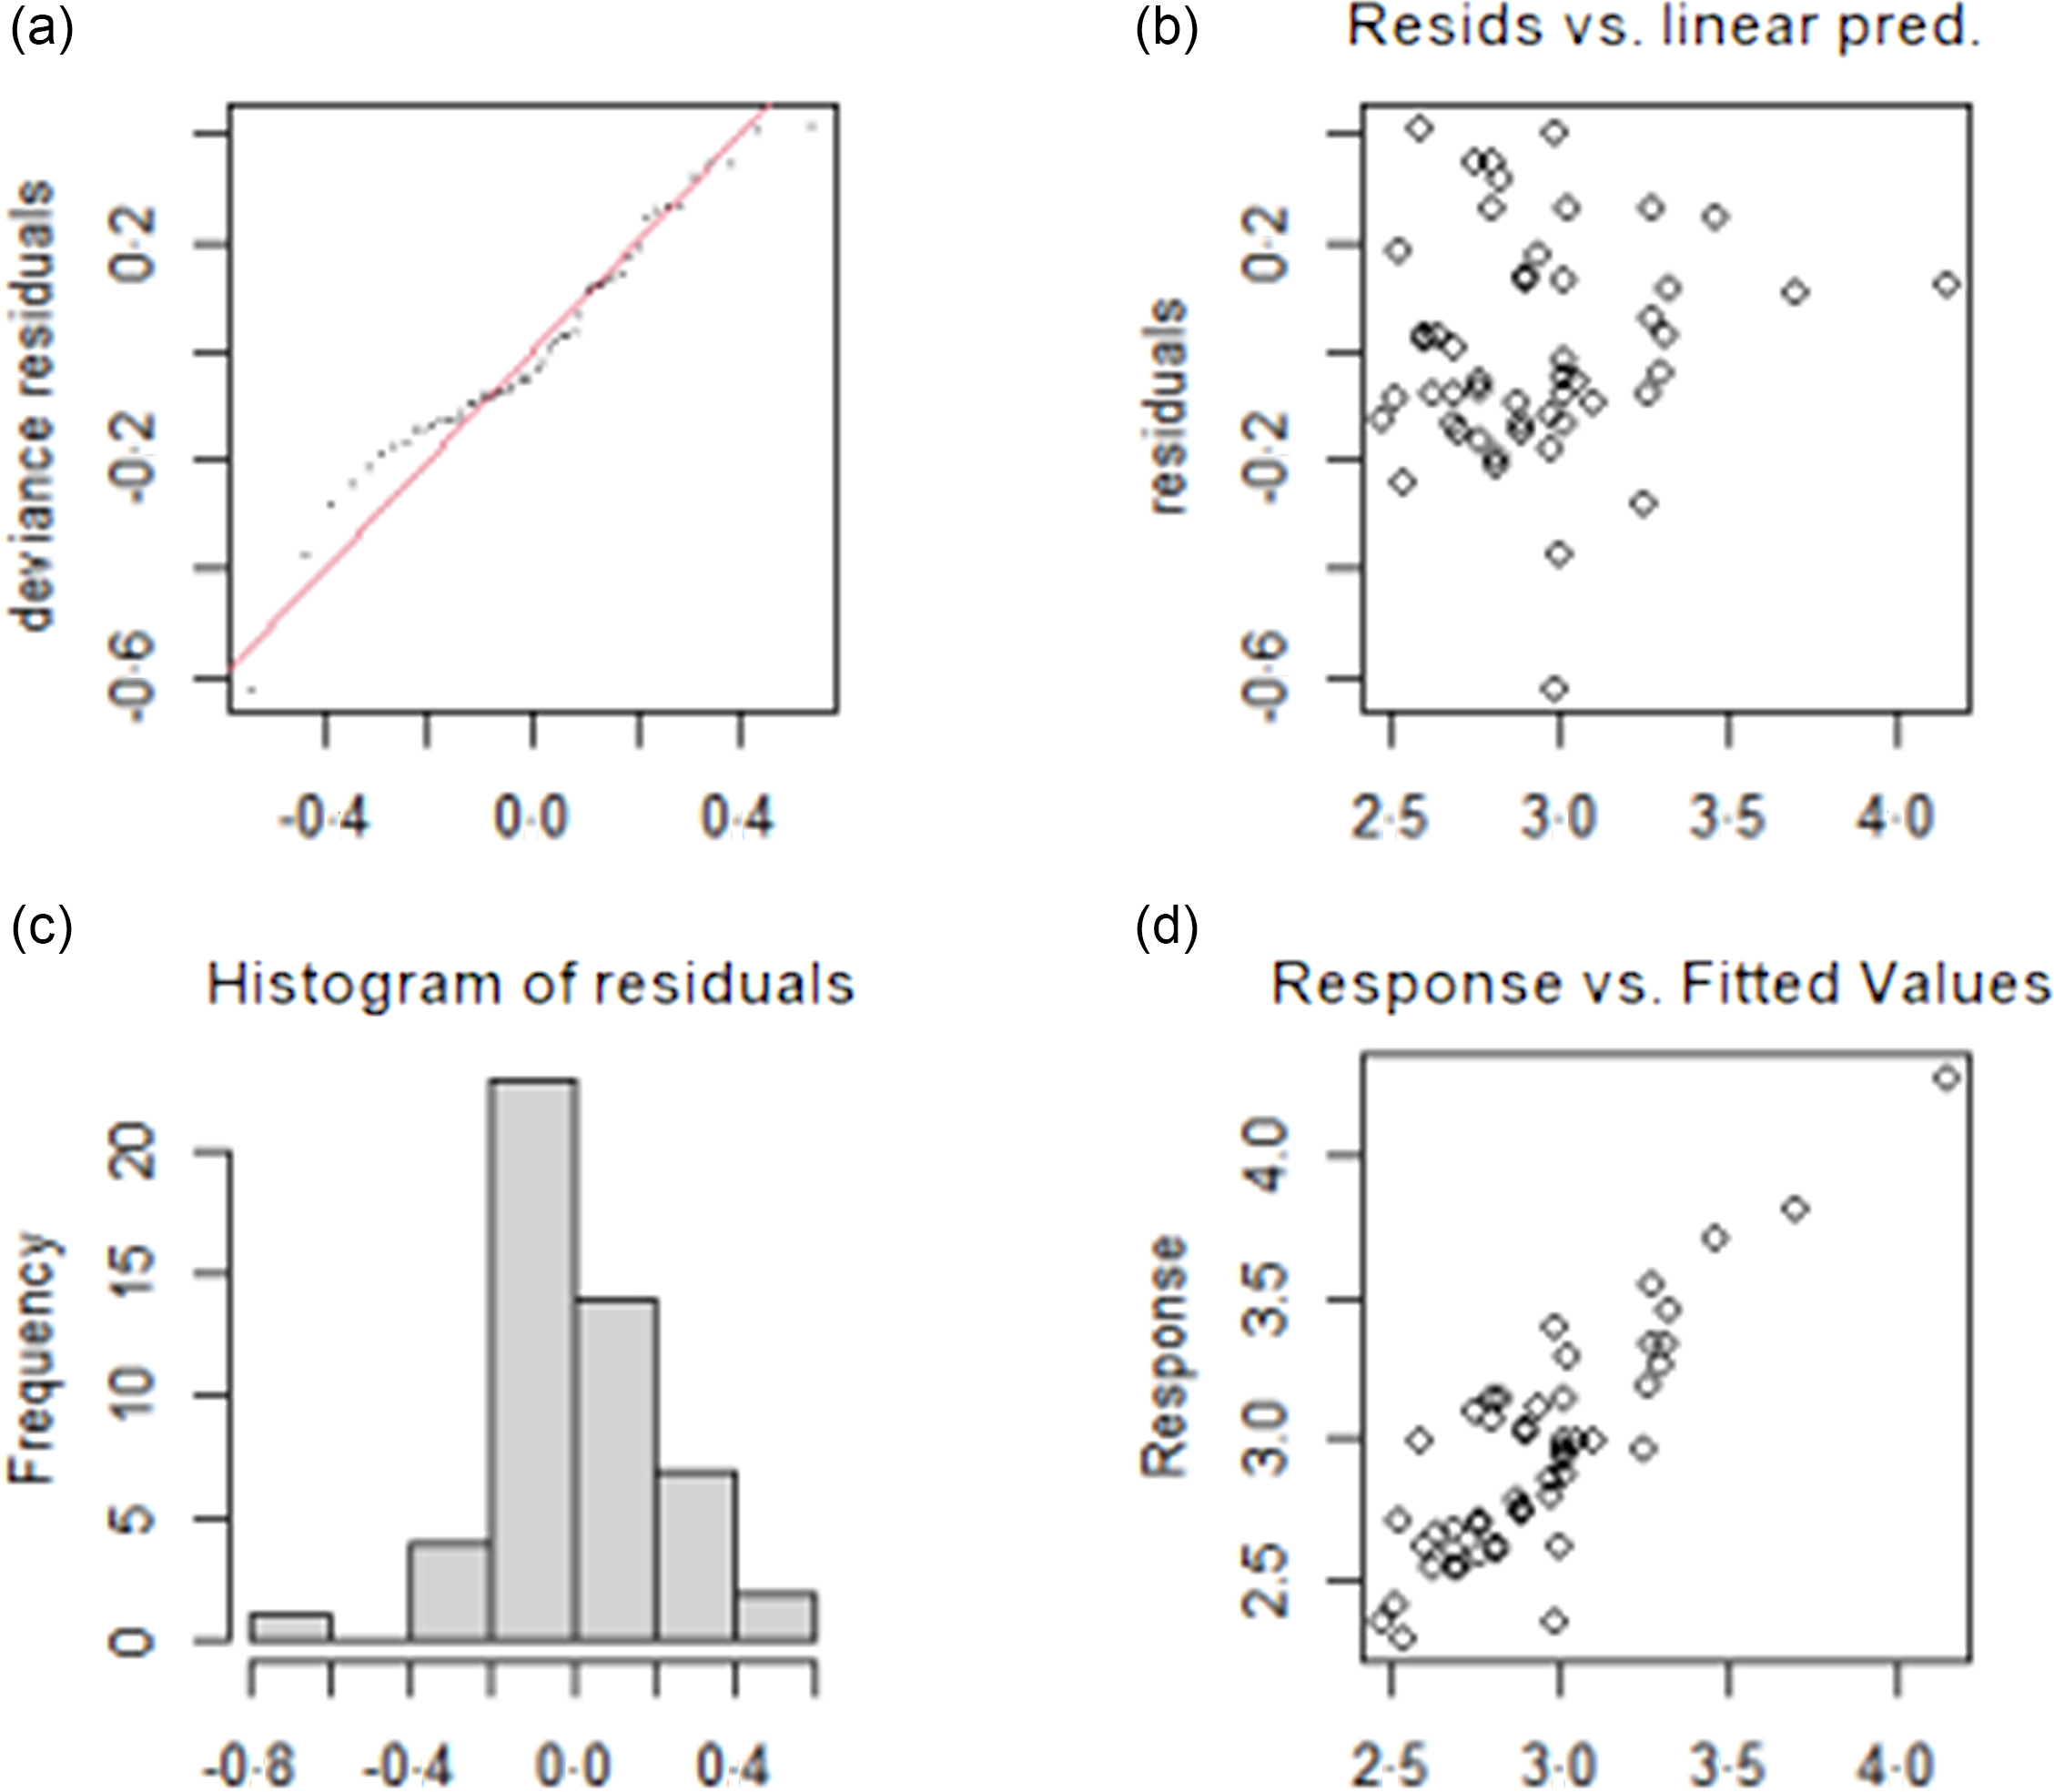
Fig. 3. Test results of fitting model for influencing factors of TvolM. (a) The QQ diagram of residual error, (b) the prediction variables and residuals, (c) the histogram of residual error and (d) the relationship between fitting value and dependent variable. TvolM, median of thyroid volume.
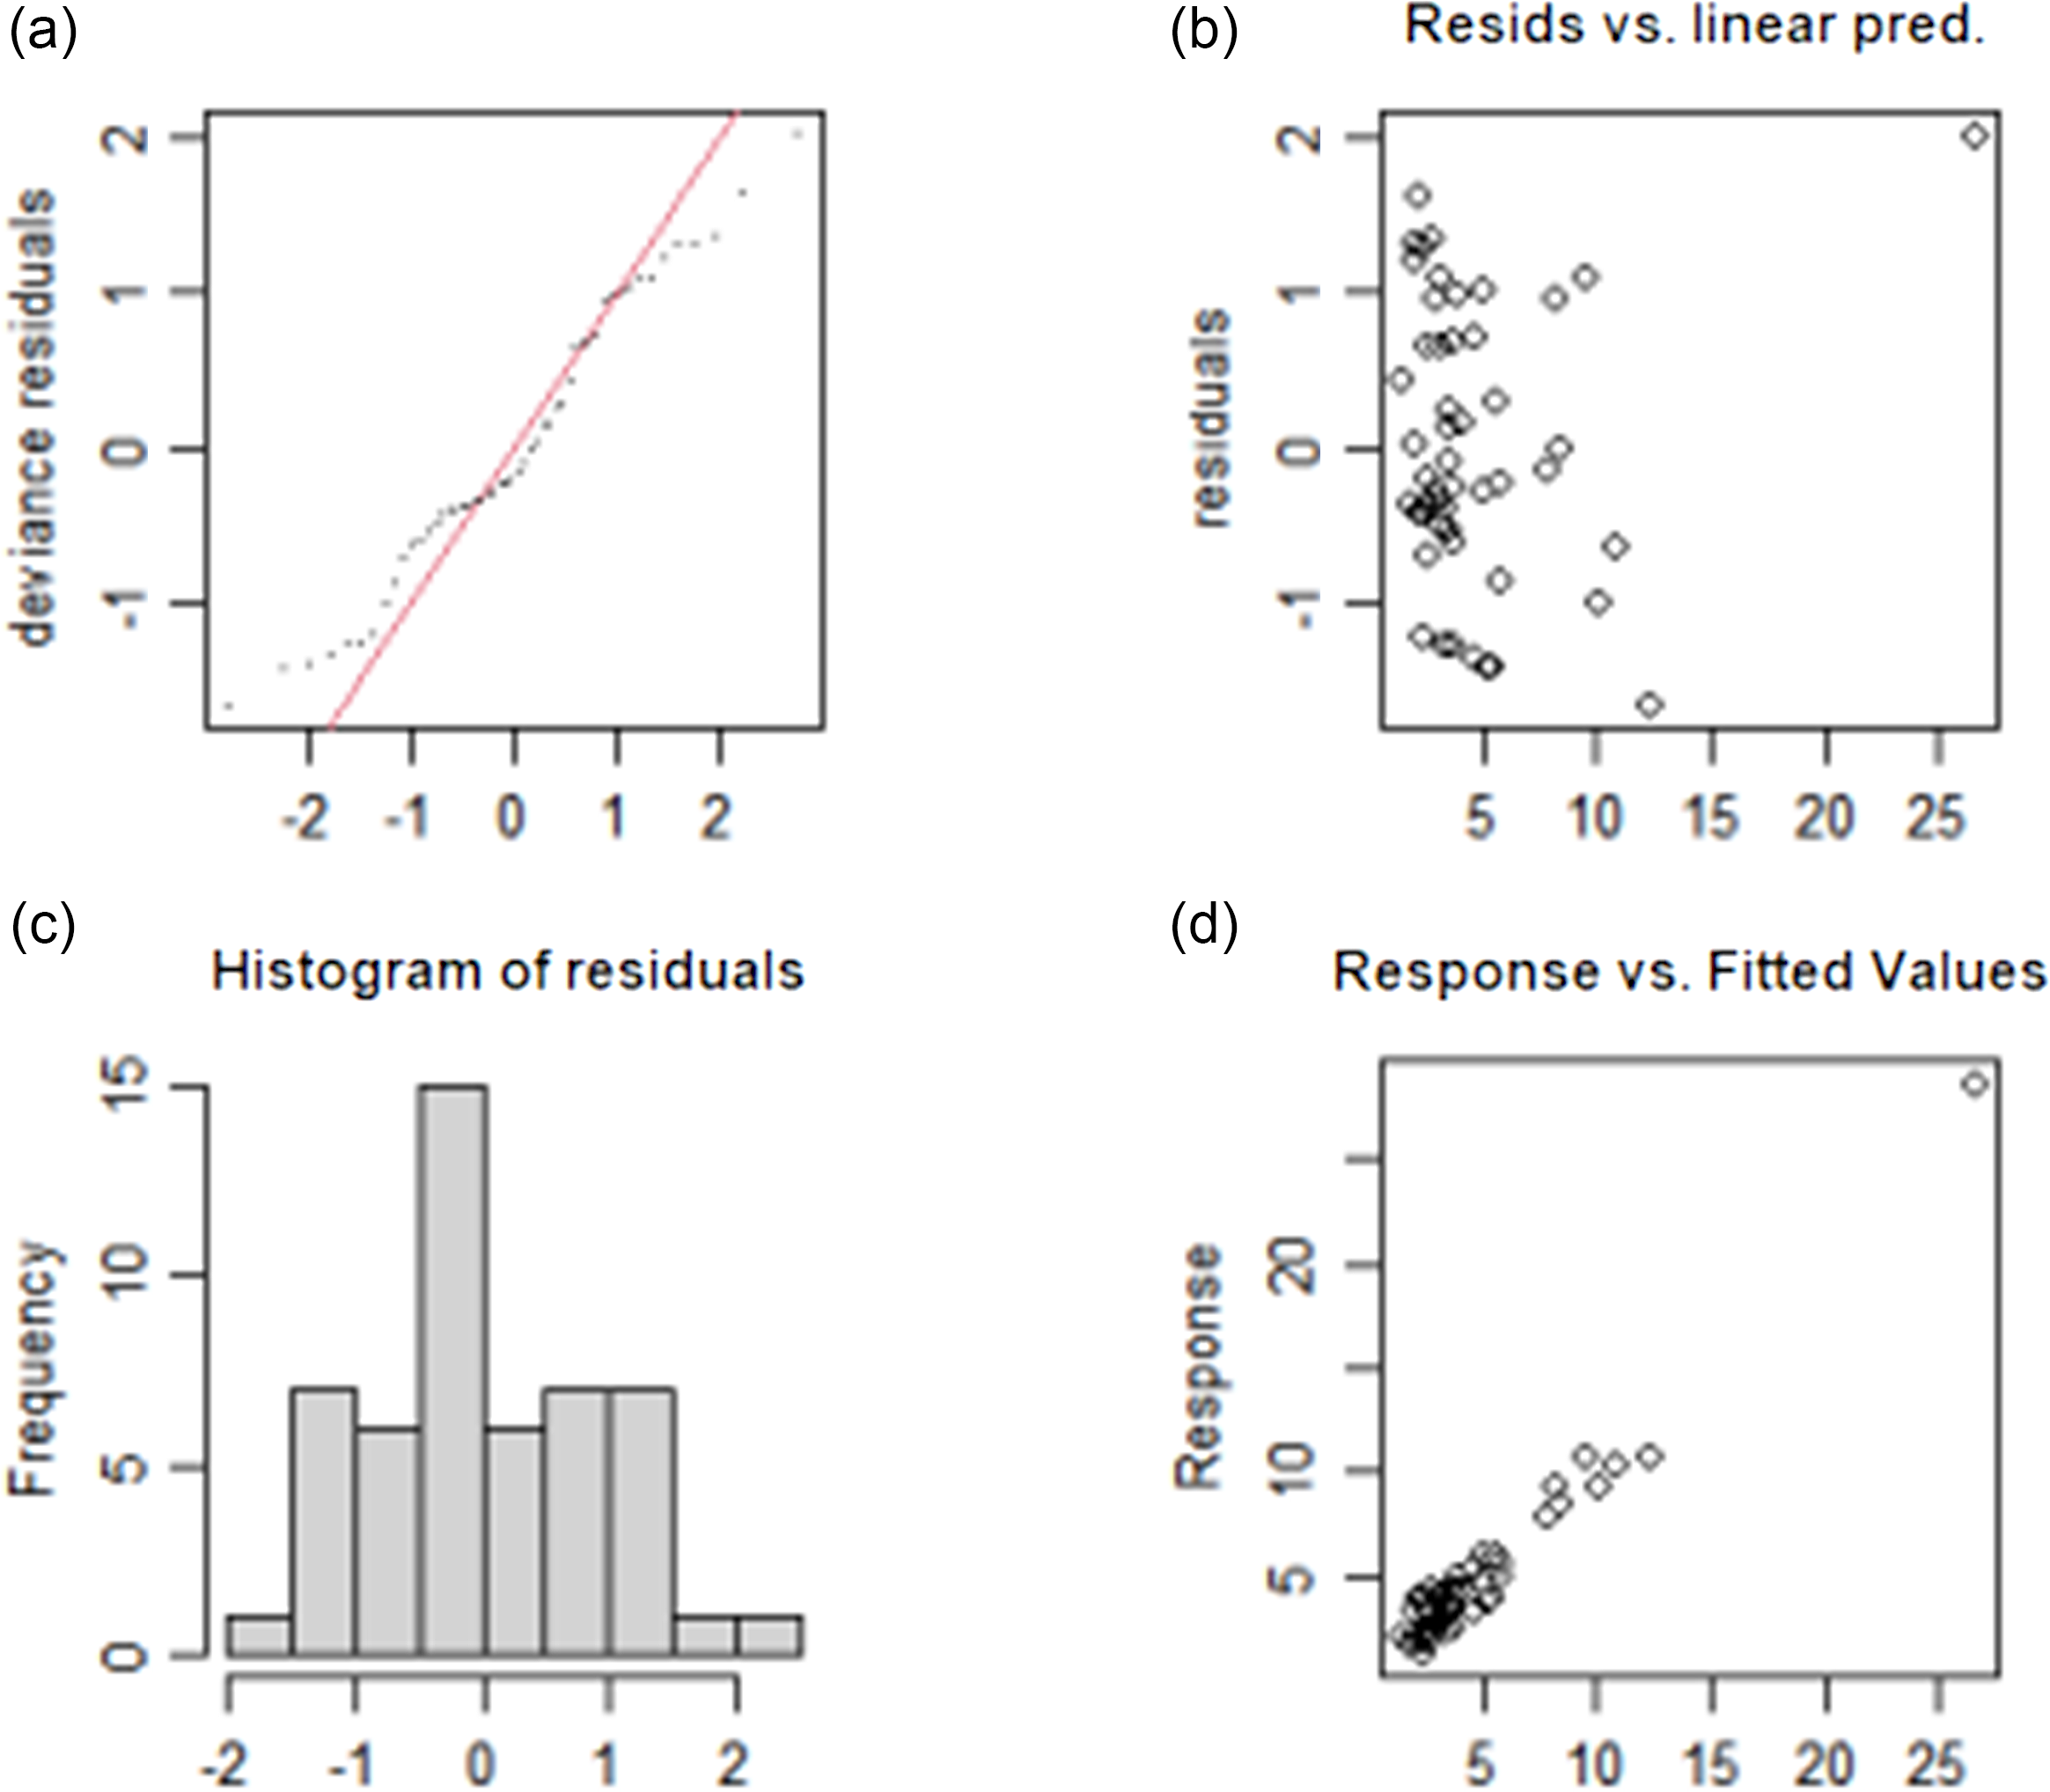
Fig. 4. Test results of fitting model for influencing factors of GR. (a) The QQ diagram of residual error, (b) the prediction variables and residuals, (c) the histogram of residual error and (d) the relationship between fitting value and dependent variable. GR, goiter rate.
Discussion
Fluoride and iodine are located in the same group of the periodic table of elements, and the areas with high WIC are often accompanied by excessive fluorine(Reference Liu, Zeng and Cui23). Because the iodine content standard has not been included in the standards for drinking water quality, water improvement has not been conducted in areas with high WIC, which is mainly performed for water improvement with excessive fluorine. At present, there are still more than 20 000 villages with high WIC in China, which does harm people’s health. In the future, the iodine content standard should be considered to be included in the standards for drinking water quality.
Children’s GR is regarded as an indicator that reflects the long-term iodine nutritional status of the population in iodine deficiency and iodine excess areas, and GR > 5 % is defined as a public health problem(Reference Chen, Li and Wu14). In this study, children’s Tvol and GR in areas with high WIC were evaluated. According to the survey, the overall GR of Chinese children aged 6–12 years was 3·34 %. After stratified analysis, the GR of children in Shanxi Province was the highest among the provinces investigated. The MWIC and MUIC in Shanxi Province were also the highest, which were 225·3 and 480 µg/l, respectively. This finding could be due to the obvious excess iodine nutrition caused by high WIC; therefore, the GR will eventually increase. In some areas of China, water has been improved by drinking groundwater or river water with low iodine content. However, it is difficult to find suitable water sources in some provinces, and the WIC is still high. Long-term drinking of high water iodine will increase the risk of goiter.
This study showed that there was a positive correlation between age and Tvol, which is consistent with previous studies(Reference Kalantari and Moghadam24,Reference Chen, Zhang and Wu25) . In this survey, the GR of 6-year-old and 7-year-old children was more than 5 %, which might be because the younger the children were, the more sensitive they were to the hazard of high iodine. However, the GR showed a downward trend with the increase in age of 8–12 year olds, which might be due to long-term excessive intake of iodine accumulation and thyroid texture hardening; the GR was relatively small(Reference Shang, Zhang and Zhou26).
In this study, the relationship between the GR and MWIC was proven by the GAM, and it could be seen that the non-linear correlation was significant between the GR and WIC. When the MWIC was above 120 µg/l, the TvolM gradually increased. For GR, when the MWIC was more than 420 µg/l, the GR rose rapidly to more than 5 %. Our study found that children’s thyroid is sensitive to excessive iodine, which is consistent with previous studies(Reference Chen, Zhang and Hao27–Reference Shen, Liu and Sun29). Research performed by Li Shunli showed that the MWIC was in the range of 100–500 µg/l, the GR was 4·70 %, the MWIC was greater than 500 µg/l and the GR was more than 5 %, which is similar to our research(Reference Li, Wen and Lu28). Shen’s research in 2005 also showed that the GR was 6·24 % with a WIC of 150–200 µg/l, and then, the GR increased steadily with the increase in the WIC, which was slightly lower than our study, and Shen’s result could be related to the consumption of iodised salt at that time(Reference Shen, Liu and Sun29). At present, most of the areas in our study have stopped supplying iodised salt.
Children’s UIC is considered to be a cost-effective and easy-to-detect indicator when evaluating the iodine nutrition status of a population in a certain area. The WHO defines a region where the MUIC of school-age children is more than 300 µg/l as iodine excess areas(Reference Katagiri, Yuan and Kobayashi30). The results of this research showed that the MUIC and GR presented a complex cubic curve relationship. When the MUIC is above 800 µg/l, the GR exceeded 5 %. In other reports, when UIC reaches 900 µg/l, the GR exceeds 10 %(Reference Zimmermann, Ito and Hess31). When the MUIC reaches a certain level, the children’s GR will increase and even exceed 5 %. At present, the mechanism of high iodine goiter has not been completely clarified(Reference Pearce, Gerber and Gootnick32). Previously published reports have described that excessive iodine intake inhibits the activity of peroxidase (TPO) in vivo. The decrease in peroxidase activity will affect the activation of atomic iodine, tyrosine and the organic process of iodine, which will lead to a decrease in thyroid hormone(Reference Wu, Wang and Liu33). When thyroid hormone decreases, thyroid stimulating hormone increases, which stimulates a diffuse increase in thyroid follicles and eventually leads to goiter(Reference Kanno, Onodera and Furuta34).
According to the GAM results, NISCR has no effect on Tvol but has an effect on GR. When NISCR is more than 85 %, GR is the lowest, and thus, it should be ensured that the NISCR is more than 85 % in excess iodine areas. Children in areas with WIC above 150 µg/l were investigated by Lv Shengmin(Reference Lv, Xu and Zhong35), and the results showed that the GR of children in iodised salt supply areas was 12·1 %, which was significantly higher than the 8·6 % GR of children in non-iodised salt supply areas. Excessive iodine in the external environment will increase the GR of children, and eating iodised salt will further damage children’s thyroids in areas with high WIC. In our study, the supply of iodised salt was not stopped in some villages, resulting in the NISCR being relatively low, which could have an impact on children’s physical and mental health. At present, the supply of non-iodised salt is based on the township level in areas with high WIC of China. In the future, at the village level, it can be considered to stop the supply of iodised salt. At the same time, health education for students, parents and teachers should be strengthened to improve the NISCR.
The advantage of this study is that it is a large-scale epidemiological sampling survey, which covered a wide range, a large number of investigators and has good representation. In addition, some studies have shown that there was no obvious linear relationship between iodine intake and Tvol(Reference Feng36). In this study, the influencing factors of Tvol and GR were analysed by a GAM. This GAM model can use non-linear smoothing terms to fit data without knowing the relationship between the dependent and independent variables in advance. For non-linear correlation, the fitting result is more accurate, which is superior to curve fitting or linear regression in previous studies.
In this study, thyroid ultrasound examination was conducted by many people, and although they were trained, there could be errors among the different examiners. Zimmermann’s research found that the same children’s thyroid was examined by different operators, and the difference in Tvol could be great(Reference Zimmermann, Molinari and Spehl37). Therefore, the detection error of different people could be inevitable.
Conclusions
In areas with high WIC, WIC greater than 420 µg/l could increase the risk of goiter, and the NISCR should be increased to over 85 % to avoid goiters in children.
Acknowledgements
I sincerely thank all the teachers for their guidance on this article. I am very grateful to all the institutions and children who participated in the survey.
This work was supported by the central transfer payment to local government of endemic disease control project.
All authors have contributed to this paper, including on-site investigation, statistical analysis and editing. S. A., L. F., M. L., Z. W., S. L., Y. J., I. L. and Y. D. supervised and carried out the field work. F. M., P. L., S. A., L. F. and M. L. wrote the draft of this paper.
There is no conflict of interest references.
Supplementary material
For supplementary material referred to in this article, please visit https://doi.org/10.1017/S0007114521004529