The Mediterranean Dietary Pattern (MDP) is characterised by a high intake of fruits, vegetables, pulses, nuts, breads and unrefined cereals – such as pasta and rice; olive oil as the principal source of added fat; moderate to high intake of fish, crustaceans and mollusks; moderate intake of dairy products – mostly cheese and yogurt – and eggs; low intake of red meat and moderate intake of wine during meals(Reference Bach-Faig, Berry and Lairon1,Reference Graça2) .
Since 2010, the MDP was classified as an Intangible Culture Heritage of Humanity by the United Nations Educational, Scientific and Cultural Organization’s(3). In addition to this recognition, the MDP is thought to be a healthy eating pattern. It has been related to nutritional adequacy and lower risk of inadequate intake of micronutrients over the entire lifespan(Reference Castro-Quezada, Román-Viñas, Serra-Majem, Preedy and Watson4,Reference Farajian, Zampelas, Preedy and Watson5) ; reduced risk of all-cause mortality, CVD, neurodegenerative diseases, type 2 diabetes and cancer in adults(Reference Dinu, Pagliai and Casini6–Reference Schwingshackl, Schwedhelm and Galbete11); as well as a protective effect for childhood overweight and obesity, which determines a reduction of the risk of developing chronic non-communicable diseases into adulthood(Reference Farajian, Zampelas, Preedy and Watson5,Reference Idelson, Scalfi and Valerio12) . MDP is also considered the most sustainable eating pattern because it results in a lower environmental impact through the consumption of more plant-derived products and fewer animal products(Reference Serra-Majem, Medina, Preedy and Watson13,Reference Serra-Majem, Ortiz-Andrellucchi and Ruan-Rodriguez14) .
Since the 1960s until the first decade of the 21st century, Mediterranean countries, in general, have demonstrated a downward trend in adherence to the MDP – although less pronounced in the last decade – especially in the younger generations(Reference Silva, Bach-Faig and Quintana15–Reference Vilarnau, Stracker and Funtikov19). In alignment to this fact, it is considered that health promotion strategies should prioritise the promotion of the MDP in the general population and more specifically in the first two decades of life(Reference Idelson, Scalfi and Valerio12,Reference Silva, Bach-Faig and Quintana15) .
This health promotion strategies require the study of the overall diet quality, and in such regard, two approaches can be distinguished: the a priori approach – in which scores or indexes are based on guidelines for a healthy diet – and the a posteriori approach – using statistical methods, such as cluster, principal component and exploratory factor analyses are applied to drive dietary patterns that are available in the data – both with specific advantages and limitations(Reference Ocké20–Reference Real, Queiroz and Graça22).
Various a priori approaches, in this case, based on MDP principles were developed to evaluate children and adolescents’ adherence to MDP(Reference Idelson, Scalfi and Valerio12). Nevertheless, the Mediterranean Diet Quality Index (KIDMED Index) – an Index based on MDP principles consisting of sixteen closed-ended questions, with the associated total score ranging from −4 to 12(Reference Serra-Majem, Barba, Cruz, Serra-Majem and Bartrina23) – has been the most used one(Reference Idelson, Scalfi and Valerio12). The KIDMED Index was developed and validated by Serra Majem et al. in 2004, to assess the eating habits of 3850 Spanish children and adolescents, aged between 2 and 24 years, as part of the EnKid study(Reference Serra-Majem, Barba, Cruz, Serra-Majem and Bartrina23).
In some situations, instead of developing new instruments, it is possible to adapt those that already exist for other populations(Reference Sousa and Rojjanasrirat24). The practical value of a questionnaire depends on its reproducibility – how well data collected can be reproduced – and validity – how well it measures what it is intended to measure. However, once a questionnaire is reproducible and valid in one population, it cannot be assumed that this is the case in all populations(Reference Meadows25).
There are a few studies investigating psychometric properties of the KIDMED Index. After its development, the reproducibility of this index was recently tested in Croatia(Reference Štefan, Prosoli and Juranko26), Colombia(Reference Carrillo and Vélez27) and Brazil(Reference Simon, Forte and Marostica28) and its validity by the HELENA study in nine European countries, namely, Austria, Belgium, France, Germany, Greece, Italy, Hungary, Spain and Sweden(Reference Aparicio-Ugarriza, Cuenca-García and Gonzalez-Gross29). In the Croatian, Colombian and Brazilian studies, it was proven that the KIDMED Index is a reliable instrument for assessing adherence to the MDP, and in the HELENA study, the KIDMED Index was considered one of the most appropriate and valid MDP scores for European adolescents.
To the best of the author’s knowledge, based on an extensive literature review, there has been no study investigating psychometric properties of the KIDMED Index in Portugal. Thus, the main purpose of the present study was to investigate the reproducibility and the validity of the KIDMED Index in a sample of Portuguese adolescents.
Methodology
Ethical procedures
This research project was conducted according to the guidelines laid down in the Declaration of Helsinki, and all procedures involving human subjects were approved by the Ethics Committee from the Institute of Public Health of the University of Porto. Moreover, written authorisation was requested from the Portuguese Government’s Education General-Direction – through their Scholar Inquiries Monitorization system, with the registration number 0702600001 – and from both School Groups directors. Written informed consents from the adolescent’s tutors, as well as authorisation from the adolescents themselves, were obtained to rightfully proceed on gathering data. The data were then anonymised – a numerical code, which only the main researcher had access to, was given to each participant and was destroyed after gathering the data – and treated with confidentiality, and all computerised information was kept in a computer, safeguarded by a password and all paper information in a closed cabinet, located at a secure office. The participants had the right to leave the investigation at any given time, without any need for further explanation.
Study sample
Among all the fourteen public school groups from a city located in the northern district of Portugal, selected for convenience of access, only five possessed classes from the 5th to the 12th school years. Thus, two school groups were chosen to conduct the investigation, the westernmost and easternmost, in order to obtain the most heterogeneous sample possible. The student’s classes were randomly selected (two different classes per each school year in a total of sixteen different classes per each school group), and all students from the same class (averaging twenty-seven students per class) were eligible for participating in the investigation.
Formal consent requests were sent for 860 students, in order to obtain parents’ authorisation for at least 240 – participation rate of 27·9 %. The students who presented formal consent but did not meet the selection criteria – (i) adolescents who have not the Portuguese nationality, due to any eventual deficit on comprehending and expressing themselves in the Portuguese language; (ii) adolescents who required special educative needs and, therefore, were unable to fill the KIDMED Index and the 3-d Dietary-Record (DR) autonomously; (iii) adolescents with specific diets (such as vegetarianism) or with diets conditioned by the presence of diseases (such as coeliac disease or allergy to cows’ milk protein), as they reflect different eating patterns from MDP, which is the object of evaluation of the KIDMED Index – were excluded at the end of the data collection phase. The final sample comprised 185 adolescents, aged between 10 and 19 years.
Throughout the school season, between January and March 2020, during the early phase of the investigation, the 3-d DR were delivered as to be filled by each of the participants. After the 3-d DR were submitted, the KIDMED Index (Portuguese version – Annex A) was directly applied (self-administration) and, 2 weeks later, it was reapplied (Fig. 1).
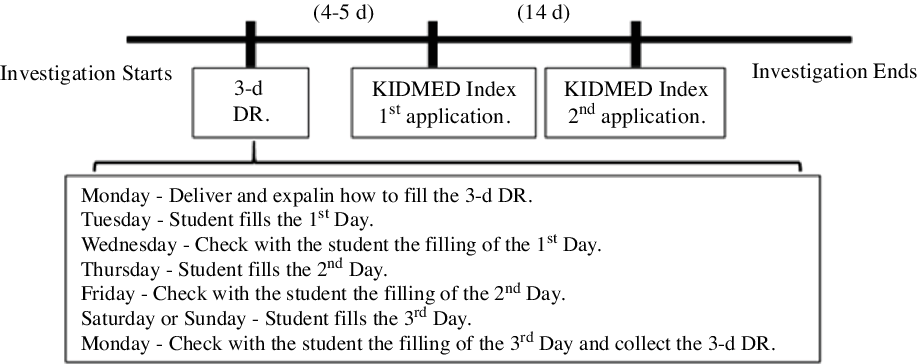
Fig. 1. Data gathering timeline. KIDMED Index, Mediterranean Diet Quality Index; DR, Dietary-Record.
In order to undertake this investigation, personal data were simultaneously gathered, such as sex, age, the participants’ scholar degree, both parents’ scholar degree, the total household monthly income and their aggregate composition.
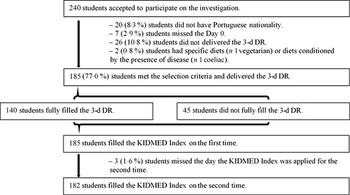
From the 240 students who accepted to participate on the investigation, 185 students met the selection criteria and delivered the 3-d DR, but only 140 fully filled the 3-d DR – answer rate of 75·7 %. All 185 students who met the selection criteria and delivered the 3-d DR filled the KIDMED Index on the first time – answer rate of 100 % – and 182 students filled the KIDMED Index on the second time – answer rate of 98·4 % (Fig. 2).
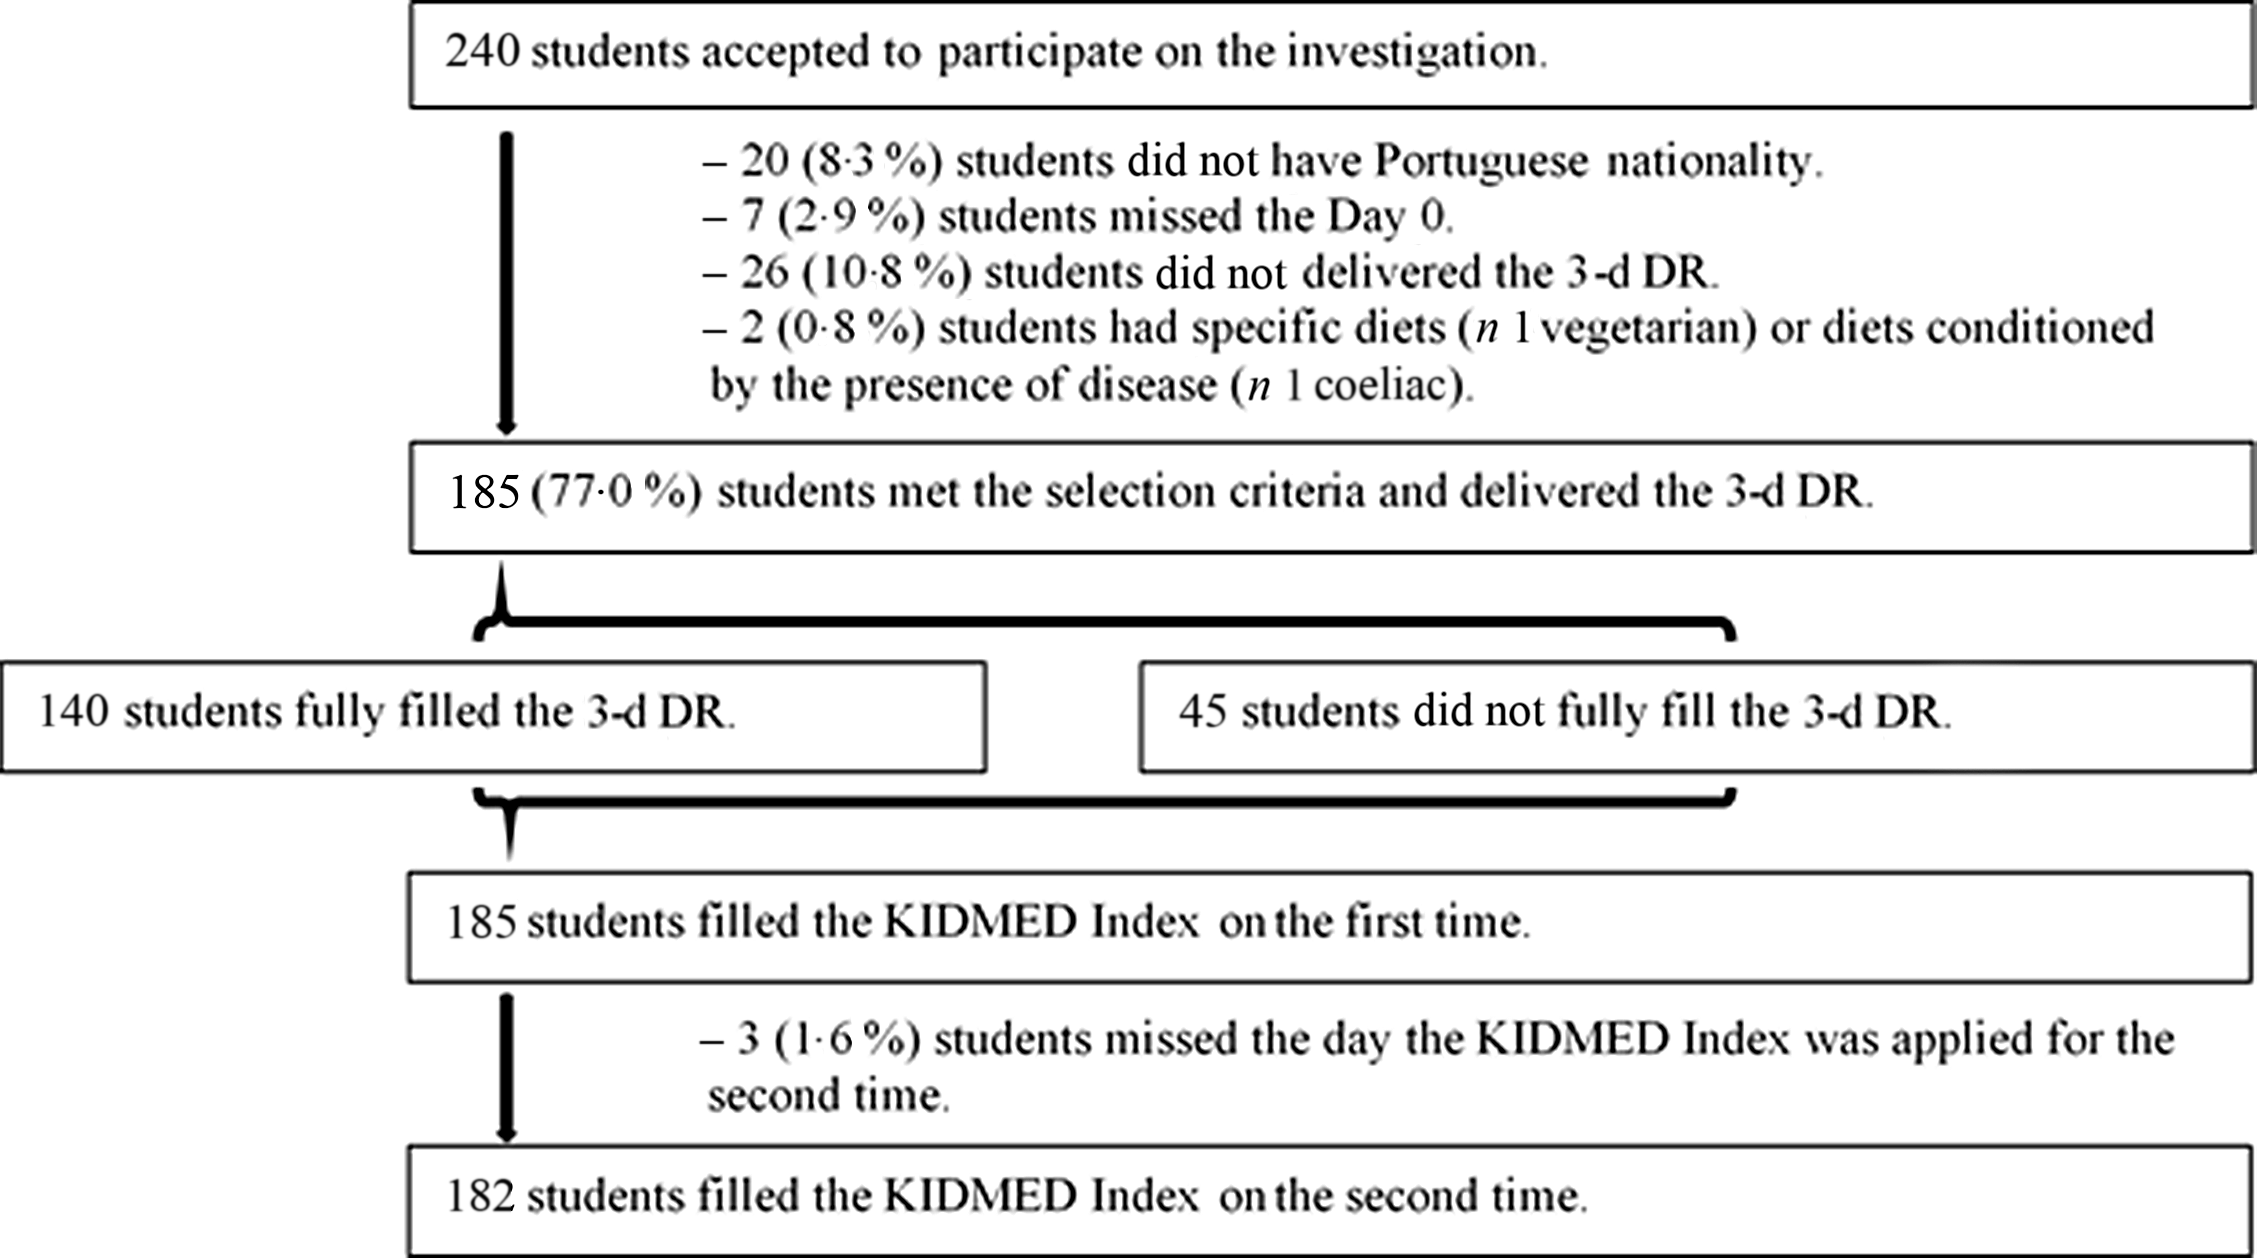
Fig. 2. Participation flow chart. KIDMED Index, Mediterranean Diet Quality Index; DR, Dietary-Record.
Dietary assessment methods
Mediterranean Diet Quality Index – KIDMED Index
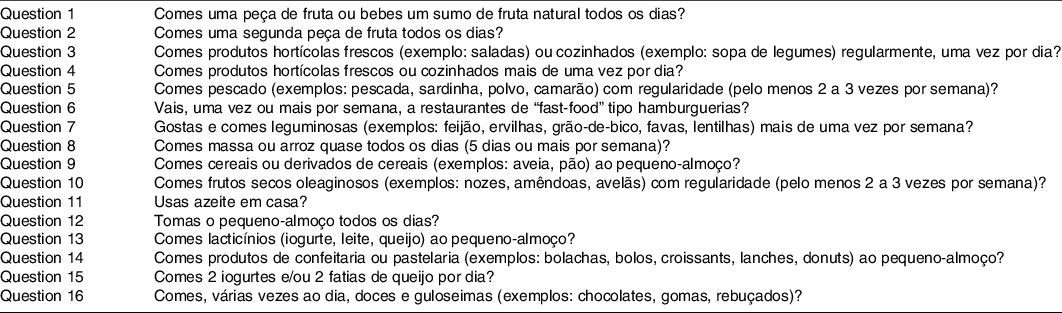
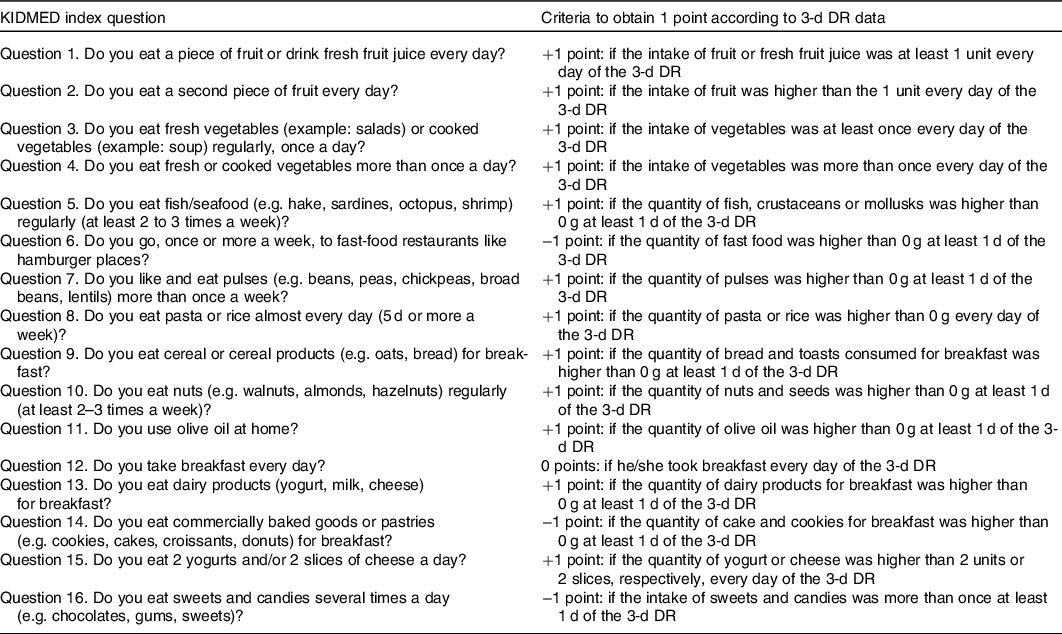
The KIDMED Index evaluates children and adolescents’ adherence to MDP. The Portuguese version of this instrument was previously developed by the authors, through the translation and cross-cultural adaptation of the original Spanish version(Reference Serra-Majem, Barba, Cruz, Serra-Majem and Bartrina23) (data not shown). The index includes sixteen yes-or-no questions evaluating food intake that can be self-administered or conducted via an interview(Reference Serra-Majem, Barba, Cruz, Serra-Majem and Bartrina23). A positive answer to questions with a negative connotation with MDP adherence (n 4) are scored −1 point, while questions with a positive connotation (n 12) are scored +1 point. The associated total score ranges from −4 to 12, allowing the classification of the adherence to the MDP as low (≤3 points), moderate (4–7 points) and high (≥8 points)(Reference Serra-Majem, Barba, Cruz, Serra-Majem and Bartrina23).
Dietary records
The DR are open-ended, self-administered questionnaires (or filled by someone else in the case of children or people with trouble on recording the food and beverages consumed) that require a minimum of 3 d (two weekdays and one weekend day) for subjects to record all food and beverages consumed over this period, at the time the food and beverages are eaten(Reference Ortega, Pérez-Rodrigo and López-Sobaler30). The consumed items can be measured using a kitchen weighing scale or can be estimated using a portion-size guide (e.g. three-dimensional food models, two-dimensional aids such as photographs) or in reference to standard household measures (e.g. spoons, cups, bowls)(Reference Ortega, Pérez-Rodrigo and López-Sobaler30). In this study, the consumed items were measured using a kitchen weighing scale or estimated with the help of images of standard household measures(Reference Goios, Martins and Oliveira31).
Trained staff provided instructions on how to record consumption, and the fully filled DR answers were entered into the Eat24 Software programme(Reference Lopes, Torres and Oliveira32) – a programme based on information from the Portuguese Food Composition Table(33) – for analysis. Data regarding food and beverages intake obtained by the 3-d DR were grouped and recodify according to each item of the KIDMED Index (Table 1).
Table 1. Mediterranean Diet Quality Index (KIDMED Index) questions and criteria obtained from 3-d dietary record (DR) data
In order to summarise the information of the DR groups of food and beverages (g/d), obtained with the Eat24 Software, it additionally calculated the Mediterranean Adequacy Index (MAI)(Reference Alberti-Fidanza, Fidanza and Chiuchiù34) for each participant, according to the following equation:
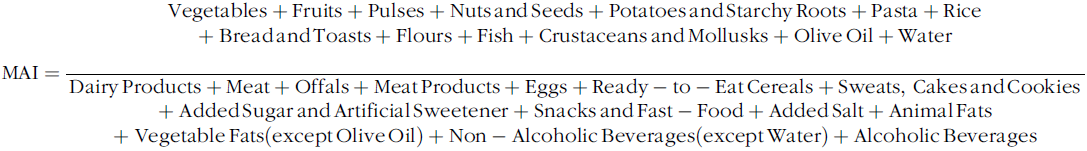 $${\rm{MAI}} = {{\matrix{ {{\rm{Vegetables}} + {\rm{Fruits}} + {\rm{Pulses}} + {\rm{Nuts}}\,{\rm{and}}\,{\rm{Seeds}} + {\rm{Potatoes}}\,{\rm{and}}\,{\rm{Starchy}}\,{\rm{Roots}} + {\rm{Pasta}} + {\rm{Rice}}}\cr{ +\; {\rm{Bread}}\,{\rm{and}}\,{\rm{Toasts}} + {\rm{Flours}} + {\rm{Fish}} + {\rm{Crustaceans}}\,{\rm{and}}\,{\rm{Mollusks}} + {\rm{Olive}}\,{\rm{Oil}} + {\rm{Water}}}\cr{}\cr} } \over {\matrix{ {{\rm{Dairy}}\,{\rm{Products}} + {\rm{Meat}} + {\rm{Offals}} + {\rm{Meat}}\,{\rm{Products}} + {\rm{Eggs}} + {\rm{Ready}} - {\rm{to}} - {\rm{Eat}}\,{\rm{Cereals}} + {\rm{Sweats}},\,{\rm{Cakes}}\,{\rm{and}}\,{\rm{Cookies}}}\cr{ +\; {\rm{Added}}\,{\rm{Sugar}}\,{\rm{and}}\,{\rm{Artificial}}\,{\rm{Sweetener}} + {\rm{Snacks}}\,{\rm{and}}\,{\rm{Fast}} - {\rm{Food}} + {\rm{Added}}\,{\rm{Salt}} + {\rm{Animal}}\,{\rm{Fats}}}\cr{ + \;{\rm{Vegetable}}\,{\rm{Fats}}({\rm{except}}\,{\rm{Olive}}\,{\rm{Oil}}) + {\rm{Non}} - {\rm{Alcoholic}}\,{\rm{Beverages}}({\rm{except}}\,{\rm{Water}}) + {\rm{Alcoholic}}\,{\rm{Beverages}}}\cr} }}$$
Because MAI values were calculated for adolescents, an adaptation to the original MAI was introduced, consisting in the inclusion of all alcoholic beverages (even wine, a drink whose moderate consumption is promoted in MDP) into the denominator of the fraction.
Statistical analysis
Statistical analysis was performed using Software Package for Social Sciences for Windows version 25.0 and the R programme, version R 4.0.0 with vcd package for calculating the Kappa values and the respective 95 % CI. Differences were considered statistically significant when P-value < 0·05.
For a power of 85 % and an α of 5 %, to obtain a significant Kappa of 0·2, the necessary number of 183 participants was calculated. The descriptive statistics analysis was performed, and the normality of the variables under study was analysed by the Kolmogorov–Smirnov test to apply the most appropriate statistical tests. Mann–Whitney U test and χ2 test, respectively for continuous and categorical variables, were used to compare the baseline characteristics of the participants who fully filled the 3-d DR with the characteristics of those who did not fully fill it.
The reproducibility of this index was tested by comparing the application of the KIDMED Index at two different times (2-week interval) to each of the participants. To determine the differences between the two applications, McNemar test was used and, to assess reliability, Kappa statistics and intraclass correlation coefficient (ICC) were used(Reference Sim and Wright35,Reference Fleiss and Cohen36) . Kappa values range between −1 (perfect disagreement) and +1 (perfect agreement), and the strength of agreement for the kappa coefficient were classified as poor (≤0), slight (0·01–0·20), fair (0·21–0·40), moderate (0·41–0·60), good (0·61–0·80) or excellent (0·81–1)(Reference Landis and Koch37).
The validity of this index was explored by comparing the results obtained by the KIDMED Index and by the average of the 3-d DR of each participant. To evaluate the correlation between the two methods, Spearman’s correlation coefficient (ρ) was used – strength of the correlation very weak if |ρ| < 0·2, weak if 0·2 ≤ |ρ| < 0·4, moderated if 0·4 ≤ |ρ| < 0·6, strong if 0·6 ≤ |ρ| < 0·8 or very strong if 0·8 ≤ |ρ| ≤ 1(Reference Spearman38) – and to access the agreement in categories between the two methods, Kappa statistics was used. Additionally, de-attenuated Pearson’s correlation coefficients were calculated to remove within-person variance (i.e. day-to-day variation)(Reference Trafimow39).
Results
Sample characterisation
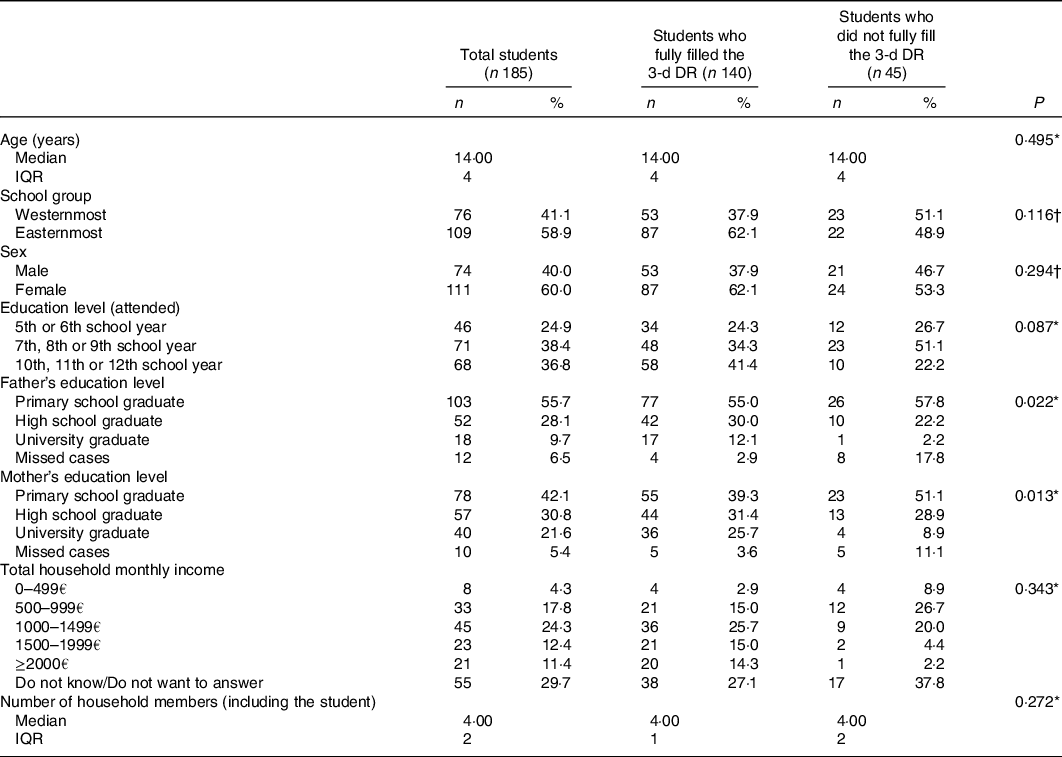
Table 2 shows that the 185 participants were aged between 10 and 19 years, were mostly female (60 %) and 58·9 % belonged to the easternmost school group. Exactly 24·9 % were in the 5th or 6th school years, 38·4 % were in the 7th, 8th or 9th school years and 36·8 % were in the 10th, 11th or 12th school years.
Table 2. Sample characteristics
(Median values and interquartile ranges (IQR); numbers and percentages)
* Mann–Whitney U test.
† χ 2 test.
Regarding the socio-economic context of the adolescents, it can be inferred, through the parent’s education, that they belonged to a medium-low socio-economic level, since only 9·7 % and 21·6 % of fathers and mothers, respectively, were university graduate. It can also be inferred, dividing by 4·03 (average number of household members) the minimum and maximum limit of the range corresponding to the most selected total household monthly income (with the exception of the option ‘Don’t know/Don’t want to answer’). Through this numerical calculation, we obtained a range between €248·14 and €371·96 per person per month. These values are lower than €438·81, that corresponds to the Social Support Index of 2020 (the ‘Indexante dos Apoios Sociais’ in Portugal), under the terms of ‘Portaria n.º 27/2020’, of 31 January.
Students who did not fully fill the 3-d DR showed statistically significant differences only in relation to the Father’s Education Level (P-value = 0·022) and the Mother’s Education Level (P-value = 0·013), which were lower when compared with students who fully filled the 3-d DR.
Reproducibility study
Table 3 shows that from the total of sixteen questions, only three presented significant differences between the two applications of the KIDMED Index: question 5, where 7·7 % less of the participants reported having regular fish, crustaceans and mollusks consumption on the second application (P-value = 0·024); question 14, where 7·2 % less of the participants referred having commercially baked goods or pastries for breakfast on the second application (P-value = 0·047) and question 16, where 8·8 % less of the participants mentioned taking sweets and candies several times a day on the second application (P-value = 0·007).
Table 3. Differences and agreement of the Mediterranean Diet Quality Index (KIDMED Index) questions between applications
(Mean values and standard deviation; Numbers and percentages, n 182)
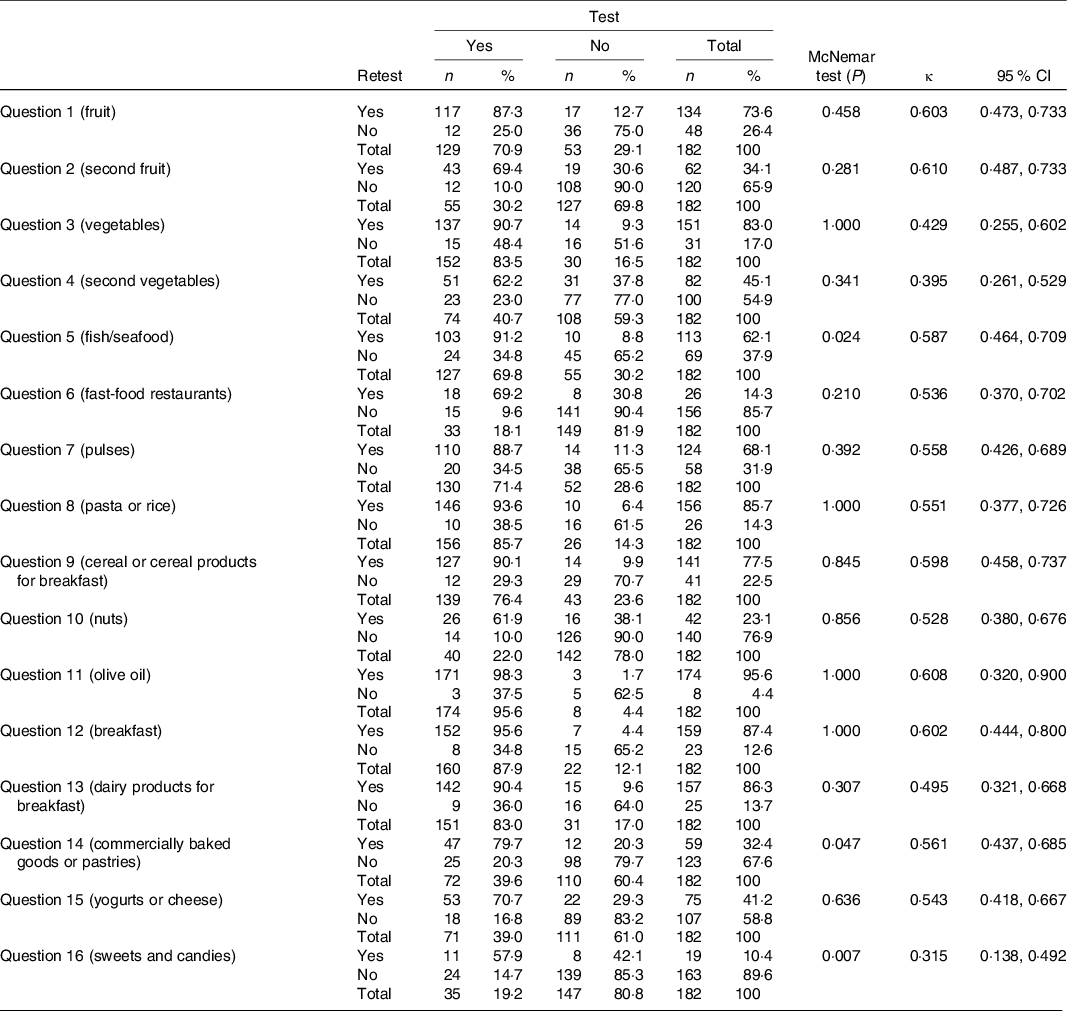
At least 70·3 % of participants answered all questions in total agreement, and Cohen’s Kappa values showed moderate agreement in almost every question (ranging between 0·429 and 0·608). Question 4, related to the consumption of fresh or cooked vegetables more than once a day, and question 16, about taking sweets and candies several times a day, revealed fair agreement (κ = 0·395 and κ = 0·315, respectively) and questions 1 and 2, both related to the daily consumption of fruits, demonstrated good agreement (κ = 0·603 and κ = 0·610, respectively).
Table 5 displays that globally there was no significant change (P-value = 0·201) and moderate agreement (κ w = 0·591, 95 % CI 0·485, 0·696) in the KIDMED Index classification, between the first and the second application. No participants were classified in opposite categories of MD adherence, and 73·6 % of participants were correctly classified as Low, Moderate or High by the two applications of the KIDMED Index.
Furthermore, the ICC – calculated for the KIDMED Index total scores – was 0·759 (95 % CI 0·690, 0·815), revealing excellent reproducibility (ICC above 0·75).
Validity study
Table 4 shows slight to moderate agreement (ranging between 0·109 and 0·445) between the KIDMED Index and the 3-d DR for eleven questions. For question 5, regarding regular fish, crustaceans and mollusks consumption, question 9, about eating cereal or cereal products for breakfast, question 10, concerning regular nuts consumption, and question 16, about taking sweets and candies several times a day, the agreement was not significantly better than what would be expected by chance (P-value ≥0·05), and for question 11, about olive oil consumption, there was no agreement between the two methods.
Table 4. Agreement between the Mediterranean Diet Quality Index (KIDMED Index) questions and 3-d dietary record criteria
(Numbers and percentages, n 140)
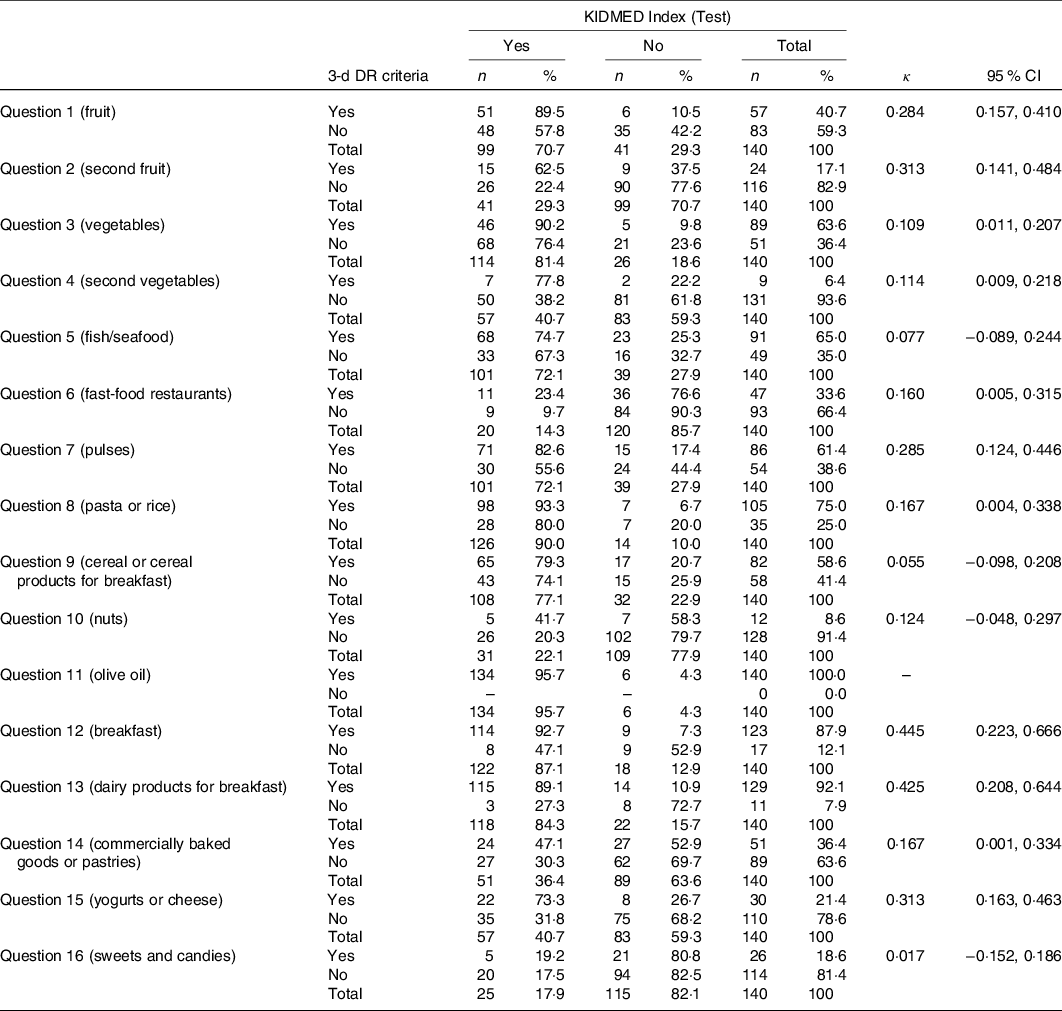
Table 5 reveals weak correlation (ρ = 0·317; P-value <0·001) and slight agreement (κ w = 0·167, 95 % CI 0·071, 0·262) between the KIDMED Index classification and the 3-d DR-derived KIDMED score. Almost 50 % of participants were classified into the same category of MDP adherence.
Table 5. Differences and agreement of the Mediterranean Diet Quality Index (KIDMED Index) classification between applications (n 182) and correlation and agreement between the KIDMED Index classification and the 3-d dietary record (DR)-derived KIDMED score and the Mediterranean Adequacy Index score
(Numbers and percentages, n 140)
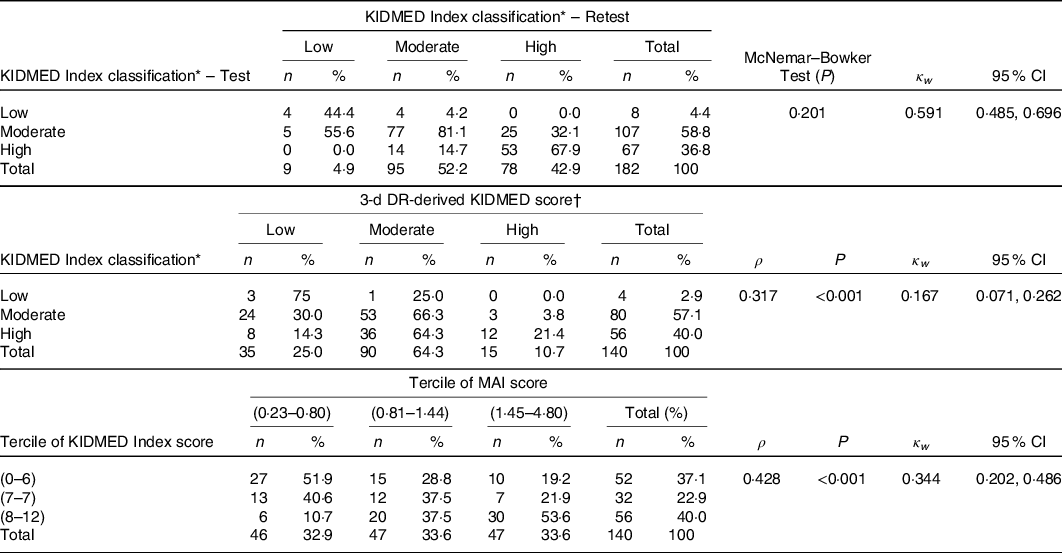
MAI, Mediterranean Adequacy Index.
* Low adherence to the MDP (≤3 points); moderate adherence to the MDP (4–7 points); high adherence to the MDP (≥8 points).
† Low adherence to the MDP (≤3 points); moderate adherence to the MDP (4–7 points); high adherence to the MDP (≥8 points) according to the 3-d DR-derived KIDMED score.
Table 5 also reveals moderate correlation (ρ = 0·423; P-value <0·001) and fair agreement (κ w = 0·344, 95 % CI 0·202, 0·486) between the terciles of the KIDMED Index score and the MAI score. Almost 50 % of participants were classified into the same terciles of scores, while 11·43 % were misclassified into the opposite terciles of scores by the two methods.
Pearson’s correlation coefficient between the KIDMED Index total score and the 3-d DR-derived KIDMED score was 0·388 (P-value <0·001) and between the KIDMED Index total score and the MAI score was 0·333 (P-value <0·001). After de-attenuation of data, Pearson’s correlation coefficients were 0·625 and 0·661, respectively, revealing strong correlations.
Discussion
In the present study, the Portuguese version of the KIDMED Index revealed as an appropriate, reliable and valid instrument for assessing adherence to the MDP among adolescents, in alignment with the few studies investigating psychometric properties of this index in other countries.
Reproducibility studies
The differences and the agreement between the test and retest were analysed for each question and for the KIDMED Index score. For questions 5, 14 and 16 of the KIDMED Index, the responses were in agreement, but showed significant differences between the two applications. In questions 5, 14 and 16, respectively, 7·7 %, 7·2 % and 8·8 % of the adolescents changed their answer from YES (test) to NO (retest).
A 2-week period between the two applications of the KIDMED Index does not seem to be a considerable time to observe major changes in the eating habits of adolescents – especially without any intervention in order to change them – so these three questions did not reveal data collection precision. However, the remaining thirteen questions (81·25 % of the questions) and the KIDMED Index score showed no significant differences (P-value ≥ 0·05) between the two applications, and a moderate agreement was revealed in almost every question and in the final score (κ w = 0·591, 95 % CI 0·485, 0·696), suggesting acceptable reproducibility of the Portuguese version of the KIDMED Index when repeated over a 2-week interval.
Our results are in alignment with previous studies. In the Croatian study(Reference Štefan, Prosoli and Juranko26), which included university students (19·70 (sd 1·32) years), there were no significant changes in question responses between the first and second occasion (after a 2-week period), with the exception of question 8, regarding the consumption of pasta or rice almost daily; and kappa statistics showed moderate to excellent agreement in each question and moderate agreement (κ = 0·597; P-value <0·001) in the KIDMED Index score. In the Colombian study(Reference Carrillo and Vélez27), which included schoolchildren from a private institution (12·9 (sd 3·1) years), there were significant changes in question responses, between the first and second application (after 7 d), in questions 1 and 2, regarding the daily consumption of fruits, and question 15, regarding the daily consumption of yogurt and cheese. However, kappa statistics showed good agreement in almost every question and in the KIDMED Index score (κ = 0·665; 95 % CI = 0·459, 0·772). Finally, in the Brazilian study(Reference Simon, Forte and Marostica28), it only evaluated the agreement of the final score, on two occasions (after 7–10 d), in children (5·29 (sd 2·03) years) and adolescents (14·33 (sd 1·96)), from public and private schools, covering the capital and inland of the state, and the ICC showed excellent reproducibility in both groups (ICC = 0·893; 95 % CI = 0·812, 0·939 in children and ICC = 0·998; 95 % CI = 0·997, 0·999 in adolescents).
Validity studies
When the validity in reference to the 3-d DR was analysed, eleven questions (68·75 % of the questions) showed slight to moderate agreement (ranging between 0·109 and 0·445) and the KIDMED Index score revealed weak correlation (ρ = 0·317; P-value <0·001) and slight agreement (κ w = 0·167, 95 % CI 0·071, 0·262). When the KIDMED Index was compared with the MAI, it was found moderate correlation (ρ = 0·423; P-value <0·001) and fair agreement (κ w = 0·344, 95 % CI 0·202, 0·486) between the two scores, which corroborate the validity of the KIDMED Index assessed with the 3-d DR.
Question 9, about eating cereal or cereal products for breakfast, also proved to be reproducible but not valid, which can be due to the misunderstanding of the term ‘cereals for breakfast’ as the so-called ready-to-eat ‘breakfast cereals’ because if the ‘breakfast cereals’ were included into the criteria to obtain 1 point in question 9 according to 3-d DR data, this question would have been – incorrectly – considered valid (κ = 0·219, 95 % CI 0·034, 0·405). The consumption of this non-Mediterranean food products at breakfast has increased over the last decades, being one of the most frequent breakfast components among children and adolescents(Reference Rito, Dinis and Rascôa40).
Questions 10 and 11 did not prove to be valid, even though they proved to be reproducible. This fact can be due to limitations of the 3-d DR: in question 10, only 8·6 % of the sample consumed nuts (according to the 3-d DR), which reveals a very infrequent consumption (<10 %) to be evaluated in just 3 d, and in question 11, 100 % of the sample consumed olive oil (according to the 3-d DR) because all recipes considered the use of olive oil, when using the Eat24 Software programme to enter the fully filled DR answers’.
Question 5 and question 16 did not show reproducibility or validity. However, it was found that adolescents who answered YES to question 5 and to question 16 of the KIDMED Index had a higher daily fish, crustaceans and mollusks consumption and a higher daily intake of sweats and candies, respectively, than adolescents who answered NO (20·0 g/d v. 18·3 g/d and 12·7 g/d v. 9·7 g/d), although without statistical significance (P-value = 0·376 and P-value = 0·788, respectively).
Still, the validity of each question may be less important than the validity of the score(Reference Wong, Parnell and Howe41) – since diet quality is determined by the collective contribution of the sixteen questions of the KIDMED Index. For this reason, we can assume that the Portuguese version of the KIDMED Index has an acceptable validity.
Our results are in alignment with the previous HELENA study(Reference Aparicio-Ugarriza, Cuenca-García and Gonzalez-Gross29) that recommends the use of the KIDMED Index in European adolescents when investigating adherence to the MDP among adolescents because the index showed associations with nutrient and food intakes and nutritional biomarkers, in the hypothesised directions. In this study, they collected 24-h dietary recalls on two non-consecutive days within a period of 2 weeks, Food Frequency and Food Choices and Preferences questionnaires and fasted blood samples to investigate if the adapted KIDMED Index for adolescents (aged 12·5–17·5 years) was associated with better food/nutrient intakes and nutritional biomarkers.
Despite our conclusion, it might be of use that future research would focus on improving the psychometric properties of this MDP adherence score.
Strengths and limitations
Our study is one of the first to have simultaneously addressed the reproducibility and the validity of the KIDMED Index. In Portugal, it is the only one to focus on the psychometric properties of this instrument.
Lack of participation was largely due to failure to return the consent form, but the final sample was the most heterogeneous sample possible because this study included two public school groups, the westernmost and easternmost ones from a northern district of the country, and selected adolescents from different school years, aged between 10 and 19 years. The data were collected via a stratified one-stage cluster sampling – within each school group (stratum), a few classes (clusters) were randomly selected and then all students in a class were included. However, a record of the class to which the student belonged was not kept, making it impossible to study the potential correlations among students within the same class.
The KIDMED Index was self-administered at both times, preventing the introduction of interviewer bias in the data(Reference McDonald, Burnett and Coronado42), and it was considered a 2-week period between test and retest, avoiding major changes in the eating habits of adolescents – if the time interval was too long, participants could change their actual eating habits – and reducing the possibility of artificially inflate reliability of the instrument– if the time interval was too short, participants could remember their answers from the first occasion and answer the same way the second time to be consistent(Reference Vaus43).
The 3-d DR was used to collect dietary data, for the reason that the DR are recognised as the gold standard of the dietary assessment methods and are used as a reference in calibration or validation studies, which employ other less rigorous and less expensive method(Reference Ortega, Pérez-Rodrigo and López-Sobaler30). On the other hand, the DR requires literate population(Reference Ortega, Pérez-Rodrigo and López-Sobaler30), which helps to clarify the lower parent’s education level found in students who did not fully fill the 3-d DR. Other disadvantage of the DR is the fact that it requires multiple records, over several months, to capture usual intake(Reference Ortega, Pérez-Rodrigo and López-Sobaler30). This helps explain the very infrequent nuts consumption observed. However, using DR with more than a minimum of 3 d would elevate the subject’s burden and the staff’s cost and burden too(Reference Ortega, Pérez-Rodrigo and López-Sobaler30). The use of one single database of food composition data – the Eat24 Software programme, based on the information from the Portuguese Food Composition Table, to enter the 3-d DR – avoided the limitations that coincide with the use of various databases of food composition data, but did not avoid the loss of accuracy in dietary information from mixed dishes, such as the inclusion of olive oil in all recipes. To overcome these limitations, fasted blood samples could be considered as in HELENA study, but they were not collected in this school-based study due to an ethical and practical viewpoint, and they would not allow to validate each question of the KIDMED Index such as the DR allowed.
The MAI has not been validated in Portugal, but it is a useful tool and it has been used to study the adherence of a country or a population to the MDP, by dividing the energy from the Mediterranean food groups by the energy from the non-Mediterranean food groups(Reference Silva, Bach-Faig and Quintana15,Reference Vilarnau, Stracker and Funtikov19,Reference Alberti-Fidanza, Fidanza and Chiuchiù34,Reference Alberti-Fidanza and Fidanza44,Reference Alberti, Fruttini and Fidanza45) . This index can be used with dietary data obtained with reliable and valid methods, such as DR(Reference Alberti-Fidanza and Fidanza44); it can be calculated for adults, but appropriate modifications are needed, for example, for children and adolescents(Reference Alberti, Fruttini and Fidanza45) – such as the inclusion of all alcoholic beverages into the non-Mediterranean food groups, even wine, a drink whose moderate consumption is promoted in MDP – and MAI values can be calculated using food groups intake expressed as percentages of total energy/d or g/d(Reference Alberti-Fidanza and Fidanza44,Reference Alberti, Fruttini and Fidanza45) – although, in this case, the MAI will generally be higher than when expressed as a percentage of total energy/d(Reference Alberti-Fidanza and Fidanza44) but will have better into account the light/zero/diet food products’ contribution, such as the light/zero/diet refrigerants. So, even with these known limitations, in the present study, as in previous studies(Reference Silva, Bach-Faig and Quintana15,Reference Vilarnau, Stracker and Funtikov19) , the MAI values were calculated through an adaptation of the MAI defined by Alberti-Fidanza et al. (Reference Alberti-Fidanza, Fidanza and Chiuchiù34), allowing us to verify the validity of the KIDMED Index with an extra tool that has also been used to study the adherence to the MDP.
Conclusion
The Portuguese version of the KIDMED Index is an instrument with an acceptable reproducibility and validity for assessing adherence to the MDP among adolescents.
Acknowledgements
The authors would like to thank the students and teachers for their enthusiastic participation in the study.
This research received no specific grant from any funding agency, commercial or not-for-profit sectors.
The authors declare that there are no conflicts of interest.
Annex A KIDMED Index – Portuguese version