


This paper focuses on the earnings mobility of individuals moving from one income group to another within their own lifetime.Footnote 1 This is partly determined by the individual's effort and partly by circumstances. A high degree of upward mobility is generally considered to be conducive to a vibrant and harmonious society, and it is normally proxied by earnings (in economics) and occupation (in sociology).Footnote 2 Normally, however, the availability of longitudinal data is considered necessary to gauge the degree of upward earnings mobility. For example, Wen-Hao Chen draws on the longitudinal data for Canada, the US, the UK and Germany, taken from the Cross-National Equivalent Files (CNEF), and makes a cross-nation comparison in mobility between different income brackets from the 1990s to the early 2000s.Footnote 3 Gregg et al. compares intergenerational income mobility with data from the US (National Longitudinal Study of Youth 1979), the UK (British Cohort Study 1970) and Sweden (Population Register Data, 1965 cohort), and finds that both income elasticities and rank–order correlations are highest in the US, followed by the UK and then Sweden.Footnote 4 One common approach to measuring earnings mobility is to construct transition matrices portraying the movement of people from one income group to another over time.Footnote 5
An important question is whether it is possible to conduct meaningful empirical study into earnings mobility in the absence of longitudinal data. There is a widely held perception that upward mobility is in decline in Hong Kong; however, there is a paucity of hard evidence. Especially in recent years, younger generations have been claiming that they face a more difficult upward-mobility path compared to that experienced by older cohorts. Policymakers require a correct assessment of the problem before they can properly make and prioritize policies.
During the time of “hyper growth” during the 1960s and 1970s, Hong Kong was considered to be a place with great opportunities for upward mobility, which was believed to be within reach of the talented and hardworking.Footnote 6 More recently, however, there have been many claims of a trend towards reduced upward mobility, but little data to back up the claims.Footnote 7 This paper attempts to fill this gap using cross-sectional census data collected from a period spanning several decades. Such data, admittedly, may not serve as a complete substitute for longitudinal data; however, as we will show, it is possible to uncover interesting patterns and information about how the degree of upward mobility has changed over the years, particularly from cohort to cohort.
The rest of the paper is structured as follows. The following section provides an overview of the findings about earnings mobility in Hong Kong to date. Then, we introduce the data and research methodology adopted in our study before presenting a discussion of the results. Finally, we summarize the policy implications based on the main findings of the paper.
Review of Previous Studies on Earnings Mobility in Hong Kong
The absence of longitudinal data for Hong Kong has long inhibited serious empirical studies on earnings mobility, although scholars, particularly sociologists, have shown much interest in the subject. In an attempt to overcome the problem, Alan Siu compared recalled earnings in earlier years (1991 and 1996) with reported actual earnings in 2000.Footnote 8 Based on the results from the correlation of log earnings and transition matrices, he found significant overall earnings mobility in the 1990s. Apart from the limitations presented by the small sample size and recollection errors, however, this approach does not readily allow a comparison between earnings mobility for different cohorts at the same stage during the course of their lives.
James Vere investigated both intragenerational and intergenerational mobility.Footnote 9 The intragenerational study used the same approach as that used in Siu's work, while the intergenerational study was based on the correlation of lifetime earnings between father and child. Vere's study was restricted to workers with positive monthly earnings in 1996, 2001 and 2005.Footnote 10 Although mobility in terms of earnings was still evident during the period 1996 to 2005, both upward and downward mobility appeared to have decreased across all types of workers in comparison to the 1991 to 2000 period. As to intergenerational mobility, the lifetime earnings of father and child were found to be positively correlated. Nevertheless, the Commission on Poverty found that intergenerational poverty was not a serious problem in Hong Kong: 87 per cent of children whose fathers were in the bottom earnings quintile were found to have moved upwards.Footnote 11 Conversely, Xiaoying Li and Zhou Wei reported downward intergenerational mobility in the bottom earnings quintile, using 1 per cent samples from the 2001 Census, 2006 By-census and 2011 Census.Footnote 12
Vere's study was an update of Siu's findings and again utilized information based on recalled earnings in 1998 and 2003 and actual earnings in 2008.Footnote 13 Compared to previous findings, mobility has declined, with the decline being most notable for workers in the higher income brackets. Downward mobility increased more frequently for higher income brackets, while upward mobility increased more frequently for the lower income brackets. “Intergenerational mobility” was within the standard range for developed countries, being somewhere between the United Kingdom and western European countries, despite the slight decline since the study in 2006.
As for intragenerational change, Xiaogang Wu, drawing upon series data from the census/by-census and a household survey conducted by the Census and Statistics Department in 2007, reported that 54.1 per cent of the workers in the lowest income quintile experienced no mobility along the earnings ladder in a ten-year period (1998–2008).Footnote 14 The most recent study on intragenerational earnings mobility in Hong Kong to date was conducted by the Economic Analysis and Business Facilitation Unit (EABFU) from the HKSAR Government.Footnote 15 Post-secondary graduates’ demographic information, taken from the Student Finance Office, was linked to their subsequent earnings history, taken from the Inland Revenue Department, as reported by their employers. The analysis was based on movements across earnings deciles over the years. Results show that first degree graduates who graduated from 2001–2002 through 2006–2007 enjoyed substantial upward earnings mobility, having taken advantage of the education expansion.Footnote 16 Holders of associate degrees, higher diplomas or below who entered the labour force with the 2001–2002 cohort also enjoyed substantial upward earnings mobility. This cohort was typically born after 1980.
Data and Research Methodology
Given that there are no panel data of workers available in Hong Kong, we follow cohorts of workers through randomly selected representatives from each census or by-census year to the next. Validity of this approach requires the assumption that the composition of the population in each cohort is not significantly changed through the years. Generally, the composition of the population in each cohort will change through immigration, emigration, aging and death, while the composition of the working population may further change through entry and exit from the labour force. According to the census data, the percentage of the Hong Kong population with residence at or over ten years has ranged from 80 per cent to 83 per cent in 2001, 2006 and 2011, while the percentage of the Cantonese-speaking population has remained within the range of 89.2 per cent to 90.8 per cent. It appears that even though immigration and emigration continue to occur through the years, the main characteristics of the population have not significantly changed over the years (see the Appendix for more details). Therefore, we assume that we can follow the cohort from one census or by-census to the next.
The datasets used in this study include the 1986 By-census (1 per cent sample), the 1991 Census (5 per cent sample), the 1996 By-census (5 per cent sample), the 2001 Census (1 per cent sample), the 2006 By-census (1 per cent sample), the 2011 Census (5 per cent sample), and the 2016 Census (5 per cent sample). The Hong Kong Population Census is carried out by the Hong Kong Census and Statistics Department (HKCSD) every ten years and covers all who are physically in Hong Kong, excluding visitors, while the By-census is carried out between two censuses and covers a large, randomly drawn sample of the population.Footnote 17 The sizes of the datasets available to us are sufficiently large and representative for us to define cohorts for meaningful analysis. We selected the data for our analysis based on three criteria. First, we only include working members of the population with a monthly income greater than zero. Second, only Hong Kong natives and Chinese immigrants are included. Third, all subjects without occupation information are dropped.
Table 1 shows the sample size of each age group for each cohort in each census and by-census year. Each cohort is defined by date of birth within a specified five-year period. The “first cohort” is born in 1961–1965; the latest and seventh cohort is born in 1991–1995. Each is traced starting from age 21 to 25 from one census or by-census to the next.
Table 1. Respective Age and Sample Size of Cohorts in Each Census/By-Census Year

Notes: N.A. = Not Available.
In each survey year, the workers in each cohort are sorted into three income groups: the relatively “poor,” who earn less than half the median income,Footnote 18 the “average,” and the relatively “well-off,” who earn more than 150 per cent of the median income (250 per cent of the income of the relatively “poor”). The Hong Kong official poverty line is also drawn in the same way.
Alternatively, we also define “poor in absolute terms” (“absolutely poor”) as earning $10,000 (at 2016 pricesFootnote 19) or less a month, and “well-off in absolute terms” (“absolutely well-off”) as those earning $25,000 or more (again, at 2016 prices) a month.Footnote 20 Although the income for the “absolutely poor” is a far cry from $4,000 (at 2016 prices) – the poverty line proposed by Hong Kong government – we still find it a convincing indicator. The threshold for absolute poverty in principle should be sufficient to cover basic expenditures like food and lodging, which are not taken in account by the official poverty line. Therefore, the size of the actual poor population might be underestimated if we only consider income-based thresholds. Using Oxfam's 2014 report and a study conducted by the Hong Kong Council of Social Services in 2017 as references, we consider a monthly income of $10,000 at 2016 prices as the absolute poverty line.Footnote 21 We believe that such an income would be above the Comprehensive Social Security Allowance, including the rent allowance for a single person. Correspondently, the absolutely well-off line is set at 250 per cent of the absolutely poor line. Although one could debate the exact definitions for absolutely poor or absolutely well-off once the constant dollar thresholds are defined, cross-cohort comparisons are still meaningful.
We first define the “well-off rate” and “poor rate” in relative and absolute terms:
• The “relatively well-off rate” (RWR) is the percentage of workers within a given cohort who achieve 1.5 times the median income. The RWR may be interpreted as the probability of a worker, randomly picked from the cohort, earning 1.5 times the median income.
• The “absolutely well-off rate” (AWR) is the percentage of workers within a given cohort who achieve at least a $25,000 monthly income (at 2016 prices). This is almost 1.89 times the median employment earnings as of 2011.Footnote 22
• The “relatively poor rate” (RPR) is the percentage of workers within a given cohort who earn less than half of the median income. The RPR may be interpreted as the probability of a worker, randomly picked from the cohort, making less than half of the median income. Since the median income changes from cohort to cohort, the real purchasing power of the cut-off point for the RPR is not constant.
• The “absolutely poor rate” (APR) is the percentage of workers within a given cohort whose incomes are below $10,000 per month (at 2016 prices). The APR can be interpreted as the probability of a worker, picked randomly from a cohort, earning less than $10,000 a month.
We then obtain the “mobility ratio” (MR) over a period of time by dividing the well-off rate at the end of the period with that at the beginning of the period for each cohort.Footnote 23 This indicates the speed of mobility into or out of the upper income class over the period. For instance, an MR of three means that at the end of the period, the likelihood of being well-off is three times as likely as that at the beginning of the period. An MR less than one suggests downward mobility.
Similarly, the “immobility ratio” (IMR) over a period of time is found by dividing the poor rate at the end of the period with that at the beginning of the period for each cohort. A figure of 0.50 means that the likelihood of being poor at the end of the period is half of that at the beginning, which suggests mobility; a figure of one indicates absolute immobility. In the same vein, figures greater than one suggest increased chances of falling into poverty.
We are not the first to use the terms mobility ratio and immobility ratio. However, while our proposed concepts are related to those used in the literature, there is a subtle difference. Gary Fields defines immobility ratio as “the fraction of income recipients who remain in the same quintile as before.”Footnote 24 This definition does not indicate if mobility has gained or lost speed. In contrast, our definition gives an indication of any improvement at the end of period just by the magnitude of the number.
A measure conceptually closer to our mobility and immobility ratios is the “disparity ratio” of John Goldthorpe and colleagues. Their focus, however, was on the inter-generational mobility from one socioeconomic class to another (which is defined by occupation).Footnote 25 Our focus is on mobility from one income class to another for the same generation.
Results
Relative income mobility
Table 2 shows the median wage over the years and the respective thresholds for the poor rate and the well-off rates. Based on these thresholds, the RPR and the RWR are compiled, as in Table 3, for the first cohort, i.e. those born in 1961–1965.
Table 2. Threshold Incomes for the Relatively Poor and the Relatively Well-off Based on the Median Wage

Notes: Wages in this paper always refer to monthly earnings from the main employment.
Table 3. Calculation of Immobility Ratio (IR) and Mobility Ratio (MR)* (1st Cohort, Born in 1961–1965)

Notes:
* Based on the percentage of workers who are relatively poor and the percentage of those who are relatively well-off.
We calculate the immobility ratios and mobility ratios in the same way for all the other cohorts up to the sixth cohort. The data do not allow us to compute the ratios for the seventh cohort. We put all the mobility and immobility ratios for the different cohorts in Table 4.
Table 4. Relatively Well-off Rates for Different Cohorts at Different Ages

Table 5. Relatively Poor Rates for Different Cohorts at Different Ages

Table 4 presents RWRs for different cohorts at different age brackets. First, we observe that the percentage of those who are relatively well-off at age 21–25 fell to a historical low at 5.83 per cent for those born in 1981–1985 (fifth cohort) and struggled to recover for the later cohorts. Noticeably, this figure jumped to 30.7 per cent by 26–30, suggesting ample upward mobility for the fifth cohort in the first five years of their career. This seems fairly good compared to previous cohorts. However, with further upward mobility stalled, by age 26–30 the RWR actually dipped, to 29.4 per cent, the lowest among all cohorts at this age bracket. The sixth cohort and the seventh cohort fared even worse. At age 21–25, the RWR for the sixth cohort was 8.7 per cent, which is lower than that of the fifth cohort, and by 26–30, the RWR only rose to 17.7 per cent, which is the lowest among all cohorts. There are no data for the seventh cohort beyond 21–25, during which the RWR was a paltry 6.5 per cent.
Table 5 shows that relative poverty for all cohorts born after 1980 at age 21–25 is in the range 11.8 per cent to 15.1 per cent, as compared with 6.6 per cent or lower for all previous cohorts. At 26–30, the RPR for those born in 1986–1990 fell to 6.8 per cent, but this is actually the highest among all cohorts, reaffirming that those born after 1980 had difficulty moving up in relative earnings.
The 2011 Census showed an improvement in the RPR compared to the previous cohort across all cohorts (note the diagonal with five shaded boxes). For age 41–45, those born in 1966–1970 had an RPR of 7.3 per cent, down from 10 per cent for those born in 1961–1965. On the other hand, results of the 2016 By-census showed a worsening in the RPR across all cohorts, compared to the previous cohort at the same age bracket. For example, those born in 1986–1990 at age 26–30 had an RPR of 6.8 per cent, higher than the rate at 4.1 per cent of those born five years earlier. This suggests that while the 2011 Census brought good news about upward mobility, the 2016 By-census results showed a turn for worse.
Absolute income mobility
Table 6 shows that at age 21–25, the percentage of those who belong to the absolutely well-off group rose from cohort to cohort until the fourth cohort (i.e. those born in 1976–1980) and peaked at 30.35 per cent. From the perspective of an entire life cycle, however, the cohort with the best economic fortunes was the first cohort (i.e. those born in 1961–1965) for whom the highest AWR occurred at age 36–40; for the second cohort, the highest AWR was 46.66 per cent, achieved at age 31–35. For the third cohort, the AWR was reached still earlier, at age 26–30, at 35.27 per cent. For the fourth cohort, the AWR was highest at age 21–25, at 30.35 per cent. As this cohort aged into the next age bracket, the AWR actually fell sharply to 16.34 per cent. Then, the AWR rose until age 31–35, and then fell again during 36–40. For all the later cohorts (the fifth and after), the AWRs at age 21–25 went back to single digit levels, at 2.7 per cent, 4.0 per cent and 5.3 per cent respectively. These are comparable or better than those of the first to the third cohorts, but their upward mobility was far more limited.
Table 6. Absolutely Well-off Rates for Different Cohorts at Different Ages*

Notes:
* Well off is defined as earning $25,000 or more per month at 2016 prices.
Table 7 shows APRs for all the cohorts at different ages and paints a similar picture. At age 21–25, the APR declined from cohort to cohort until the fourth cohort, for which a mere 19.1 per cent was absolutely poor. All later cohorts had APRs above 30 per cent. At age 26–30, the APR fell from cohort to cohort until the third cohort, after which the APR became progressively bigger from cohort to cohort.
Table 7. Absolutely Poor Rates for Different Cohorts at Different Ages*

Notes:
* Poor is defined as earning $10,000 or less per month at 2016 prices.
Table 7 as well as Table 8 show that the latest, or seventh, cohort appears to fare better when they start their careers at age 21–25. However, there is no information about their upward mobility down the road until results from the 2021 Census are available.
Table 8. Mobility and Immobility Ratios (in Absolute Terms) for Different Cohorts

Discussions and Conclusions
Our study uses census data spanning four decades to decipher earnings mobility across cohorts. We use the concept of mobility ratio and immobility ratio to depict the speed of upward mobility at the top end and the bottom end of the income distribution. Our findings confirm the popular impression that upward mobility in Hong Kong since the mid-1970s has declined significantly. Although the later cohorts started their careers in far better conditions in absolute terms than those born during the 1960s, immobility ratios were much higher and mobility ratios much lower. Although there is still some mobility in the first ten years of people's careers, the prospects of further improvement look far worse than for those born in earlier cohorts.
The first cohort, those born in 1961–1965, appears to be the one that has enjoyed the best fortunes over the life cycle. By age 36–40, both AWRs and RWRs exceed 50 per cent while APRs fall to just over 13 per cent.
Those born after 1980 all started their careers with RPRs at double digits, well above previous cohorts. Absolutely poor rates were all above 30 per cent at age 21–25, which is significantly worse than for the cohort born in the late 1970s but still better than for those born in the 1960s. By age 31–35, the APR for those born in 1981–1985 climbed to over 20 per cent, while the RPR climbed to over 9 per cent, the highest among all cohorts.
The fourth cohort (born in 1976–1980) is a watershed cohort. They started their careers in a far better position than did any of the earlier cohorts. The APR was down to 19 per cent. In comparison, the APR was as high as 81.3 per cent for the first cohort and APRs were all higher than 30 per cent for all later cohorts. However, these good fortunes did not last long and further upward mobility proved elusive for this group. By age 36–40, the APR had risen to 26.7 per cent, higher than that for any of the earlier cohorts at this stage of the life cycle. The AWR had fallen to 24.2 per cent, lower than that of any of the earlier cohorts at the same age.
Our findings appear to differ significantly to those reported by the Economic Analysis and Business Facilitation Unit.Footnote 26 According to that study, “substantial upward earnings mobility was enjoyed by first degree graduates from the 2001/02 and 2006/07 cohorts. Specifically, for the 2001/02 cohort, the median graduate could rise by 8 income categories within 10 years (where each income category covers 1/20th of the overall income distribution).”Footnote 27
Given that the typical age of graduation is 21 to 22, the classes of 2001/2002 and 2006/2007 would be born around 1980 or 1985, which roughly corresponds to our fifth cohort. The fifth cohort does enjoy a high degree of upward mobility because the immobility ratio is much less than 1 and the 10-year mobility ratio is 9.99 and 5.04 for absolute earnings mobility and relative earnings mobility respectively (Table 8). However, the first and second cohorts, i.e. those born in the 1960s, actually had a much higher 10-year mobility ratio of 47 and absolute earnings mobility of 27. The AWR for those born in 1981–1985 at age 31–35 was only 27.07 per cent, noticeably lower than that for all the previous cohorts except the first. The APR was 20.2 per cent, higher than that of all the previous cohorts except the first. Given that the first cohort had reached an AWR at over 50 per cent by age 36–40, in life cycle terms and given that economic growth in Hong Kong has been well below 5 per cent for many years and is unlikely to pick up, it will be very difficult for those born after 1980 to beat any of the earlier cohorts, let alone the first cohort.
The decreased fortunes for the cohorts born after 1976–1980 are most probably related to macro-economic changes that have led to wage polarization in Hong Kong. Hong Kong's GDP grew dramatically from the 1980s to 1997, having benefited from China's opening up. From 1986 to 1997, nominal GDP growth generally stayed above 10 per cent (see Figure 1). Rapid economic growth in this period allowed rapid upward mobility, as was the case for our first cohort (born in 1961–1965) whose economic fortunes improved significantly following this trend. As economic growth slowed down after 1997, so did upward earnings mobility. In 2015, the Legislative Council Secretariat concluded: “a lack of new growth engines has restrained earnings growth and social mobility.”Footnote 28 The declining earnings mobility experienced in Hong Kong is likely to be replicated on the mainland, as its growth slowed noticeably from over 10 per cent per year on average in 1980–2010 to an average of 7 per cent in 2011–2021. This could lead to the kind of discontent that has certainly played a role in Hong Kong's social unrest in recent years.Footnote 29

Figure 1. Annual GDP Growth of Hong Kong, 1986–2016
Source: Census and Statistics Department, Hong Kong SAR.
Acknowledgements
We thank Professor Wei Xiangdong and anonymous referees for their valuable comments and suggestions. This study is supported by the Pan Sutong Shanghai-Hong Kong Economic Policy Research Institute, Lingnan University.
Conflict of interests
None.
Appendix: Main Population Characteristics of Six Cohorts
Table 1. Born in 1961–1965 (“1st Cohort”)
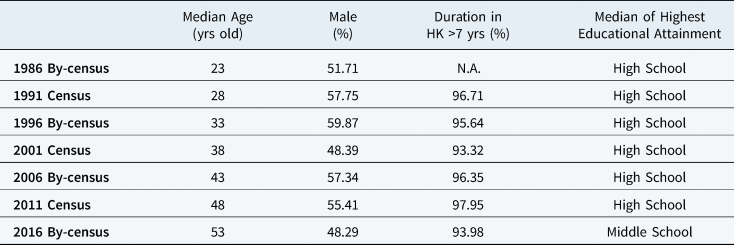
Table 2. Born in 1966–1970 (“2nd Cohort”)

Table 3. Born in 1971–1975 (“3rd Cohort”)

Table 4. Born in 1976–1980 (“4th Cohort”)

Table 5. Born in 1981–1985 (“5th Cohort”)

Table 6. Born in 1986–1990 (“6th Cohort”)

Minhui Liu is a research officer at the Pan Sutong Shanghai–Hong Kong Economic Policy Research Institute, Lingnan University. Her research areas cover migration, labour market inequalities and the Greater Bay Area development.
Lok Sang Ho is a veteran policy analyst with both government and academic working experience. He is currently director of the Pan Sutong Economic Policy Research Institute of Lingnan University and an honorary research fellow with the HK Institute of Asia Pacific Studies of the Chinese University of Hong Kong. He has a PhD in economics from the University of Toronto and is widely published. He was awarded the Bronze Bauhinia Star by the HKSAR Government in 2016 for his work on public policy.
Kai Wai Huang is a lecturer in the department of management, the Hang Seng University of Hong Kong. His research interests focus on labour economics, microeconomics, population ageing and education innovation.


 Open access