


1 Introduction
In the past two decades, MeV ion bunches generated in intense laser–plasma interactions have attracted attention[Reference Macchi, Borghesi and Passoni1, Reference Schreiber, Bolton and Parodi2] due to their wide range of potential applications, such as fast ignition[Reference Roth, Cowan, Key, Hatchett, Brown, Fountain, Johnson, Pennington, Snavely, Wilks, Yasuike, Ruhl, Pegoraro, Bulanov, Campbell, Perry and Powell3], radiography[Reference Cauble, Da Silva, Barbee, Celliers, Moreno and Wan4] and ion beam therapy[Reference Linz and Alonso5]. Experiments, currently exploiting micrometer foil targets for target normal sheath acceleration (TNSA)[Reference Mora6], provide a world record of maximum proton energy beyond 85 MeV[Reference Wagner, Deppert, Brabetz, Fiala, Kleinschmidt, Poth, Schanz, Tebartz, Zielbauer, Roth, Stoehlker and Bagnoud7]. With nm thin foils, novel acceleration mechanisms such as radiation pressure acceleration (RPA)[Reference Macchi, Veghini, Liseykina and Pegoraro8–Reference Kim, Pae, Kim, Kim, Sung, Lee, Yu, Choi, Lee, Nam, Nickles, Jeong and Lee14] and breakout afterburner (BOA)[Reference Yin, Albright, Hegelich, Bowers, Flippo, Kwan and Fernández15, Reference Albright, Yin, Bowers, Hegelich, Flippo, Kwan and Fernandez16] have already demonstrated a higher conversion efficiency and faster energy scaling which are in favor for potential applications[Reference Bin, Allinger, Assmann, Dollinger, Drexler, Friedl, Habs, Hilz, Hoerlein, Humble, Karsch, Khrennikov, Kiefer, Krausz, Ma, Michalski, Molls, Raith, Reinhardt, Röper, Schmid, Tajima, Wenz, Zlobinskaya, Schreiber and Wilkens17].
A key limitation of current laser-driven sources based on nanometer thin foil targets is repeatability and reproducibility, far-off the several thousands of shots required for clinically relevant experiments[Reference Hofmann, Masood, Pawelke and Wilkens.18]. This would request a stable system with a few Hz repetition rate.
Here we present our first, operational automated nano-foil target positioning system (nFTPS). It provides space for
 ${\sim}1700$
targets. The interface allows simple implementation of 17 frames with targets of various materials and thicknesses in one round of experiment, which is beneficial for investigative studies on the path to ultimate mass target production. One method of high volume of identical target fabrication using MEMS technology approaches and a target delivering system at 0.1 Hz were presented[Reference Spindloe, Arthur, Hall, Tomlinson, Potter, Kar, Green, Higginbotham, Booth and Tolley19]. Currently, we achieve micrometer position accuracy and 0.5 Hz repetition rate when operated synchronized to our laser. Our prototype device is composed of a 6-axis hexapod, a special-designed target wheel, a microscope and a confocal chromatic distance sensor. We demonstrate operational stability of a laser-driven proton source based on 550 nm thin plastic foils with shot-to-shot variation of about 27% for a level of confidence of 0.95.
${\sim}1700$
targets. The interface allows simple implementation of 17 frames with targets of various materials and thicknesses in one round of experiment, which is beneficial for investigative studies on the path to ultimate mass target production. One method of high volume of identical target fabrication using MEMS technology approaches and a target delivering system at 0.1 Hz were presented[Reference Spindloe, Arthur, Hall, Tomlinson, Potter, Kar, Green, Higginbotham, Booth and Tolley19]. Currently, we achieve micrometer position accuracy and 0.5 Hz repetition rate when operated synchronized to our laser. Our prototype device is composed of a 6-axis hexapod, a special-designed target wheel, a microscope and a confocal chromatic distance sensor. We demonstrate operational stability of a laser-driven proton source based on 550 nm thin plastic foils with shot-to-shot variation of about 27% for a level of confidence of 0.95.
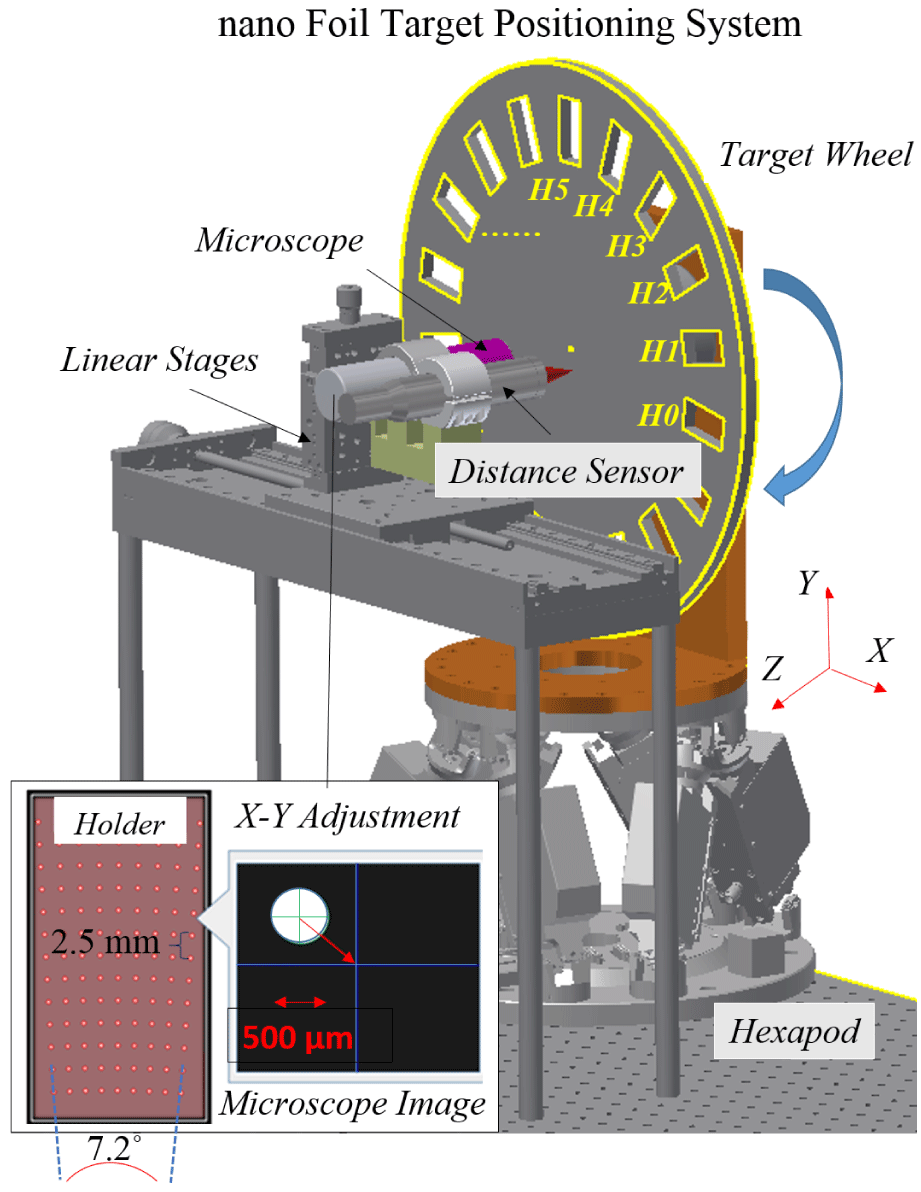
Figure 1. Schematic of nFTPS. Plastic film targets cover the holes on the target holders (bottom left), which are then mounted in the target wheel. The diameter of target holes is
 $500~\unicode[STIX]{x03BC}\text{m}$
and the distance between two holes along the same radial line is 2.5 mm, the angle between two adjacent radial lines is
$500~\unicode[STIX]{x03BC}\text{m}$
and the distance between two holes along the same radial line is 2.5 mm, the angle between two adjacent radial lines is
 $0.903^{\circ }$
. An adjustable microscope can be moved independently to observe and position individual targets in transverse direction
$0.903^{\circ }$
. An adjustable microscope can be moved independently to observe and position individual targets in transverse direction
 $(x{-}y)$
. The chromatic distance sensor is used to adjust the longitudinal target position
$(x{-}y)$
. The chromatic distance sensor is used to adjust the longitudinal target position
 $(z)$
.
$(z)$
.
2 Concept of nFTPS and positioning routine
The nFTPS device is a semi-automatic searching and positioning target system consisting of four main components: a target wheel, a hexapod[20], a microscope objective and a confocal chromatic distance sensor[21], as schemed in Figure 1. The target wheel can accommodate 18 target plates. Each plate has 99 holes over which the targets are mounted. One frame of the 18 positions is typically kept free for alignment purposes such as optimization of the parabolic mirror. The space is sufficient so that we do not need to move the large wheel out of the laser beam path for regular checks. Given that all 17 target holders are completely utilized (H1 to H17), it provides in total 1683 targets. Importantly, these 17 holders can separately accommodate different thicknesses of foils and even different materials, which is also one of the advantages of this nFTPS. The motion of the target wheel is controlled by a hexapod with six degrees of freedom (three translation and three angular rotation). In addition, the rotation of the target wheel around its geometrical center is driven by a motorized stage.
The target plane is imaged via two different magnifications (5-fold and 20-fold) onto a camera. The lower magnification arm gives an overview picture of a given target and the center of its imaging plane which is referred to the target chamber center (TCC). Accurate positioning within
 $5~\unicode[STIX]{x03BC}\text{m}$
precision is supported by the arm with higher magnification. The chromatic distance sensor points at TCC as well and is used to measure target positioning deviations to TCC in the laser-propagation direction at 100 nm accuracy. The signal is fed back to the hexapod (
$5~\unicode[STIX]{x03BC}\text{m}$
precision is supported by the arm with higher magnification. The chromatic distance sensor points at TCC as well and is used to measure target positioning deviations to TCC in the laser-propagation direction at 100 nm accuracy. The signal is fed back to the hexapod (
 $4~\unicode[STIX]{x03BC}\text{m}$
precision) for automatic pre-alignment.
$4~\unicode[STIX]{x03BC}\text{m}$
precision) for automatic pre-alignment.
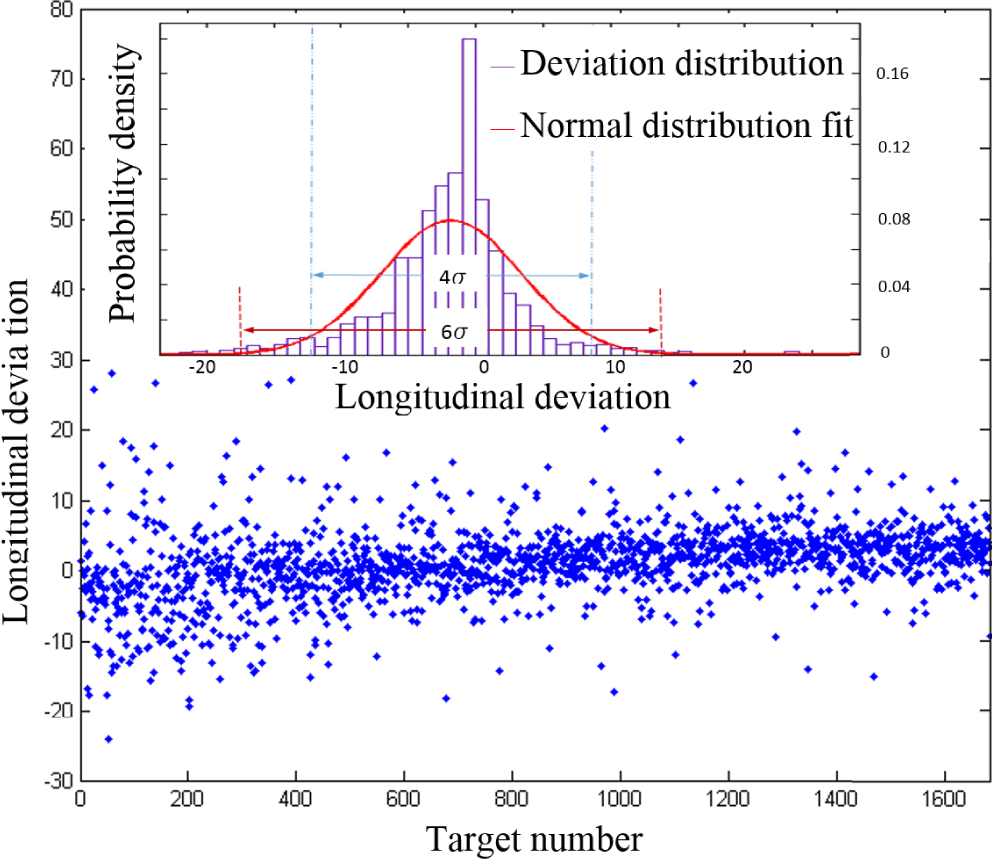
Figure 2. Deviation (in
 $z$
-axis) distribution of 1683 targets (17 holders) and corresponding normal distribution fit. After positioning all targets via the microscope and distance sensor, the displacements after repositioning are shown blue. The measurements are performed in vacuum condition.
$z$
-axis) distribution of 1683 targets (17 holders) and corresponding normal distribution fit. After positioning all targets via the microscope and distance sensor, the displacements after repositioning are shown blue. The measurements are performed in vacuum condition.
 $\unicode[STIX]{x1D70E}$
is the standard deviation.
$\unicode[STIX]{x1D70E}$
is the standard deviation.
Prior to the experiment, the coordinate of each target is first assigned coarsely based on the geometry of the target wheel. The targets will then be moved to the individual assigned positions with real time measurement performed with the microscope and the distance sensor. Deviations of the measured target position from the pre-assigned coordinate system are measured in
 $x$
- and
$x$
- and
 $y$
-dimensions using a 5-fold microscope, as shown in the bottom left corner of Figure 1. The values in
$y$
-dimensions using a 5-fold microscope, as shown in the bottom left corner of Figure 1. The values in
 $z$
-axis (laser direction) are measured by the distance sensor. Based on the recorded data, the hexapod is used to correct for measured deviations that arise from inaccuracies of the wheel and the target geometries. The pre-alignment procedure results in a set of coordinates for each target, which is stored in a list.
$z$
-axis (laser direction) are measured by the distance sensor. Based on the recorded data, the hexapod is used to correct for measured deviations that arise from inaccuracies of the wheel and the target geometries. The pre-alignment procedure results in a set of coordinates for each target, which is stored in a list.
3 Characterization of nFTPS
As a first step, we have quantified the reproducibility of repositioning of the targets. For this procedure, instead of shooting the laser onto the targets, their longitudinal position was re-measured by the distance sensor at 1 Hz. As shown in Figure 2, only small deviations are observed with a mean value of
 $-1.8~\unicode[STIX]{x03BC}\text{m}$
and the standard deviation of
$-1.8~\unicode[STIX]{x03BC}\text{m}$
and the standard deviation of
 $5.2~\unicode[STIX]{x03BC}\text{m}$
among the entire target wheel. This precision of the complete nFTPS in operation almost reaches the precision of the hexapod which is specified as
$5.2~\unicode[STIX]{x03BC}\text{m}$
among the entire target wheel. This precision of the complete nFTPS in operation almost reaches the precision of the hexapod which is specified as
 $4~\unicode[STIX]{x03BC}\text{m}$
. The largest deviations do not exceed
$4~\unicode[STIX]{x03BC}\text{m}$
. The largest deviations do not exceed
 $30~\unicode[STIX]{x03BC}\text{m}$
and are probably caused by faulty single target foils which are inevitable in the floating process which we employed for producing the targets[Reference Seuferling, Haug, Hilz, Haffa, Kreuzer and Schreiber22].
$30~\unicode[STIX]{x03BC}\text{m}$
and are probably caused by faulty single target foils which are inevitable in the floating process which we employed for producing the targets[Reference Seuferling, Haug, Hilz, Haffa, Kreuzer and Schreiber22].

Figure 3. The trend of average deviations after movement for different hexapod velocities. Each point represents the average deviation for 99 targets of one holder, which were measured via the same procedure as described for Figure 2. The error bars represent the standard deviation of 99 data points.
The motion speed of the hexapod when switching between different targets has a strong impact on the positioning accuracy of the nFTPS. As shown in Figure 3, we examined the positioning accuracy for various speeds of the hexapod from 2.5 to
 $12.5~\text{mm}/\text{s}$
, which is represented by the average value of the
$12.5~\text{mm}/\text{s}$
, which is represented by the average value of the
 $z$
-distance deviation to TCC extracted from consecutive measurements of 99 targets. Those values are measured after a given waiting time in which timing starts from the end of hexapod movement. For a given speed, the system relaxes to a constant value. The deviation of the foil position is measured related to the time after the nFTPS starts moving to a new target. Considering a movement time of 450, 250, 170 and 150 ms for switching targets with a motion speed of 2.5, 5, 10 and
$z$
-distance deviation to TCC extracted from consecutive measurements of 99 targets. Those values are measured after a given waiting time in which timing starts from the end of hexapod movement. For a given speed, the system relaxes to a constant value. The deviation of the foil position is measured related to the time after the nFTPS starts moving to a new target. Considering a movement time of 450, 250, 170 and 150 ms for switching targets with a motion speed of 2.5, 5, 10 and
 $12.5~\text{mm}/\text{s}$
, respectively, we derive the stabilization time defined as the total time to reach the positioning accuracy below
$12.5~\text{mm}/\text{s}$
, respectively, we derive the stabilization time defined as the total time to reach the positioning accuracy below
 $\pm 5~\unicode[STIX]{x03BC}\text{m}$
, as 1150, 900, 1020 and 1100 ms, respectively. Thus, for the desired operation of 1 Hz repetition rate, we operate the nFTPS system at the motion speed of
$\pm 5~\unicode[STIX]{x03BC}\text{m}$
, as 1150, 900, 1020 and 1100 ms, respectively. Thus, for the desired operation of 1 Hz repetition rate, we operate the nFTPS system at the motion speed of
 $5~\text{mm}/\text{s}$
. Note that the results shown in Figure 2 are measured with this speed.
$5~\text{mm}/\text{s}$
. Note that the results shown in Figure 2 are measured with this speed.
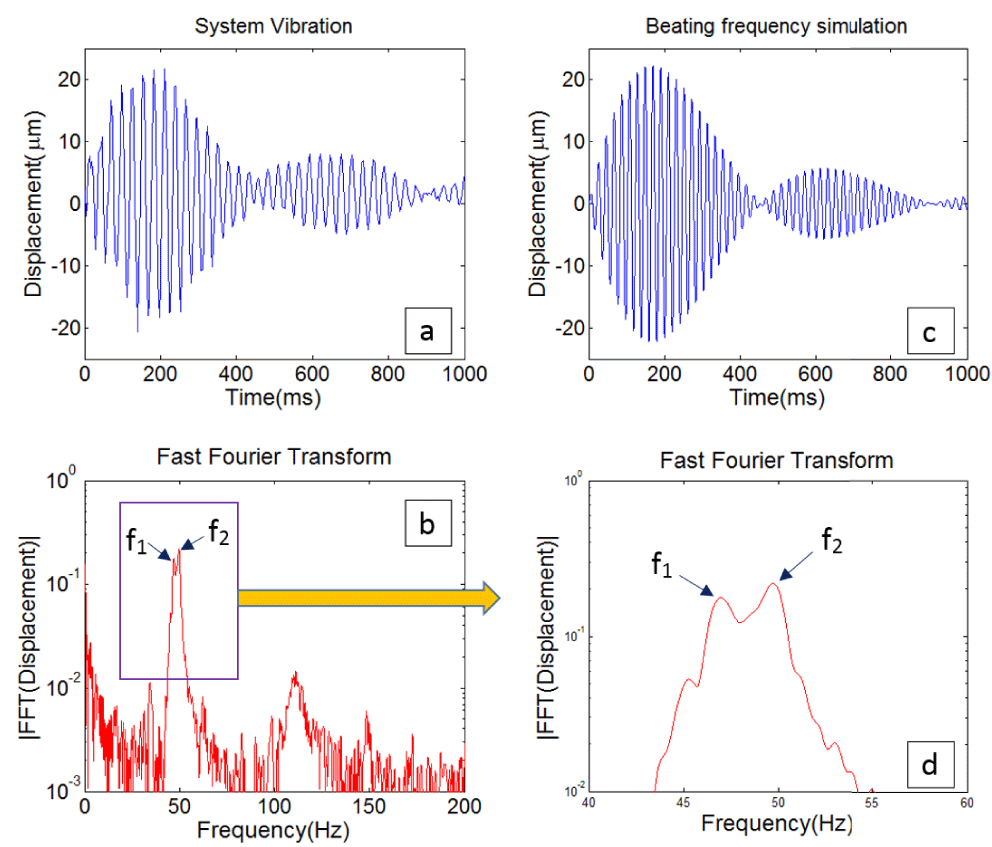
Figure 4. (a) System vibration induced by ceasing hexapod with speed of
 $12.5~\text{mm}/\text{s}$
, (b) the corresponding Fast Fourier Transform and (c) beating frequency simulation. The real time displacements are measured on one film target with the distance sensor after hexapod movement with speed of
$12.5~\text{mm}/\text{s}$
, (b) the corresponding Fast Fourier Transform and (c) beating frequency simulation. The real time displacements are measured on one film target with the distance sensor after hexapod movement with speed of
 $12.5~\text{mm}/\text{s}$
in vacuum condition.
$12.5~\text{mm}/\text{s}$
in vacuum condition.
Further on, the details of the stabilization process are shown in Figure 4, where the
 $z$
-distance deviations to TCC of one single target are recorded over 1 s after the movement of hexapod has stopped. In addition to the decay of the amplitude, a beating-wave-like behavior is observed in Figure 4(a). Figure 4(b) shows the result of the Fast Fourier Transformation of the signal in Figure 4(a), where two adjacent frequency peaks are clearly visible around 50 Hz. Those two frequencies
$z$
-distance deviations to TCC of one single target are recorded over 1 s after the movement of hexapod has stopped. In addition to the decay of the amplitude, a beating-wave-like behavior is observed in Figure 4(a). Figure 4(b) shows the result of the Fast Fourier Transformation of the signal in Figure 4(a), where two adjacent frequency peaks are clearly visible around 50 Hz. Those two frequencies
 $f_{1}\approx 47.6~\text{Hz}$
and
$f_{1}\approx 47.6~\text{Hz}$
and
 $f_{2}\approx 49.8~\text{Hz}$
give rise to the special beating wave structure. We obtain a best fit
$f_{2}\approx 49.8~\text{Hz}$
give rise to the special beating wave structure. We obtain a best fit
 $D=20e^{-3t}\cos (2\unicode[STIX]{x1D70B}f_{1}t)-20e^{-3t}\cos (2\unicode[STIX]{x1D70B}f_{2}t)$
based on those two frequencies with a fitting damping ratio of
$D=20e^{-3t}\cos (2\unicode[STIX]{x1D70B}f_{1}t)-20e^{-3t}\cos (2\unicode[STIX]{x1D70B}f_{2}t)$
based on those two frequencies with a fitting damping ratio of
 $-$
3 per second and initial amplitude of
$-$
3 per second and initial amplitude of
 $20~\unicode[STIX]{x03BC}\text{m}$
, well agreeing with the measurement in Figure 4(a). This understanding of the vibration will enable us to suppress the vibrations and increase the damping ratio. One experiment in which a plane mirror replacing target wheel fixed on top of the hexapod was designed and the observation measured by distance sensor showed that the similar beating frequency phenomenon appeared as well. Therefore, we can conclude that the beating frequency behavior originates from the hexapod; the target wheel vibrates following with the hexapod and it also amplifies the vibration amplitudes. In fact, this two-frequency beating behavior simulation is just one simplified model. As is known, the hexapod has six motors working together to drive the platform, meaning that six frequencies should be taken into consideration. Therefore, for a more precise model, the corresponding simulation is the combination of three beating frequency behaviors in which six frequencies are around these two peaks.
$20~\unicode[STIX]{x03BC}\text{m}$
, well agreeing with the measurement in Figure 4(a). This understanding of the vibration will enable us to suppress the vibrations and increase the damping ratio. One experiment in which a plane mirror replacing target wheel fixed on top of the hexapod was designed and the observation measured by distance sensor showed that the similar beating frequency phenomenon appeared as well. Therefore, we can conclude that the beating frequency behavior originates from the hexapod; the target wheel vibrates following with the hexapod and it also amplifies the vibration amplitudes. In fact, this two-frequency beating behavior simulation is just one simplified model. As is known, the hexapod has six motors working together to drive the platform, meaning that six frequencies should be taken into consideration. Therefore, for a more precise model, the corresponding simulation is the combination of three beating frequency behaviors in which six frequencies are around these two peaks.
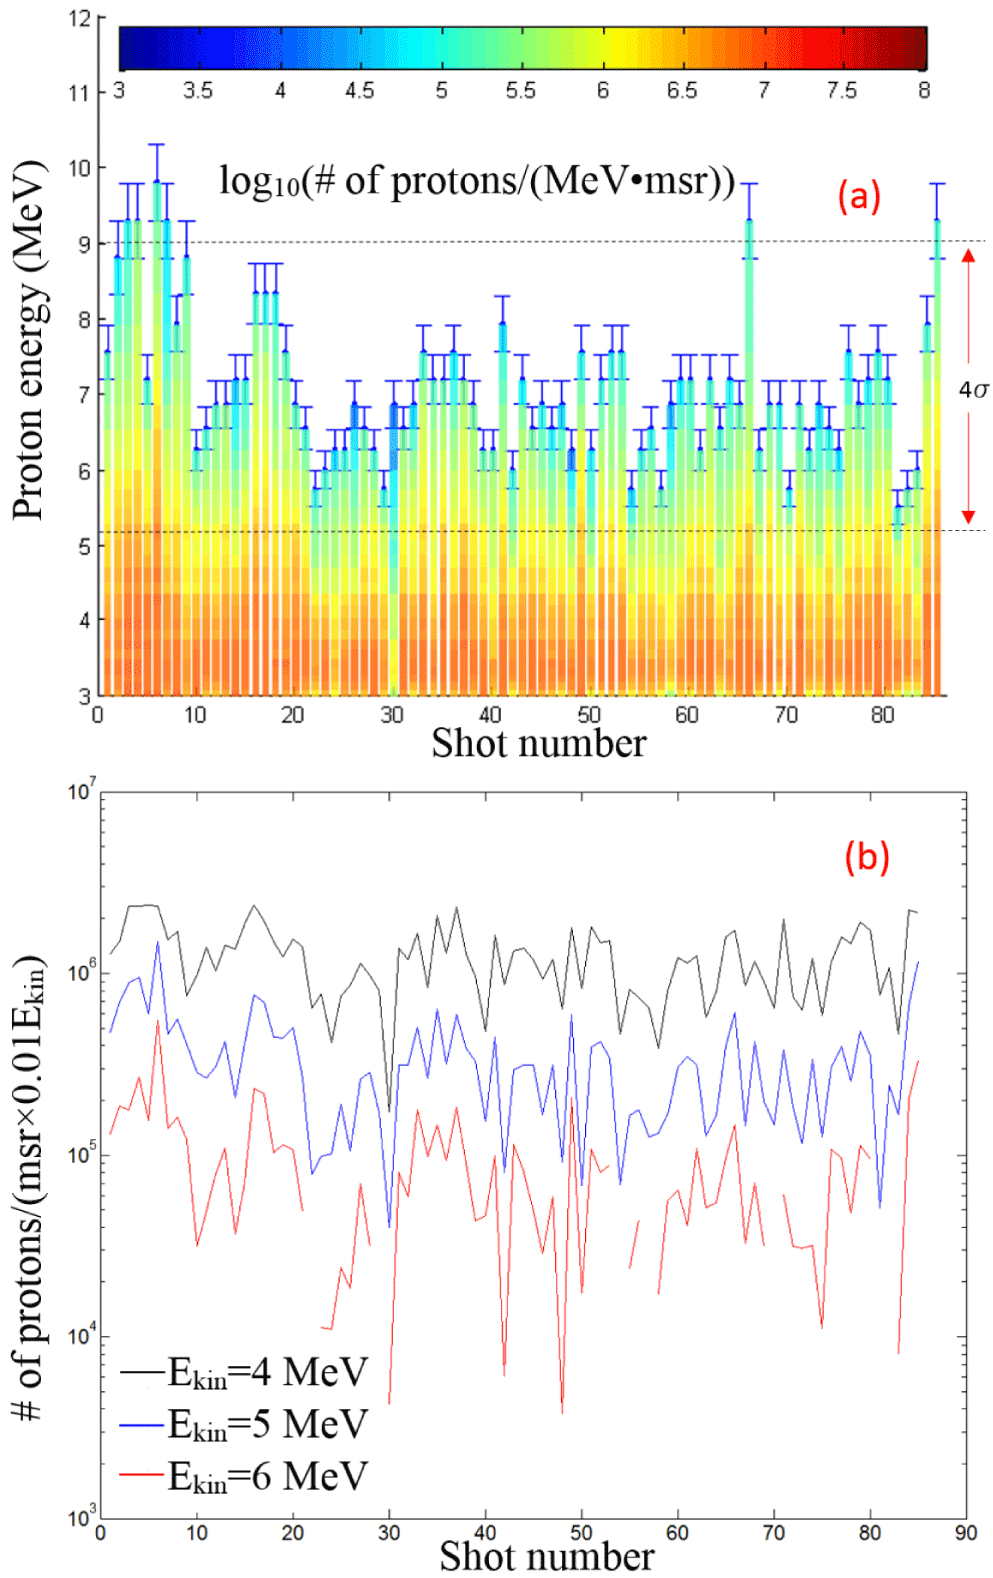
Figure 5. (a) Measured spectra of proton kinetic energies (color bars) and their corresponding distribution of maximum energies. The error bars of single shot results represent the accuracy of the maximum energy determined by the wide angle magnetic spectrometer. The part between the two dashed lines correlates to
 $5.1{-}9~\text{MeV}$
, where 95% of shots’ cutoff energies are located and
$5.1{-}9~\text{MeV}$
, where 95% of shots’ cutoff energies are located and
 $\unicode[STIX]{x1D70E}$
is the corresponding standard deviation. (top). (b) Proton numbers per milli-steradian per 1% kinetic energy at three different kinetic energies: 4, 5 and 6 MeV. (bottom).
$\unicode[STIX]{x1D70E}$
is the corresponding standard deviation. (top). (b) Proton numbers per milli-steradian per 1% kinetic energy at three different kinetic energies: 4, 5 and 6 MeV. (bottom).
It is obvious that this prototype is not space-efficient yet. The main design considerations were: (a) to ensure stability by a rigid construction and mediate remaining imperfections by ‘searching’ targets and pre-defining their position prior to shooting the laser; (b) to mediate damage of neighboring target by allowing for sufficient distance between targets. For PW-lasers, it is expected that the distance between targets may have to become even larger.
4 Experimental results
An experiment focused on laser-driven ion acceleration using the nFTPS was performed at the ATLAS 300 at the Laboratory for Extreme Photonics in Garching. A linearly polarized, 30 fs laser pulse (FWHM pulse duration) with central wavelength of 800 nm and energy of 2 J (fluctuation of 8%) was focused by a
 $90^{\circ }$
off-axis parabolic mirror
$90^{\circ }$
off-axis parabolic mirror
 $(f/2)$
into an FWHM focal spot size of
$(f/2)$
into an FWHM focal spot size of
 $2.7~\unicode[STIX]{x03BC}\text{m}$
, yielding a peak intensity of
$2.7~\unicode[STIX]{x03BC}\text{m}$
, yielding a peak intensity of
 $3.3\times 10^{20}~\text{W}~\text{cm}^{-2}$
in a Rayleigh range of
$3.3\times 10^{20}~\text{W}~\text{cm}^{-2}$
in a Rayleigh range of
 $25~\unicode[STIX]{x03BC}\text{m}$
.
$25~\unicode[STIX]{x03BC}\text{m}$
.
We have tested our system with various target materials and thicknesses between 50 nm and
 $1~\unicode[STIX]{x03BC}\text{m}$
. In particular, we discuss here about 550 nm thick polymer foils which are irradiated under normal incidence. This choice proved effective under the current limitations of laser temporal contrast at our laser system.
$1~\unicode[STIX]{x03BC}\text{m}$
. In particular, we discuss here about 550 nm thick polymer foils which are irradiated under normal incidence. This choice proved effective under the current limitations of laser temporal contrast at our laser system.
Figure 5(a) shows the measured kinetic energy spectra of protons (color bars) and the corresponding maximum proton energies for 85 consecutive shots (blue dots) measured at a 0.5 Hz repetition rate. In Figure 5(b), the differential proton numbers in 1% of kinetic energy slice and 1 msr (as defined in Ref. [Reference Schreiber, Bolton and Parodi2]) are shown at three different energy values 4, 5 and 6 MeV and reveal that the proton number stability improves for smaller kinetic energies. For instance, a shot-to-shot fluctuation of proton numbers is about 86% for a level of confidence of 95% [
 $(0.17-2.33)\times 10^{6}/(\text{msr}\times 0.04~\text{MeV})$
] in case of 4 MeV.
$(0.17-2.33)\times 10^{6}/(\text{msr}\times 0.04~\text{MeV})$
] in case of 4 MeV.
Error bars in the maximum energies result from the employed wide angle spectrometer and specify the corresponding precision at specific proton energies. We observed a shot-to-shot variation of 27% with a level of confidence of 95%. The fluctuations arise from a variety of parameters, possibly including position inaccuracies, variation of target thicknesses and other laser parameters, which can be investigated in detail in future studies.
5 Conclusions
It is shown in this work that the automated nFTPS is capable of positioning targets with 1 Hz repetition rate, providing positioning accuracy of around
 $5~\unicode[STIX]{x03BC}\text{m}$
in all spatial dimensions. In its current version, the nFTPS can be operated with 1 Hz repetition rate, but the synchronization between the nFTPS and the laser trigger has to improve, i.e., the laser must be triggered immediately after the nFTPS has relaxed. Improving on the damping of the remaining vibrations will enable even faster repetition rates. The system has been implemented for positioning nanometer thick targets for high intensity laser plasma experiments at 0.5 Hz at the ATLAS 300 laser system in Garching. The resulting shot-to-shot variation of maximum proton energies of about 27% for a level of confidence of 0.95 demonstrates the current capability which is likely to be not limited by the target positioning system but by additional aspects of the complexity of laser-driven proton sources when using nanometer thin target foils. The nFTPS is of fundamental importance for further investigations of the underlying processes and factors, as well as for many applications, which request operation with high repetition rate.
$5~\unicode[STIX]{x03BC}\text{m}$
in all spatial dimensions. In its current version, the nFTPS can be operated with 1 Hz repetition rate, but the synchronization between the nFTPS and the laser trigger has to improve, i.e., the laser must be triggered immediately after the nFTPS has relaxed. Improving on the damping of the remaining vibrations will enable even faster repetition rates. The system has been implemented for positioning nanometer thick targets for high intensity laser plasma experiments at 0.5 Hz at the ATLAS 300 laser system in Garching. The resulting shot-to-shot variation of maximum proton energies of about 27% for a level of confidence of 0.95 demonstrates the current capability which is likely to be not limited by the target positioning system but by additional aspects of the complexity of laser-driven proton sources when using nanometer thin target foils. The nFTPS is of fundamental importance for further investigations of the underlying processes and factors, as well as for many applications, which request operation with high repetition rate.
Acknowledgements
The work was supported by the DFG Cluster of Excellence Munich-Centre for Advanced Photonics (MAP), the Centre for Advanced Laser Applications and China Scholarship (no. 201508080084).


 Open access