


Introduction
South Africa faces ongoing economic challenges ranging from high unemployment, the ongoing energy crisis, adverse weather conditions, and food inflation. These all have food security implications by making food expensive at the national level and inaccessible at the household level. In 2021, it was estimated that 15 and 6% of South Africans stated that they had inadequate and severe inadequate access to food, respectively (Stats SA, 2022). Although food insecurity has multiple dimensions, drought has been a persistent problem in South Africa in addressing national and household-level food security issues. Despite the significant government investments in agriculture, food insecurity spiked in November 2015 in South Africa due to the worst drought in 23 years. It was estimated that between November 2014 and November 2015, 22% of South African households had no money to buy food (Stats SA, 2016). This proportion reached 41% in the Northwest province and 32, 31, and 26% in the Eastern Cape, Northern Cape, and Free State, respectively. The increased proportions of the hungry were driven by increased cereal prices (mainly maize, fed to humans and livestock), rising by an estimated 53.7% (Nalley et al., Reference Nalley, Dixon, Chaminuka, Naledzani and Coale2018). While many countries across Sub-Saharan Africa (SSA) depend on maize as their staple crop, South Africa is unique in that it ranks as the 9th and 11th highest global per capita consumer of beef and poultry, respectively (OECD-FAO, 2021). In 2021, South Africans were estimated to consume 17.45 kg of beef per capita (South African Abstract of Agricultural Stats, 2022). As such, droughts and extreme heat events in South Africa will continue to affect food security through maize (the staple crop) and beef (of which maize is an input) consumption. This will become more problematic as weather and climate volatility are expected to increase in Southern Africa with both warmer temperatures and dryer conditions under global climate change (Dosio et al., Reference Dosio, Jones, Jack, Lennard, Nikulin and Hewitson2019; Maure et al., Reference Maure, Pinto, Ndebele-Murisa, Muthige, Lennard, Nikulin, Dosio and Meque2018)
Although globally and in South Africa, beef demand remains strong and proliferating in many parts of SSA, some consumers report their desire to cut back on beef consumption and replace it with alternatives (Van Loo et al., Reference Van Loo, Caputo and Lusk2022; Neff et al., Reference Neff, Edwards, Palmer, Ramsing, Righter and Wolfson2018). Innovative products have emerged, giving consumers new plant-based protein alternatives similar to ground beef. It is estimated that plant-based protein could make up 7.7% of the global protein market by 2030, with a value of over 162 billion USD, up from 29.4 billion in 2020 (Bloomberg, 2021). In South Africa specifically, the sales of plant-based meat substitutes grew by 6.5% in 2021, and sales are expected to reach 561 million USD by 2023, which would account for more than half of the alternative meat market for the African continent (Reuters, 2022). A 2021 survey of 959 South Africans revealed a positive consumer attitude toward meat substitutes. The study found that 67% of South African survey participants were highly likely to try and 59% were highly likely to purchase plant-based beef while 60% were highly likely to try, and 53% were highly likely to buy lab-cultured meat (Szedja et al., Reference Szedja, Stumpe, Raal and Tapscott2021). Most of the research on alternative protein acceptance amongst consumers has originated in the United States, Europe, and Asia, with little attention given to the African continent. Some previous studies investigated consumer willingness to try or purchase intentions for lab-grown meat (Bryant et al., Reference Bryant, Szejda, Parekh, Desphande and Tse2019; Wilks and Phillips, Reference Wilks and Phillips2017), but no study investigated the consumers’ willingness-to-pay (WTP) or demand at alternative price points in South Africa. This study attempts to fill this gap by providing a snapshot of South African consumers’ WTP for alternative protein sources.
Alternative protein in South Africa
There has been substantial startup capital in South Africa invested in developing plant-based (The Fry Family Food Co., Urban Vegan, Linda McCartney, Beyond Meat, and others) and lab-grown (Mzansi Meat) burger patties in the last decade (Madubela, Reference Madubela2023). Lab-grown meat can go by other synonyms such as cultured, clean, cell-based, artificial, tissue-engineered, in vitro, synthetic, animal-free, and test tube meat and will be referred to as lab-cultured meat in this study. Plant-based burger patties, the common introductory product to the alternative meat sector, have been developed to mimic traditional beef patties in texture, taste, and sight. These plant-based meat alternative burger patties are now available in many large grocery stores (Spur, Checkers, Woolworths, and others) and fast-food outlets (Burger King) across South Africa (Vegan South Africa, 2023). In addition to the new plant-based burgers, South African startups like Mzansi Meat Company are developing meat by lab-culturing animal cells. These lab-cultured meat patties will likely become available to consumers in the coming years. In June of 2022, the Mzansi Meat company said they “hope to get the go-ahead from the South African Government to sell its [their] products to restaurants in 12 to 18 months” (Stark, Reference Stark2022).
Alternative meat gained political attention in South Africa in 2022 when South Africa’s Department of Agriculture, Land Reform and Rural Development (DALRRD) sent a letter to all processors, importers, and retailers of meat analogs, which imposed a ban on “meaty” names for plant-based meat alternatives. The letter also instructed the Food Safety Agency, the assignee designated for the inspection of processed meat products, to seize and remove any plant-based products using names that traditionally refer to animal-based products in terms of section 8 (“Seizures”) of the Agricultural Product Standards Act 199 of 1990 (SA DALRRD, 2022). DALRRD issued notices to producers and suppliers warning that product names for plant-based sausages, burgers, strips, and other similar products must be relabeled or destroyed. The day the seizures were set to begin, the Johannesburg High Court ruled to stop the forceable removal of products from shelves at least until a court can decide on the merits of arguments from producers and retailers that the government’s stance is illogical and harmful to consumers. Regardless of the injunction, the damage had been done. Some companies, such as the US-based Beyond Meat, canceled all deliveries of meat alternatives to South Africa for fear of future seizure (Mashego, Reference Mashego2022). An extension of the court order means that meaty-monikered plant-based goods will remain available and can legally be sold, but beyond that, their future is unknown as legal cases are still ongoing.
A key constraint in meeting South Africa’s meat consumption demand since 2015 has been the prolonged periods of drought. The impact of the 2015/2016 drought is still felt across the South African livestock sector. Farmers eliminated large numbers of livestock at the height of the drought, reducing the herd. It was not until the rains returned in 2017 that South African farmers started rebuilding their livestock herds, but the number of animals available for slaughter had been reduced substantially, leading to a decline in meat output by 11.9%, the lowest since 2013 (Oirere, Reference Oirere2019). While this post-drought heard building was necessary to ensure long-term national food security, consumers were faced with higher prices in the short term, contributing to increased household food insecurity. The drought devastated the beef cattle market as the lack of rainfall meant that cattle could not be grazed, and yellow maize (a key cattle feed ingredient) price was at a historically high level of $306 per ton, increasing 50% in price from the end of 2015 to the end of 2016. Coupled with the South African Rand depreciating by 45% to the USD between February 2015 and February 2016, hampering importsFootnote 1 resulted in a severe food security issue, given that the South African diet relies heavily on beef and maize (Deloitte, 2017).
Given the increase in both market share and political attention, this study aims to provide a better understanding of consumer acceptance, choice, and WTP for two plant-based patties (using pea protein and animal-like proteins produced by yeast) and one emerging (lab-cultured beef) alternative meat product relative to conventional beef, and consumer’s preferences for policies surrounding these alternatives. The literature on WTP for alternative meat in South Africa is scarce, although it’s among the highest per capita meat consumers globally. While Szedja et al., (Reference Szedja, Stumpe, Raal and Tapscott2021) investigated consumer willingness to try or purchase lab-cultured meat, no study has investigated the consumers’ WTP and market shares for meat substitutes at alternative price points in South Africa. This study attempts to fill this research gap following the methodology used by Van Loo et al. (Reference Van Loo, Caputo and Lusk2022) for WTP for alternative meat products in the United States. We use a discrete choice experiment (DCE) with different information treatments, including environmental impact metrics and information describing each alternative meat product’s technology to develop its burger patty to elicit demand and WTP. The results from this study, the first of its kind in Africa, will shed light on potential market shares of alternative meat products and provide guidance on consumer sentiment on labeling alternative meat products, given its recent political scrutiny.
Materials and methods
Survey
A labeled DCE was created where participants were asked to choose between four burger patties options offered at varying price levels. There were three screening questions for survey participants. The participants had to be at least 18, eat burgers, and buy at least half of the groceries for their respective households. The survey was terminated if a participant did not meet these three questions. Participants could choose from four burger patties: lab-grown/cultured beef, plant-based meat animal-like heme protein, plant-based meat using pea protein, and conventional beef patties. These options were priced at six levels ranging from 50 ZAR/400 g to 195 ZAR/400 g in 29 ZAR increments.Footnote 2 This price range was selected to encompass the average prices for four premade ground beef patties, at 100 g each, and the costs for plant-based (such as Beyond Meat) and conventional beef burger patties in actual grocery stores across South Africa around the time of the study, in 2022. While R195 for 400 g of conventional beef patties in South Africa would be considered to be expensive, higher prices were needed to capture the actual price of name-brand alternative meat patties (Beyond Meat) and with consideration of expected higher prices of lab-cultured meat. Figure 1 shows an example choice set provided to participants.
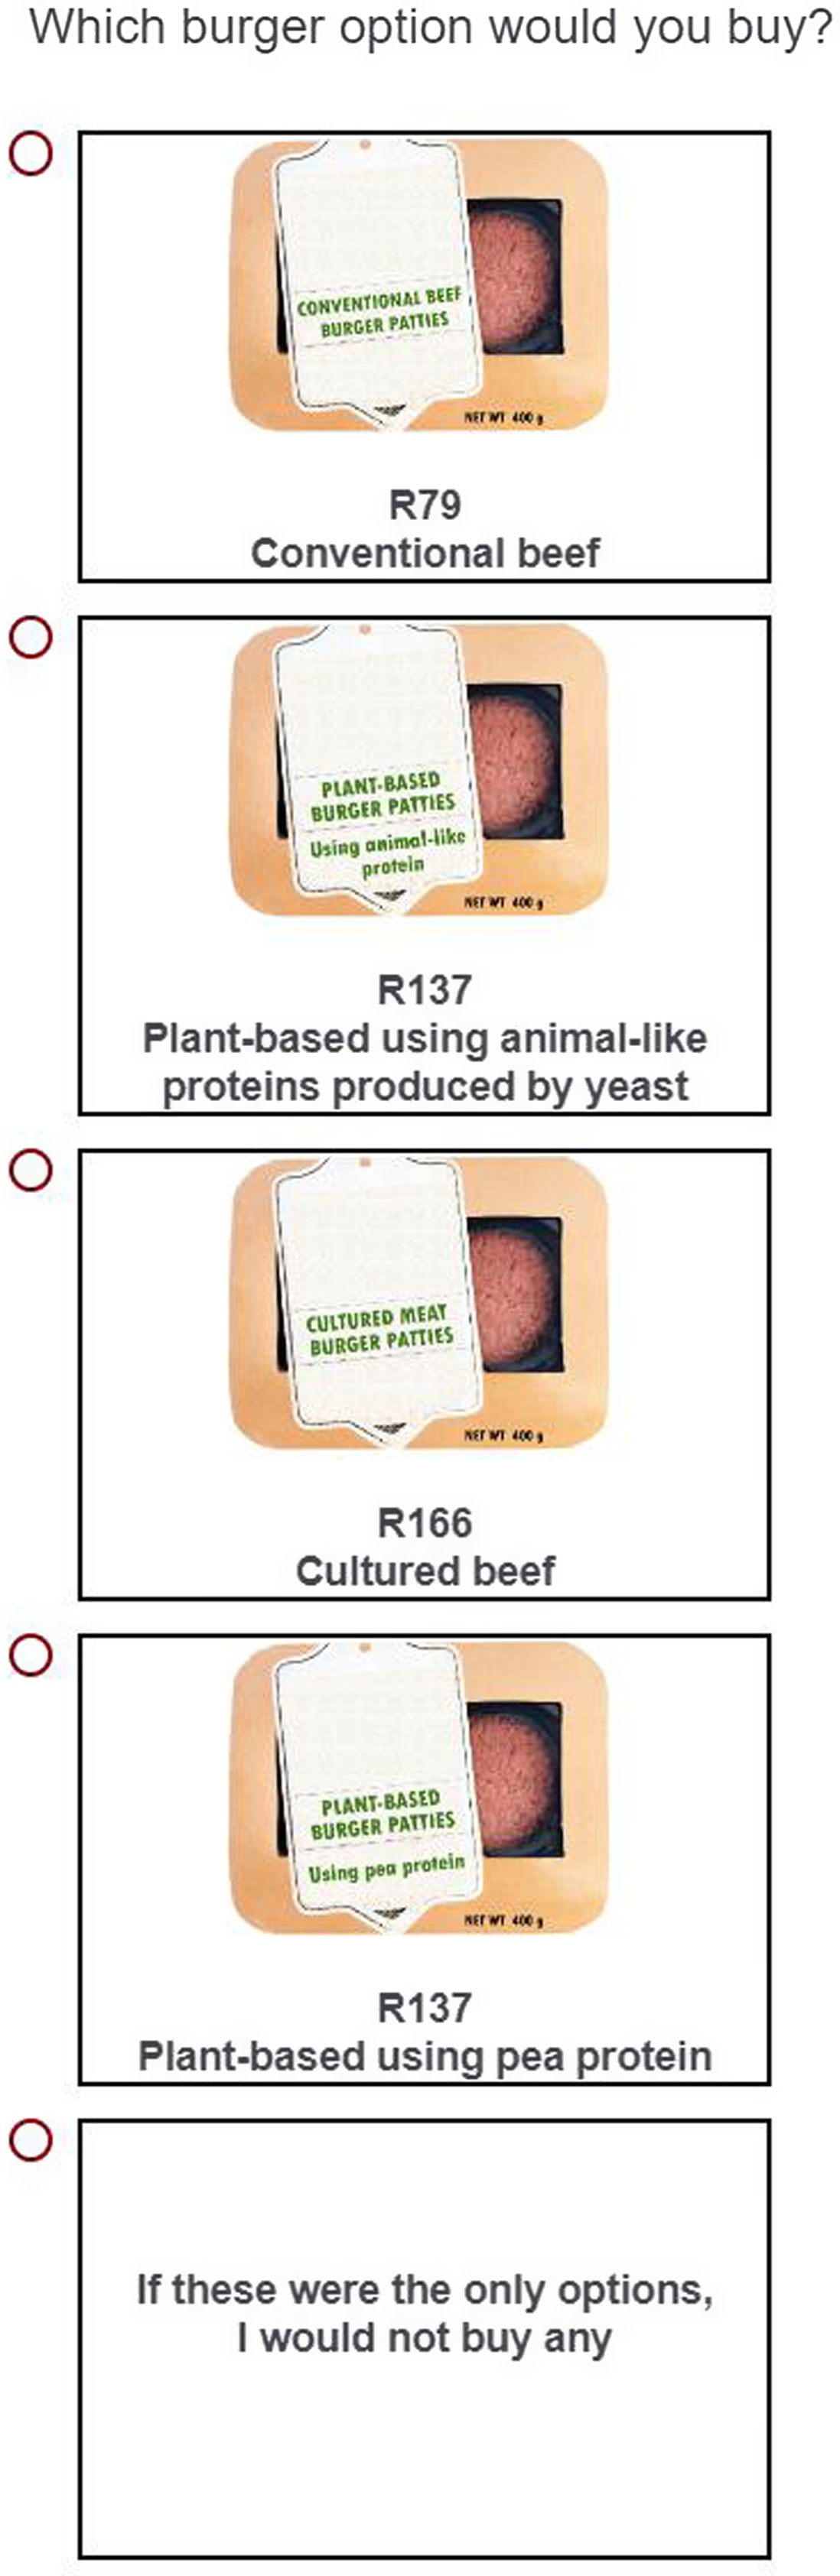
Figure 1. Example of one of the choice sets provided to survey participants.
This study used a between-subject approach to examine the effects of information on consumer preferences for the three alternative meat products. This was important because a general survey conducted on plant-based meat and cultured meat in South Africa found that 44 and 45% of respondents had no familiarity with either product, respectively (Szedja et al., Reference Szedja, Stumpe, Raal and Tapscott2021). Respondents were randomly assigned to one of three treatment groups (Control, Environmental Information, and Technological Information). Depending on the treatment group, participants received additional information before answering the choice experiment questions. Next, they also received the instructions that they should imagine themselves shopping for burger patties in a grocery store, and a short cheap-talk script was given in an attempt to mitigate hypothetical bias.Footnote 3
In the control treatment (Control), participants were not provided any information about the three meat alternatives, which were only labeled using a few words. It is common for producers of plant-based meat alternatives to provide consumers with information about their products' environmental and animal welfare benefits compared to conventional meat. Beyond Meat, for instance, provides metrics such as the reduction in land needed, Greenhouse Gas (GHG) Emissions, water usage, and total energy required between their product and conventionally raised beef to potential consumers via its website (Beyond Meat, 2023). Treatment 2 (Sustainability) gave respondents environmental and animal welfare information from companies selling alternative meat products to test the effect of advertising these environmental metrics on consumer preference. More specifically, respondents were shown the reduction in water use, land use, energy use, and GHG emissions associated with each of the three beef alternatives compared to conventional beef, based on literature (Tuomisto and Teixeira de Mattos, Reference Tuomisto and Teixeira de Mattos2011; Van Loo et al., Reference Van Loo, Caputo and Lusk2020) and company claims. Figure 2 shows the information given to participants in Treatment 2.
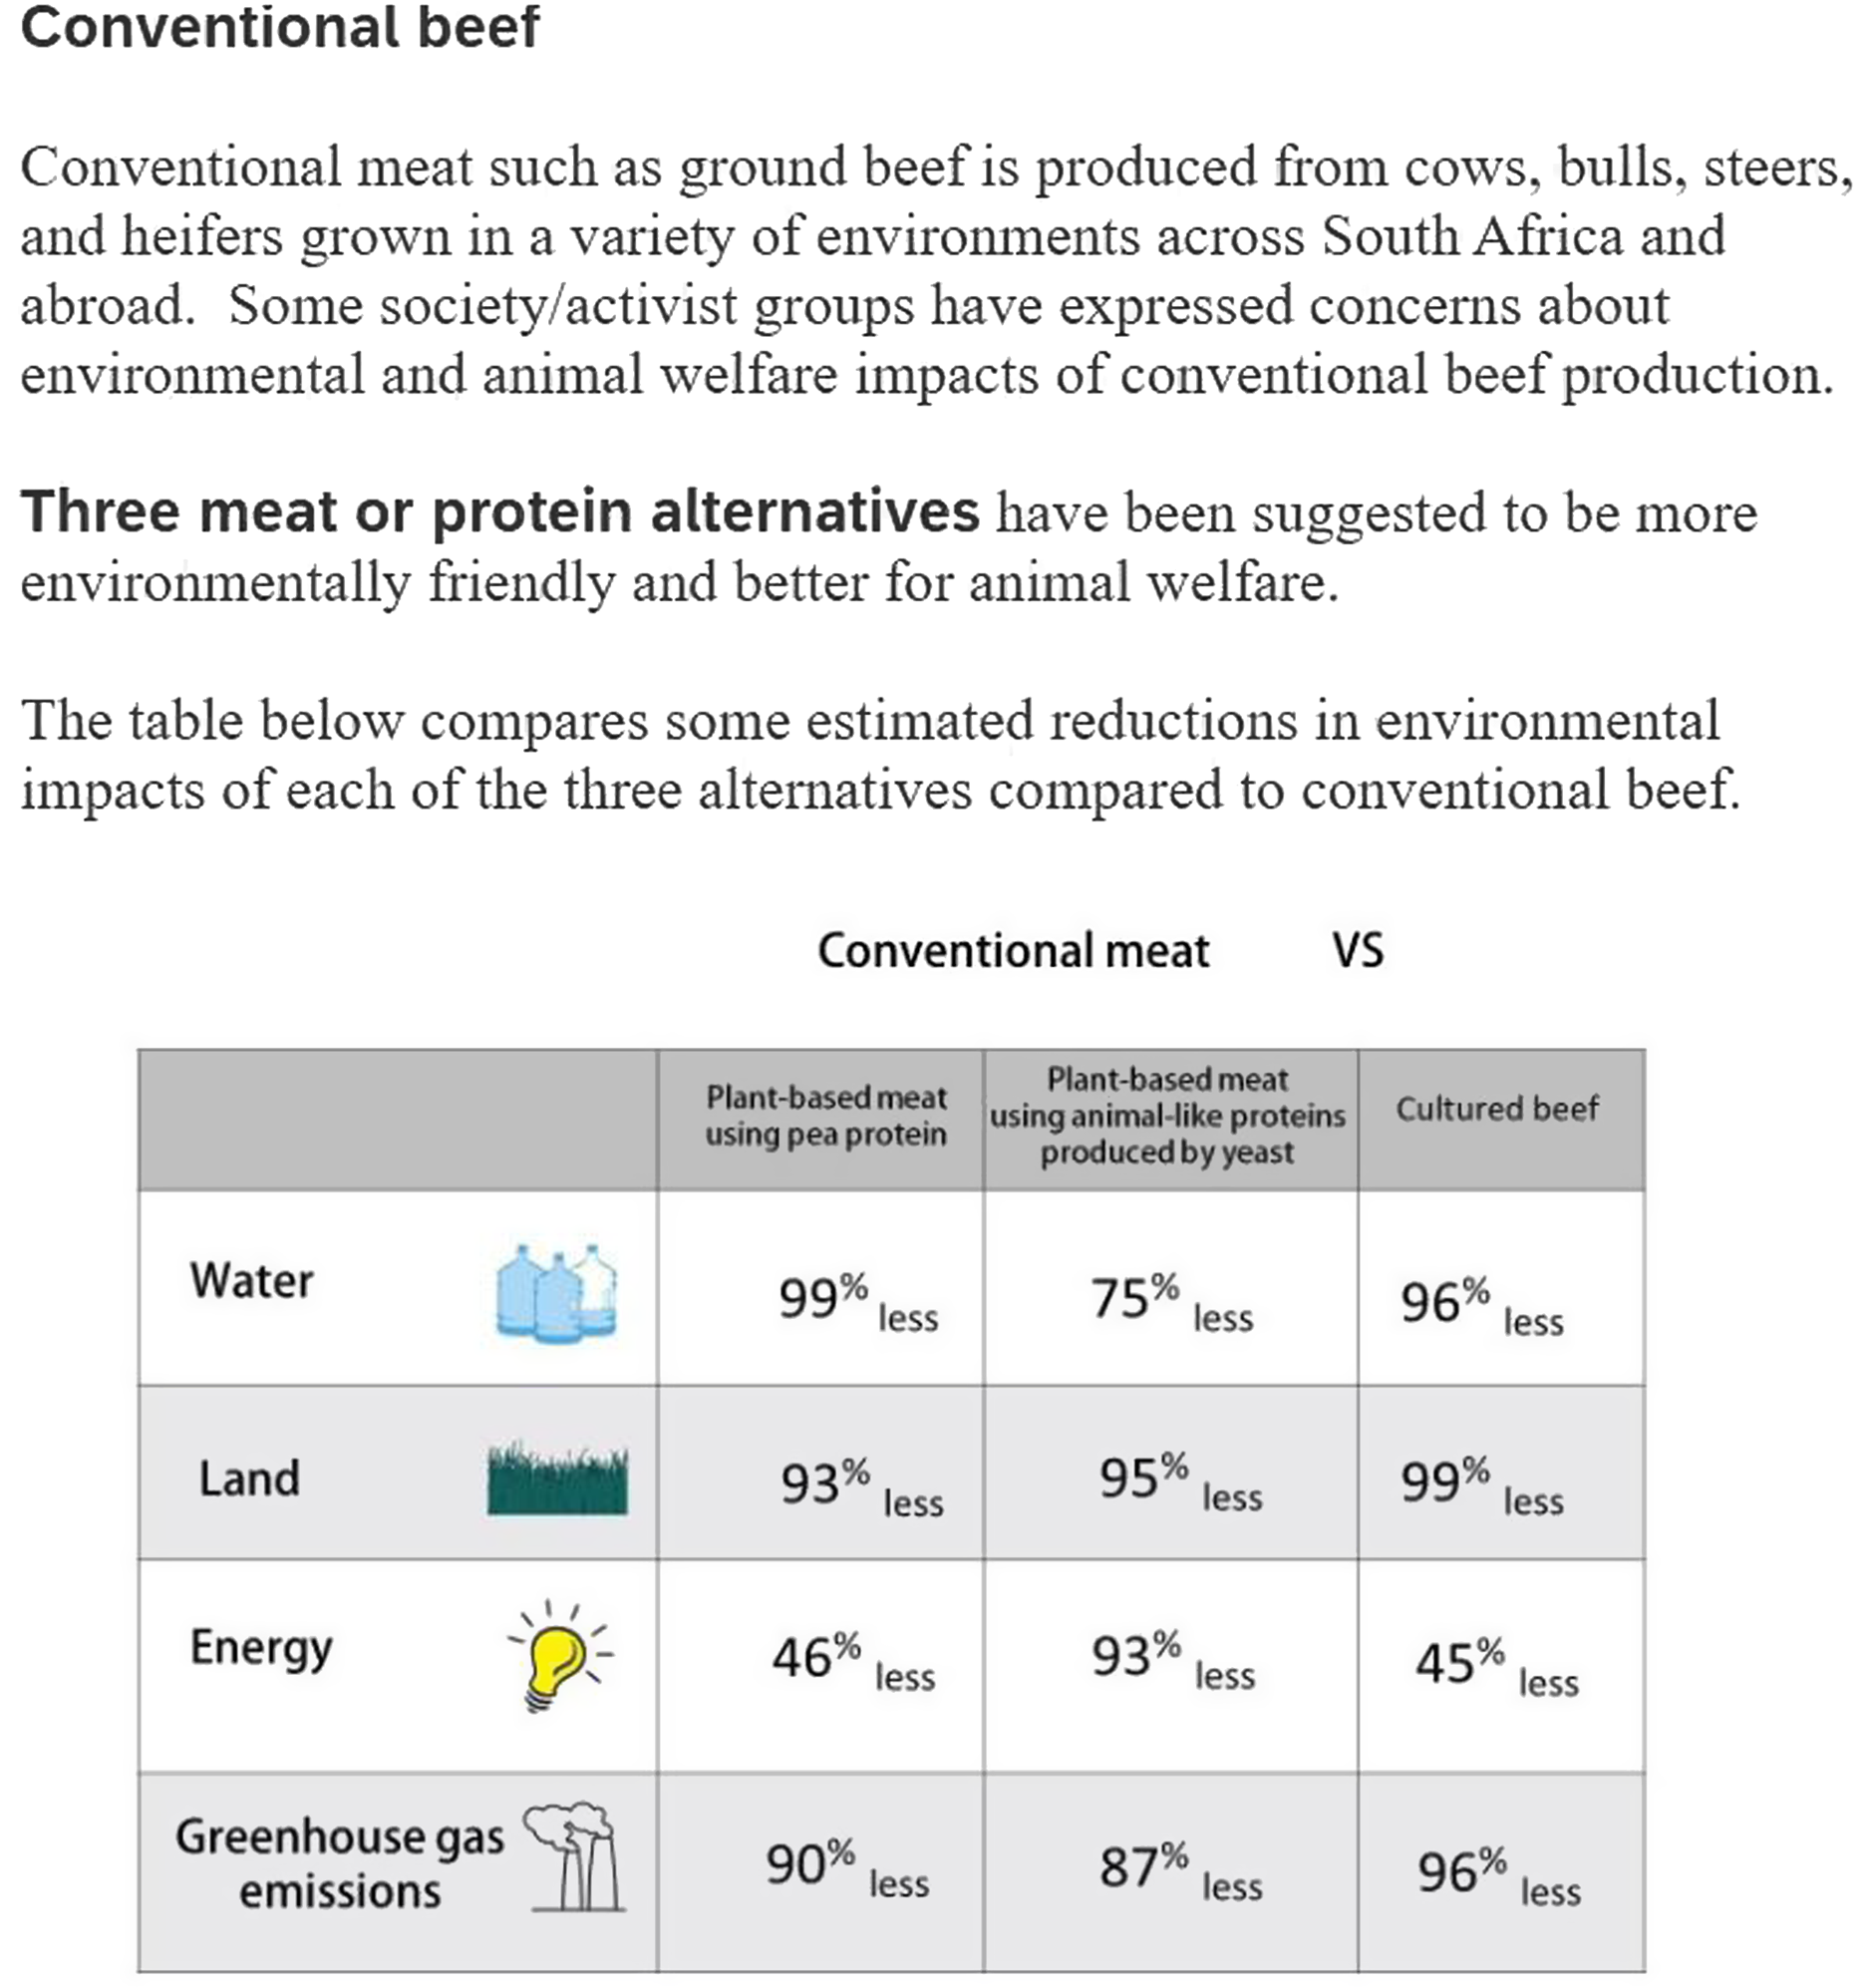
Figure 2. Sustainability information given to participants for Treatment 2.
Given that previous studies (Szedja et al., Reference Szedja, Stumpe, Raal and Tapscott2021) found relative unfamiliarity with meat-based alternatives in South Africa, Treatment 3 (Technology) was provided to give insight to consumers on how each of the three alternative meat products was produced. Figure 3 shows the information given to participants in Treatment 3. Each treatment group (Control, Sustainability, and Technology) answered the same 12 pricing choice questions, with four meat options (three alternatives plus conventionally raised meat) and a no-buy for each question. The labeled design for the CE was created in Ngene, where a Bayesian design was implemented, resulting in a total of 48 choice questions. While there are limited ways to prevent survey fatigue and participants employing heuristics between choice sets, the survey included an attention check in an attempt to mitigate these issues.
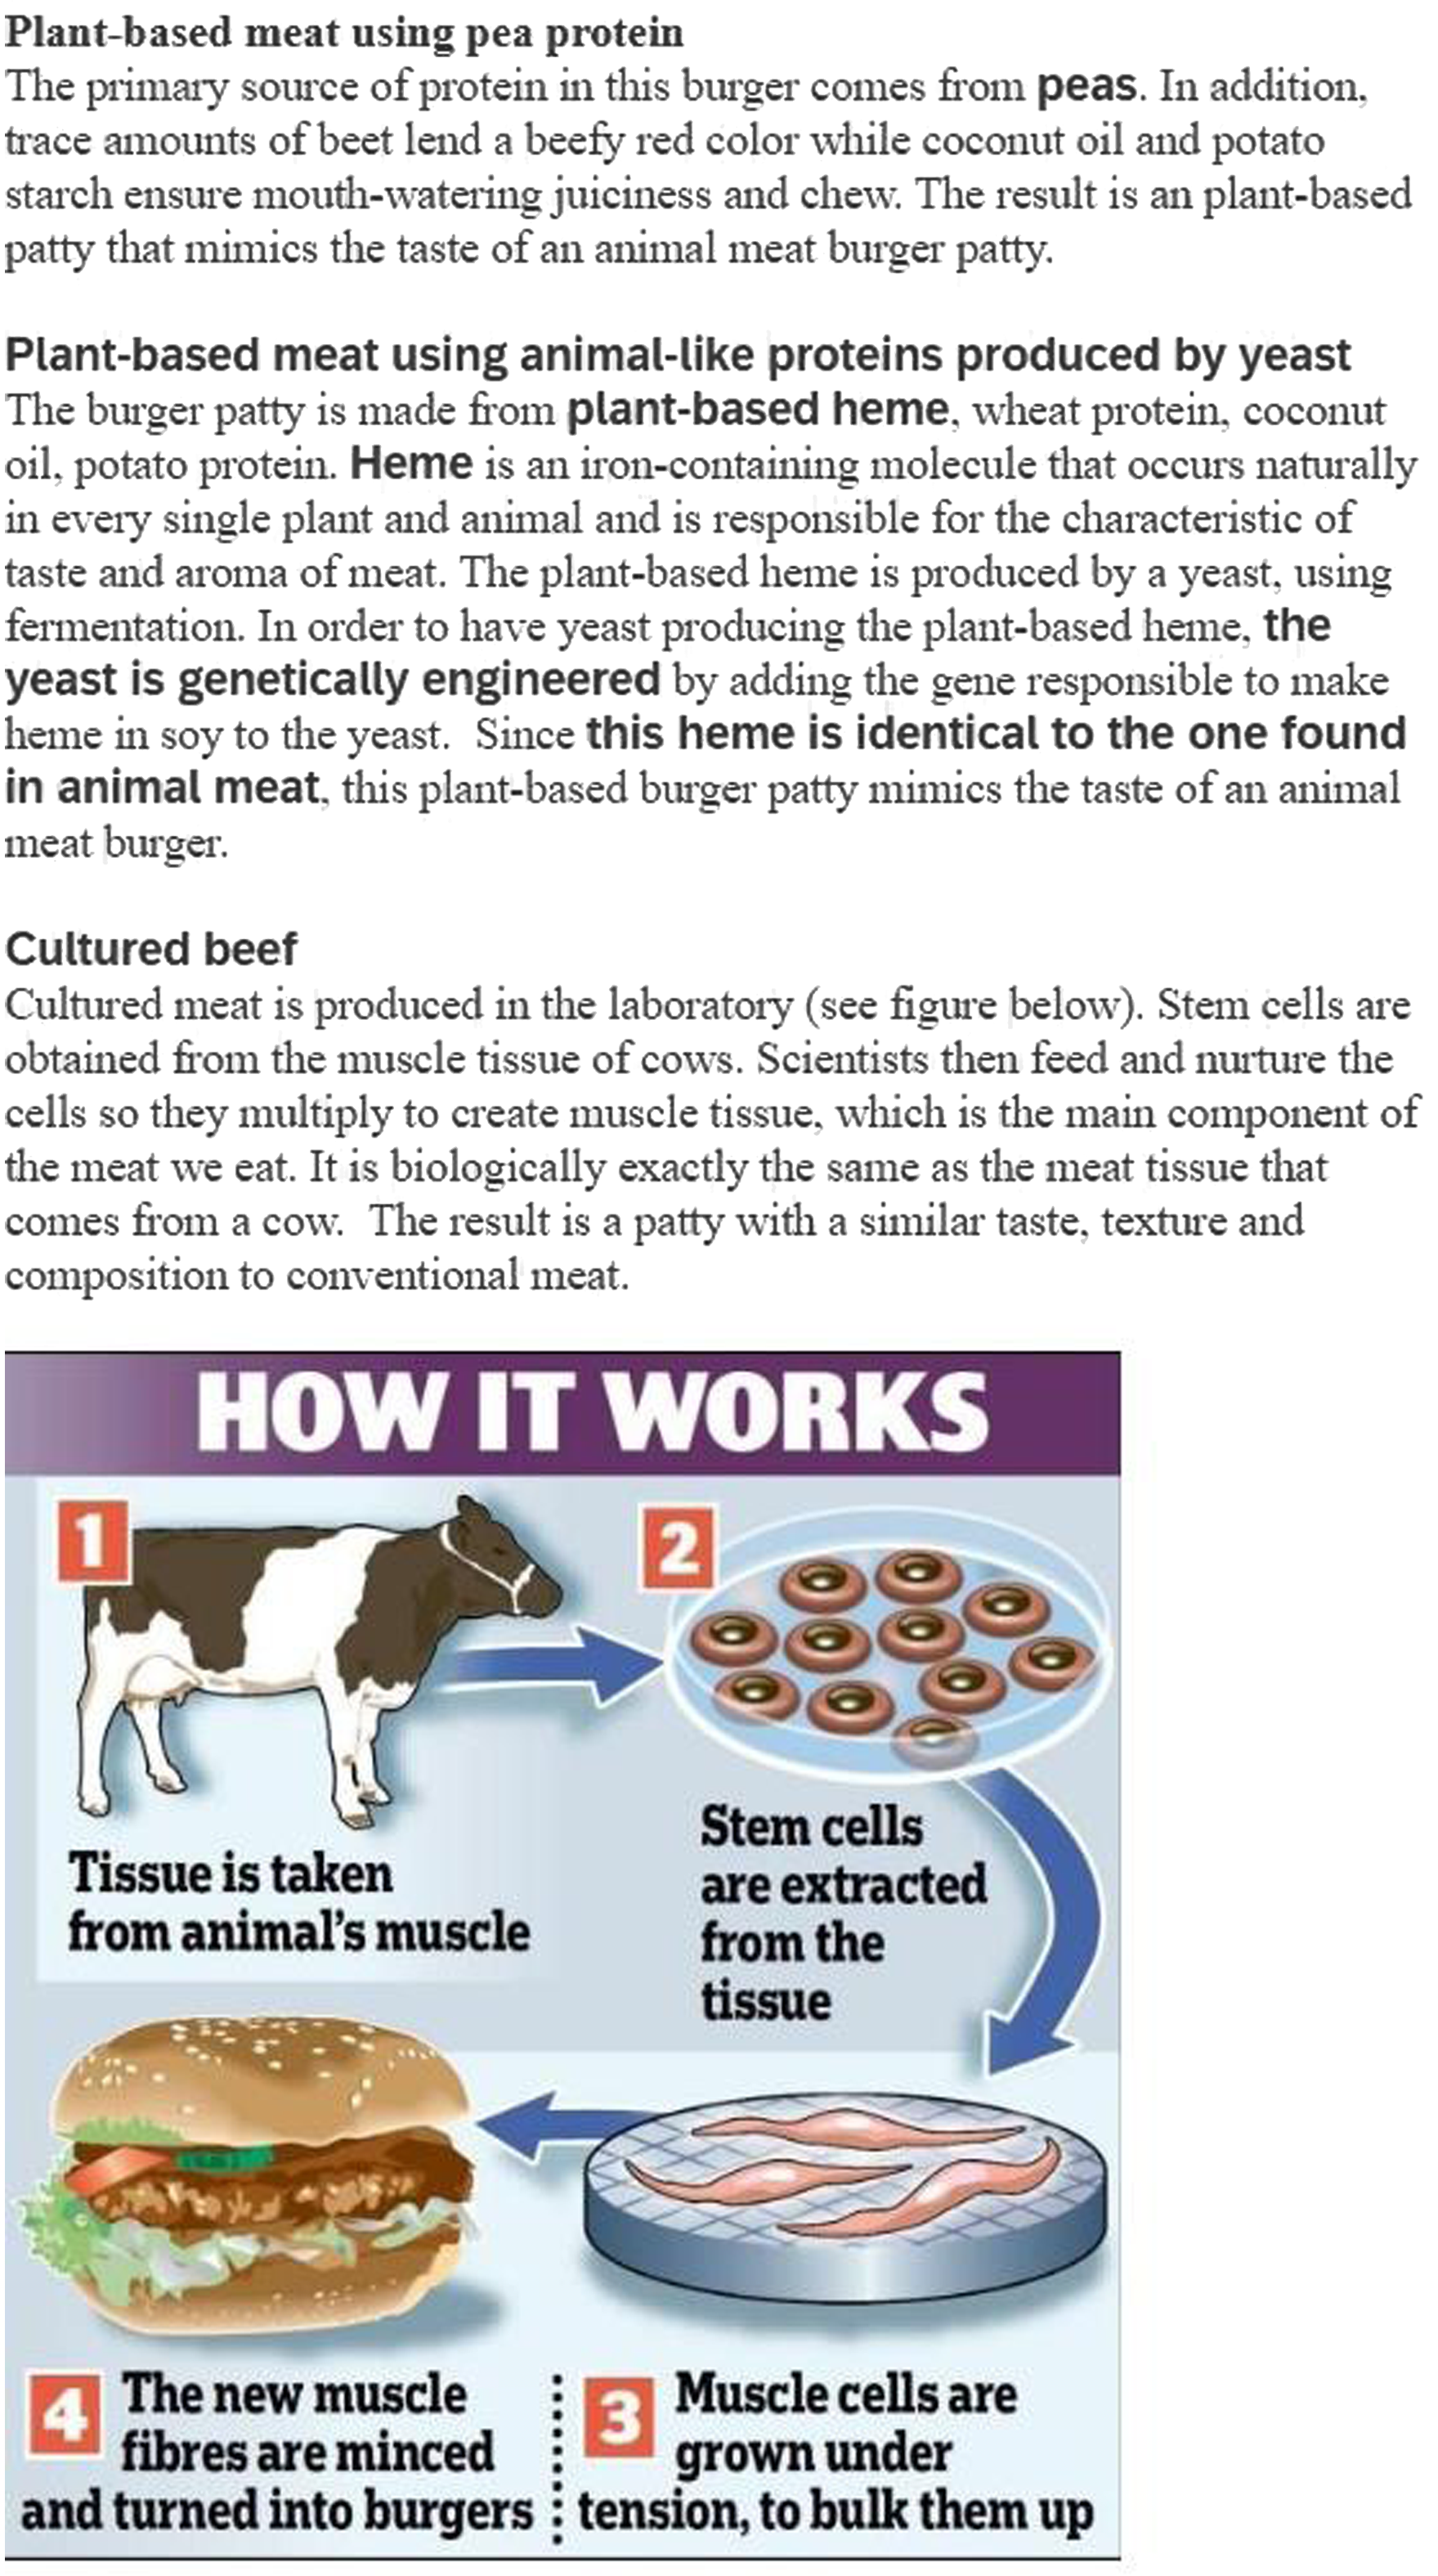
Figure 3. Technology information given to participants for Treatment 3.
After the DCE, participants were asked several questions about their familiarity with and purchasing habits of alternative meat products. Further, given the recent legal and political debate about alternative meat in South Africa, participants were asked about their thoughts regarding labeling laws for meat alternatives, such as using meat-related terms like burger or sausage to describe meat-free products. Specifically, we asked, “In your opinion, should food companies be permitted to use meat-related names like “sausage,” “burger,” and “steak” to describe meat-free vegetarian products?” To address the concern that the South African government had that alternative meat marketing campaigns using phrases like “burger” could influence consumer decision-making, we asked the following: “Are you more or less likely to buy a vegetarian product if it is labeled with words associated with meat, like “sausage,” “burger,” and “steak”?”.
The data were collected through a nationwide online survey amongst South African grocery shoppers from March to April 2022. The survey was programed in Qualtrics, and participants were recruited by a market research agency (Dynata), which tried to provide a representative sample of the South African population regarding gender, age, race, and income. Any survey that was incomplete or was finished in under five minutes was discarded from the analysis. In total, 649 completed responses were collected and used in the analysis.Footnote 4 University of Arkansas IRB approval (protocol #2202386371) was granted on March 28, 2022.
Econometric model
Discrete choice experiments like the one used in this study are consistent with random utility theory (McFadden, Reference McFadden and Zarembka1973). Within this framework, survey participant n is assumed to derive utility from choice alternative, j: U nj = V nj + ɛ nj; where V nj is the systematic component of the utility function, and ɛ nj is the random component. V nj is defined as:
 $${V_{nj}} = {\beta _j} + \alpha Pric{e_{nj}}$$
where β j is an alternative-specific constant representing utility for alternative product j relative to the no-buy option, which is normalized to zero, α is the marginal utility of price, and Price nj is the price of alternative j provided to participant n.
The data were analyzed using a random parameter logit (RPL) model, accounting for consumer preference variation. The coefficients in Equation 1 were assumed random following empirically plausible normal distributions. The alternative-specific constants were specified as random following a normal distribution, as individuals could exhibit either positive or negative preferences for each meat product. The unconditional (when a participant has the option to choose no-buy) choice probabilities of individual n choosing alternative j are expressed as follows in the RPL:
 $$\left\{ {{P_{nj}}} \right\} = \int_{{\beta _n}}^{} {\int_{{\alpha _n}} {\prod\limits_{t = 1}^T {{{{V_{njt}}} \over {\sum\nolimits_j {{e^{{V_{njt}}}}} }}} } }\ f\left( {{\beta _n},{\alpha _n}\left| {\mu, \varphi } \right.} \right)d{\beta _n}d{\alpha _n}$$
where f(β n,α n|μ,φ) is the probability density function of the vector J random effects coefficients, < β n, α n>; μ is the vector of price coefficient and the alternative-specific constants, and φ is the variance-covariance matrix of the random vector parameters. The models were estimated by simulated maximum likelihood estimation using 500 Halton draws, similar to Train (Reference Train2009). The normally distributed coefficients provide information on the population proportion that attaches a positive value to a specific meat product. The population shares, which have positive and negative values for each product, are calculated. The mean value for WTP of each meat product alternative was estimated as a negative ratio, where the numerator is the estimated mean value of the coefficient associated with the alternative, and the denominator is the estimated price coefficient Van Loo et al. (Reference Van Loo, Caputo and Lusk2020). Based on the RPL estimates, the predicted conditional (not choosing the no-buy) and unconditional market share for each meat product or meat alternative was calculated, following Lusk and Tonsor (Reference Lusk and Tonsor2016) and Van Loo et al. (Reference Van Loo, Caputo and Lusk2020). The estimated coefficients from the RPL were substituted into probability equations, setting all prices equal to 125 ZAR/400 g. This allowed the estimation of market shares for each meat and meat alternative product across different information treatments when all prices were held constant. Econometric modeling was conducted in R using the gmnl and mlogit packages.
Results
Table 1 shows the characteristics of the sample used in the study compared to the South African population. The sample had an overrepresentation of the Gauteng province population and the White population and was overeducated relative to the general South African population.
Table 1. Sociodemographic characteristics and purchasing behavior of the sample in percentage

aSouth African percentage calculated as a percentage of country above 18.
bSouthern Africa Labour and Development Research Unit (2023).
Pooled model
Table 2 illustrates the RPL estimates for each of the three treatments. The price coefficient was statistically significant (P < 0.05) and negative for each treatment and product type, indicating reduced utility with increased prices. The coefficients for conventional beef, plant-pea-based protein, and plant-yeast-based protein are statistically significant (P < 0.05) and positive, indicating that when the price is held constant, survey participants preferred buying one of the meat products versus nothing at all. Conventional beef was the most preferred, followed by lab-cultured beef, plant-based pea protein, and plant-based yeast protein options for the control treatment. Of interest is the significance (P < 0.05) for lab-cultured beef in all treatments, indicating that the utility of lab-cultured beef is greater than the no-buy option. Interestingly, lab-cultured beef was the most preferred in the Sustainability and Technology treatments.Footnote 5
Table 2. RPL model results by treatment

Standard errors are in parentheses.
All variables were significant at the P < 0.05 level.
Negative standard deviation coefficients should be evaluated as an absolute value (Brownstone and Train, Reference Brownstone and Train1999).
Table 3 reports the mean WTP (ZAR/400 g) for the meat alternatives and conventional meat across the three treatments. The results indicate that conventional beef had the largest WTP, compared to no buy, in the control treatment, followed by cultured meat, pea protein, and yeast protein, respectively. Consumers were estimated to have a marginal willingness to pay premium of 8.50 ZAR/400 g for conventional burger patties compared to lab-cultured patties. Comparing treatments 1 (Control) and 2 (Sustainability) resulted in lab-cultured meat leaping conventional beef regarding the highest WTP. Consumers were estimated to be willing to pay a premium for lab-cultured meat compared to conventional burger patties when provided the sustainability/environmental metrics (marginal willingness to pay the difference of 7.08 and 10.98 ZAR/400 g, respectively). A similar study in the Netherlands found that 58% of Dutch participants were willing to pay a premium for lab-cultured meat of, on average, 37% above the price of conventional meat (Rolland et al., Reference Rolland, Markus and Post2020).
Table 3. Mean and marginal willingness to Pay (WTP) (ZAR/400g) from the pooled random parameter logit models

a WTP estimates are relative to the no-buy option and are derived from the estimated coefficients in Table 2. WTP estimates are correctly reported here, but because of rounding on Table 2, the WTP calculated as the negative ratio of the mean value of the coefficient associated with the alternative and the estimated price coefficient are slightly different.
b Marginal willingness to pay was calculated by bootstrapping the gmnl model coefficients to 10,000 draws, then subtracting the coefficients for two meat product coefficients (X,Y) divided by the negative price coefficient (Cx-−Cy)/-−Cp from the RPL model presented on Table 2. Significance tests between the MWTP values were run using a z test and all coefficients are significant at the P < 0.05 level.
While this study is the first to estimate WTP for alternative meat products in South Africa, Szedja et al. (Reference Szedja, Stumpe, Raal and Tapscott2021) surveyed 1,087 South Africans about “if” they would be willing to pay more for alternative meats. Their results found that the likelihood to pay more for both plant-based protein alternatives and lab-cultured meat: 31.5% of participants were highly likely to pay more for plant-based meat, and 30.1% of participants were highly likely to pay more for cultivated meat, suggesting there could be a premium, like those found in this study, for lab-cultured meat.
Figure 4 shows the conditional (on consumers choosing one of the products) and unconditional (the no-buy option is a possibility) market shares across all treatments when all products were priced at 125ZAR/400 g. When no information is provided (Control), the market share of conventional beef is 40%, followed by cultured beef at 38% and the two plant-based proteins at 21% (combined). While this seemingly appears like a high market share for cultured beef relative to conventional beef, Szedja et al. (Reference Szedja, Stumpe, Raal and Tapscott2021) found that 60% of South Africans were highly likely to try, and 53% were highly likely to purchase cultured beef. As such, the novelty of this study’s new product alternative (lab-cultured meat) could have given rise to a relatively high market share. Given that this study was hypothetical, the cultured meat market share could be inflated given the fact that consumers did not have to consume the product. However, these results are in accordance with earlier quantitative studies spread through Europe (Flycatcher, 2017; Verbeke et al., Reference Verbeke, Sans and Van Loo2015), the US, and parts of Asia (Bryant et al., Reference Bryant, Szejda, Parekh, Desphande and Tse2019; Wilks and Phillips, Reference Wilks and Phillips2017), which found consumers were in favor of cultured meat.

Figure 4. Conditional (conditional on buying an option) and unconditional market shares (%) for each treatment group. The “none” option for the unconditional market share represents the percentage of consumers who choose the no-buy option.
Providing sustainability information (Treatment 2) increases the share of lab-cultured meat and plant-based alternative protein to 36 and 25%, respectively, while the share of plant-based alternatives using animal-like proteins produced by yeast remains unchanged. Technological information results in a 35% share of lab-cultured meat and 28% combined for both plant-based alternatives. This illustrates that providing information has only a small effect on the market shares of the various meat alternatives. Providing additional information, both Sustainability and Technological information, increased the market share for both the plant-based proteins (4 and 7% for the Sustainability and Technology information, respectively) and reduced it for lab-cultured meat, although marginally.
The unconditional market shares in Figure 4 indicate that providing more information on meat alternatives pulls more market share into plant-based proteins and away from the no-buy option. Providing more information about conventional meat alternatives appears to increase the total market size of those consuming burgers rather than reducing the overall market share for conventional beef burgers, as the average market share of conventional burgers remained nearly the same (around 36%) when both sets of information were provided. Importantly, regardless of including the no-buy option (conditional or unconditional) or information treatment, the market share for lab-cultured meat had high gravity of around 36%. Additional information affected the market shares of conventional beef and plant-based proteins more than lab-cultured meat. Regardless of the type of information about meat alternatives internalized by survey participants, plant-based and lab-cultured meat alternatives represent a market share of at least 20 and 34%, respectively. While this study is the first of its kind to estimate market shares for alternative meat products in South Africa, Szedja et al., (Reference Szedja, Stumpe, Raal and Tapscott2021) asked South African survey participants, via a Likert scale, to provide the percentage that plant-based, lab-cultured meat and conventional meat would contribute to their annual meat consumption, once plant-based and lab-cultured meat becomes widely available and affordable. They found that lab-cultured meat would contribute 30.3% of annual meat intake, an estimate that falls within our range of RPL-derived market shares.
Table 4 indicates the likelihood of survey participants purchasing one of the alternative meat products in the future. Interestingly, across all subsets (race and age), consumers said they were more likely to purchase cultured meat in the future than the two plant-based alternatives. The two highest purchase likelihoods were cultured meat amongst Black and young South Africans. The results in Table 4 are similar to other findings (Szedja et al., Reference Szedja, Stumpe, Raal and Tapscott2021), who found that 53% of South Africans would purchase cultured meat (if available), which suggests that South Africans are open to trying alternative meats, even with regard to cultured meat.
Table 4. Mean values of likelihood to purchase alternative meat products by race and age

1 = No, definitely not; 2 = No, probably not; 3 = Unsure; 4 = Yes, probably and 5 = Yes, definitely.
Note: Standard deviations are in parentheses.
By race
Figure 5 shows the conditional market shares for each meat type by race categories: Black, White, and other (Indian, Colored [mixed race], and other) market shares across all treatments when all products were priced at 125ZAR/400 g.Footnote 6 Because colonialism played an important role in South Africa, different populations or ethnic groups each contributed different meat consumption patterns, which today are still relevant (Erasmus and Hoffman, Reference Erasmus and Hoffman2017). The South African context of meat is deeply rooted in the people’s heritage. The demand is greatly influenced by its availability, price, and traditional usage, as well as the consumer’s associations and perceptions, which can be associated with ethnic or tribal heritage (Erasmus and Hoffman, Reference Erasmus and Hoffman2017). In addition, different ethnic groups in South Africa have various cuisines made from other domesticated meats, including game animals. Consequently, there is a possibility that meat alternatives will be viewed as inferior to those consumers with strong sociocultural attachments to meat eating (Gbejewoh et al., Reference Gbejewoh, Marais and Erasmus2022). These ethnic differences can be seen in Figure 5, where Black South Africans appear more willing to accept lab-cultured meat than White South Africans. In the Control treatment (no information), the market share for lab-cultured meat was 47% for Black South Africans and 19% for White South Africans. The market share for lab-cultured meat increased for White South Africans as they were presented with more information (Treatments 2 and 3) but never reached over 38%.

Figure 5. Conditional (conditional on buying an option) market shares (%) by race for each treatment group. Other includes Indian, colored [mixed race], and other races.
Conversely, the lab-cultured meat market share for Black South Africans was the highest (47%) with no information (Control) and decreased with additional information but never got below 40%. Interestingly, market share seems to fluctuate the most (across all three race sub-samples) for lab-cultured meat and conventional beef, with the two plant-based proteins having a consistent market share across races and information sets.
By income
Previous studies have shown that cultured meat could appeal more to lower-income consumers in the U.S. than higher-income consumers in India (Bryant et al., Reference Bryant, Szejda, Parekh, Desphande and Tse2019; Bryant and Barnett, Reference Bryant and Barnett2020; Wilks and Phillips, Reference Wilks and Phillips2017). When regressing income on the future purchase intention of lab-cultured meat in South Africa, Szedja et al. (Reference Szedja, Stumpe, Raal and Tapscott2021) found a negative and statistically significant relationship, indicating that lower-income South Africans had a greater intention of purchasing lab-cultured meat than high-income South Africans. The University of South Africa (UNISA) developed income brackets for segmenting South Africans by income (Table 1), which were adopted for this study. While UNISA had seven original income classifications, we used five, collapsing the three richest segments into one. The annual income brackets used and their definition from UNISA are poor (R0–R54,344), low-emerging middle class (R54,345–R151,727), emerging middle class (R1 51,728–R363,930), realized middle class (393,931–R631,120), and affluent (>R631,120).Footnote 7
Figure 6 highlights the market share by race and income group, holding the price constant at R125 for 400 g of a given product.Footnote 8 Unconditional market shares were used when analyzing income to allow participants, specifically those in lower income brackets, the ability to select the no-buy option. Several themes emerge from Figure 6, with the first being that market shares for Black South Africans were relatively stable across income brackets: 26–32% for conventional beef, 21–31% for plant-based proteins, and specifically for lab-cultured meat, 40–47% across all income brackets. Interestingly, among White consumers, lab-cultured meat had the lowest market shares amongst income group 4 (realized middle class) and income group 5 (affluent) at 7 and 15%, respectively. For the richest and poorest White consumers, conventional beef dominated the market with 65% of the market share for each income group, respectively. From a marketing standpoint, lab-cultured meat would likely make inroads among middle class (low-emerging middle class, emerging middle class, and realized middle class) Black South African populations based on market shares estimated in Figure 6 and population demographics in Table 1.

Figure 6. Unconditional market shares (%) by income group and race. Income 1 = poor (R0–R54, 344), income 2 = low-emerging middle class (R54,345–R151,727), income 3 = emerging middle class (R1 51,728–R363,930), income 4 = realized middle class (393,931–R631,120), and income 5 = affluent (>R631,120). Indian, colored, and other races did not have sufficient observations across income brackets to estimate the RPL model and subsequent market shares.
By age
Figure 7 highlights the difference in market shares by age.Footnote 9 Interestingly, the younger generation (those less than 28) have an estimated market share for cultured beef larger than conventional beef across all three treatments. Our estimated market share for consumers under 28 (or the Born Free generation in South Africa [those born after the end of Apartheid]) for lab-cultured meat was 55% for the control, which was the exact percentage of the Born Free generation that Szedja et al. (Reference Szedja, Stumpe, Raal and Tapscott2021) found when they simply asked via a survey if consumers were highly likely to purchase cultivated meat. So, while the percentage of market share for lab-cultured meat is high relative to other global studies (Van Loo et al., Reference Van Loo, Caputo and Lusk2020), our results align with previous South African studies regarding whether consumers are willing to try lab-cultured meat. The two older age groups, millennials (28–41) and Gen X (42–61), have a market share more dominated by conventional beef, ranging from 46 to 52% for the oldest age group and roughly split between lab-cultured meat and plant-based protein for the middle-aged group. These results suggest that cultured beef could find a foothold in the younger generation of South Africans, whereas plant-based meat alternatives seem to have a consistent market share across age demographics.

Figure 7. Conditional (conditional on buying an option) market shares (%) by age group for each treatment group.
Given the fact that South Africa’s DALRRD sent a letter to all processors, importers, and retailers of meat analogs, which imposed a ban on “meaty” names for plant-based meat alternatives in 2022, we were curious what South African consumers thought about this labeling issue and if labeling alternative meat with “meaty” adjectives affected their purchasing intention. Table 5 shows that the South African public is roughly split (across race and age) around the issue of whether companies should be able to use meat-related words like “sausage,” “burger,” and “steak” to describe meat-free vegetarian products. Importantly, from a market share standpoint, relative to conventional beef, it appears that most people thought that labeling plant-based labeled with a “meaty” name had no effect or even reduced their probability of buying that product. Conversely, the conventional beef lobby in South Africa will likely point to the fact that 37.01% of respondents responded that a label on plant-based products that used “meaty” adjectives increased the probability of them purchasing an item.
Table 5. Policy and labeling issues surrounding alternative meat products in South Africa

* Other includes Indian, Colored [mixed race], and other races.
Discussion
Substantial capital has been invested in alternative meat startup companies across South Africa, which has given rise to the widespread adoption of plant-based products in supermarkets and fast-food outlets nationwide. In 2022, government regulation was enacted (but delayed in its implementation), which would have limited the labeling of these alternative meat products to avoid confusing consumers with the product’s origin. An extension to the court ruling allowed the sale of meaty-monikered plant-based goods, but the case is still tied up in South African courts. As such, studies such as this are warranted to see how the general public of South Africa reacts to various types of labeling of alternative meat products.
In this study, we were interested in how different information sets about alternative meat products (pea-based protein, yeast-based protein, and lab-cultured meat) affected consumers’ WTP and ultimate market shares as many alternative meat companies advertise the environmental benefits of their products compared to conventionally raised beef. Further information was given to consumers about how each alternative product was produced, which is important given that lab-cultured meat is currently unavailable commercially in South Africa, and consumers may not be aware of how it is produced.
Our study indicates that South Africans are positive about cultured meat, with WTP values exceeding WTP for plant-based alternatives and conditional market shares (34–38%) in the same range as conventional beef (34–40%). This indicates a potential for lab-cultured meat in the South African market. Generally, our study finds that information (environmental metrics and production details) had a marginal impact on overall market shares for products but can affect the WTP for a product. For instance, in the pooled model, consumers were estimated to pay a premium for lab-cultured meat when provided the sustainability metrics associated with its production relative to the control (no information). However, the market share for lab-cultured meat was stable, indicating that additional information may not increase the market size but could be a tool to extract a larger premium from existing consumers. While market shares, conditional on choosing a product, were relatively unaffected by additional information, we found that additional information tended to reduce the share of consumers choosing “no-buy.” These results suggest that providing information about environmental and animal welfare benefits may increase the number of consumers in the plant-based and lab-cultured meat market rather than reducing demand for conventionally produced meat. Differences were found in preferences across various demographics; younger and Black South Africans tend to have relatively stronger preferences for plant- and cultured meat alternatives than farm-raised beef. Conversely, older and White South Africans tended to prefer conventional beef to all other alternatives.
Our results indicate a large demand for alternative meat products, including lab-cultured meat, in South Africa. From a marketing standpoint, lab-cultured meat could make inroads among middle-class Black South African populations based on the market shares estimated. Holding prices constant and conditional on choosing a food product, 21% of participants chose the plant-based (pea protein and yeast protein combined) meat alternative and 38% lab-cultured meat, for a total estimated market share of the meat alternatives of 59% for the control group. This large percentage share for alternative meats could be because plant-based burgers are already popular in large supermarkets and fast-food chains across South Africa. The large market share for cultured beef is hypothetical as there is currently no commercially available lab-cultured meat on the market. While the market share of lab-cultured meat from this study is high, much higher than the 10% market share in the global meat industry for plant-based meat alternatives forecasted for 2029 by Barclays (Barclays, 2019), they are in line with previous studies for South Africa who analyzed a willingness to try of alternative meat options (Szedja et al., Reference Szedja, Stumpe, Raal and Tapscott2021). While sales of plant-based meat products are growing at a rate of 6.5% annually in South Africa (Reuters, 2022), globally, their sales are volatile, and in the United States, growth shrank by 10.5% in 2022, possibly due to market saturation (Paris and Shanker, Reference Paris and Shanker2022). This study and the scarce literature before it on South African’s preference for meat alternatives indicate that there is a large market for plant-based and cultured meat that is subject to change. Importantly, commercially available lab-cultured meat is not currently available, and thus, consumers are providing their expectations of what they will think of the product. If lab-cultured meat becomes available, sensory attributes will likely change the WTP (Caputo et al., Reference Caputo, Sogari and Van Loo2023) and the market shares estimated in this study. Even if the long-run trends change, our results do suggest that there appears to be a large market interest in a novel product, lab-cultured meat.
From a policy perspective, this study sheds important light on how labeling meat alternatives alters consumer purchasing behavior. In 2022, the South African government passed a ruling, which it later retracted, to seize all alternative meat products with “meaty” names. This study found that South African consumers were divided on this issue, with 58% finding it acceptable for meat alternatives to use “meaty” names and 42% stating they were against it. This delineation was apparent when looking at the market shares between those who were “for” and “against” alternative meat using “meaty” names for labeling. The market share for alternative meat (lab-cultured and both plant-based alternatives) was estimated at 70.5% for those participants who were for the usage of “meaty” names compared to 48% of those who were against it. This legal battle is likely to continue as we found that 37% of consumers said they were more likely to buy an alternative meat product when a “meaty” word was used.
What is not known is if the premiums (for lab-cultured meat) and market shares for all the alternative meat choices in our survey are a snapshot of a new and novel product or a long-term trend. Consumers may be excited to try a new product, but once credence attributes are experienced, they can alter their future purchasing habits. Further complicating issues is the heavily publicized political debate over alternative meat labeling and how that may have reshaped the alternative meat landscape in South Africa.
Although environmental metrics and information on how each product was created were provided to consumers, future research may want to also provide nutrition labels for each product as many consumers are increasingly health conscious, and meat alternatives aimed at mimicking are not necessarily healthy alternatives. For instance, there is over five times the amount of sodium in a Beyond Burger patty than an 80% lean ground beef patty of the same size (Migala et al., Reference Migala, Nied and Miller2020). On the other hand, there are more beneficial micro and macronutrients in the Beyond Burger patty, which presents important consumer tradeoffs that future research may want to focus on. Future research may also want to implement non-hypothetical experiments using readily available plant-based meat alternatives to estimate what/if any hypothetical bias may exist.
Given both its high level of food insecurity and its reliance on meat, alternative meat products already have a foothold in South Africa. Studies such as this try to shed light on how the alternative meat market may look moving forward. While there continues to be a political debate on how to label alternative meat products in South Africa, consumer demand may result in South Africa becoming a large market for alternative meat.
Acknowledgements
The data that support the findings of this study are available from the corresponding author, [L.L.N], upon reasonable request.
Author contribution
Conceptualization, C.T, L.N, and E. V.L; Methodology, C.T, L.N, and E. V.L; Formal Analysis, C.T, L.N, and S.R.; Data Curation, L.N, and S.R.; Writing – Original Draft, C.T, and L.N., Writing – Review and Editing, C.T, L.N., S.R, M.T, and E.V.L
Financial support
This research received no specific grant from any funding agency, commercial, or not-for-profit sectors.
Competing interests
All authors declare none.


 Open access