


1. Introduction
Value-added certifications have become a ubiquitous part of today’s agricultural markets. Consumers use and interpret these certifications on trips to the grocery store. A carrot bearing a USDA Certified Organic label is priced higher than a carrot without such a label, even if both carrots are otherwise identical, were grown using identical practices, and were picked within inches of each other. The use of consumer-oriented product certification is familiar to most people. Because high-quality price data are often widely available in the USA, studies on certification programs in a domestic context often rely on certification price premia to measure the benefits of these programs (Spalding and Sexton, Reference Spalding and Sexton2019).
The role of value-added certification is less clear lower in the value chain. Because additional inputs must be added and additional risk must be assumed to turn an intermediate input into a finished product, measuring the value of certification for intermediate inputs can be difficult. The price effect of certification may be overshadowed by the value of other characteristics associated with the certification, making it difficult to identify the effect of the certification itself. Additionally, the value of certifications may vary across time and space or depending on input prices and other market factors. In the feeder cattle industry, where buyers representing feedlot operators must interpret large amounts of information to make decisions quickly about the expected profitability of a large group of cattle, transmission of certification value is indirect. Unlike in the example of organic carrots, where the two products may be highly similar except for the certification itself, feeder cattle certifications are associated with specific physical characteristics and production practices that often result in phenotypically distinct animals. While feedlot operators seek cattle with characteristics that maximize profit, feeder cattle producers do the same, leading to a complex relationship between cost and quality in feeder cattle markets.Footnote 1
We analyze the Virginia quality assured (VQA) feeder cattle certification to assess the value it adds for feeder cattle producers. Regression analysis is used to determine the effect of VQA certification and other lot characteristics on feeder cattle prices in the Virginia Cattlemen’s Association (VCA) Tel-O-Auction. Certified cattle receive higher prices on average than uncertified cattle, but the role of the certification itself is unclear as other lot factors also affect prices. There is clear evidence of physical differences between certified and uncertified feeder cattle, and these physical differences create significant price effects. Combining the two, we find that VQA cattle generally receive higher prices in lighter weight classes while non-VQA cattle receive higher prices in heavier weight classes. This is consistent with the fact that feedlot operators should be willing to pay more for cattle that they believe to be healthier when the cattle have more weight left to gain before slaughter, and it may explain some of the difference in weights between VQA and non-VQA cattle.
We use these physical differences to construct enterprise budgets to compare the profitability of certified and uncertified cattle among feeder cattle producers. Although their lower sale weight makes VQA cattle less profitable on a per-head basis, their higher price per hundredweight and faster turnover make them 64.5% more profitable on an annual per-acre basis. Increased profitability depends on production practices rather than on certification status, but increased profitability is a strong incentive for producer participation in the VQA program.
Previous research on value-added characteristics and certifications in feeder cattle markets has shown that these practices can carry statistically significant price premiums. However, these studies fail to analyze the profitability of such practices, even though profitability is of greater concern to producers than price.
This study focuses on producer profitability in addition to prices received by producers. It combines regression analysis and enterprise budgets to assess the benefits of certification, even where identification of specific producers is not possible.
2. Background
In an era of increased scrutiny of public funds used for agricultural extension (Coppess et al., Reference Coppess, Paulson, Schnitkey and Zulauf2018), programs such as VQA need evidence of their economic benefits, even though increased extension funding has been shown to improve both farmer net returns and the number of farmers retained in the industry (Goetz and Davlasheridze, Reference Goetz and Davlasheridze2017). For public investment in the VQA program to be considered socially beneficial, evidence is needed that the value it provides exceeds its costs and that it has higher returns than alternative uses of the funds invested in VQA. This study aims to provide policymakers with a comprehensive estimate of program benefits to be compared with program expenditures.
The value of farmgate sales of cattle and calves was nearly $700 million in Virginia in 2017 (USDA NASS, 2019), and feeder cattle are the predominant source of revenue within that segment. Buyers in feeder cattle markets look for animals that will provide the largest profit. Characteristics that buyers seek are those that will maximize feedlot performance, meaning that the market value of feeder cattle is tied to the expected value of weight gained in the feedlot. When input prices are high, heavier cattle see relatively higher prices due to the lower value of weight gain in the feedlot, and when input prices are low, prices rise for lighter cattle because the value of their weight gain increases. During periods of high input prices, preconditioned (weaned and vaccinated) cattle have been found to receive significant premiums (Williams et al., Reference Williams, Raper, DeVuyst, Peel and McKinney2012).
Prior research on the impact of feeder cattle certifications and value-added characteristics has focused on price premia resulting from certification. Schroeder et al. (Reference Schroeder, Mintert, Brazle and Grunewald1988) examined the value of various feeder cattle characteristics. Because feeder cattle are an intermediate input in cattle production, prices for feeder characteristics were based on their expected value to feedlot operators (Schroeder et al., Reference Schroeder, Mintert, Brazle and Grunewald1988). Turner, McKissick, and Dykes (Reference Turner, McKissick and Dykes1993) applied the same conceptual framework to feeder cattle teleauctions and prices in Georgia. They found higher prices for cattle that had undergone health treatments or weaning, which are fundamental practices in most modern value-added preconditioning programs such as VQA, but did not find a significant effect for preconditioning itself (Turner, McKissick, and Dykes, Reference Turner, McKissick and Dykes1993). In a study of value-added practices in calf sales, Zimmerman et al. (Reference Zimmerman, Schroeder, Dhuyvetter, Olson, Stokka, Seeger and Grotelueschen2012) found that preconditioning and health programs (similar to VQA protocols) were associated with premiums of $3 to $5 per cwt when controlling for other factors, but traditional price determinants such as weight and frame size remained major influencing factors. Williams et al. (Reference Williams, Raper, DeVuyst, Peel and McKinney2012), in a study of premiums from the Oklahoma Quality Beef Network (OQBN) feeder cattle certification program, found that certified cattle received an average of $6/cwt more than their uncertified counterparts without controlling for other factors. They also noted that lighter cattle received higher premiums for OQBN certification, as well as higher prices overall.
Research on certification programs in internationally traded goods has used producer surveys to study the effects of certification on household income. Recent research on value-added and fair trade certifications dealing with black pepper (Parvathi and Waibel, Reference Parvathi and Waibel2015) and coffee production (Astuti et al., Reference Astuti, Offermans, Kemp and Cörvers2015; Jena and Grote, Reference Jena and Grote2017) are examples. These studies approach the issue of profitability more directly as a survey can measure inputs and their costs, but producer surveys are generally more time- and resource-intensive to conduct than studies using market data. This makes them less attractive to researchers working in the USA, where market data are relatively easy to obtain.
The feeder cattle research discussed above focuses on much larger markets than those in Virginia, leading to important differences in the markets themselves. In larger markets (particularly those in the West), it is more common to market uniform lots, making it easy to evaluate cattle visually. In smaller markets such as Virginia, lots tend to be less uniform, and in the case of teleauctions, visual assessment of cattle is impossible. The potential for commingled lots of cattle from many different sellers at larger markets make certifications an important tool to convey quality information. This role of certifications may not exist in smaller markets where sellers are often announced and may be known to buyers. This paper explains how the value-added certification trends observed in larger feeder cattle markets may or may not translate to smaller ones. The study also applies the focus on profitability seen in international research on value-added certifications to the context of domestic feeder cattle auctions. Although Williams et al. (Reference Williams, DeVuyst, Peel and Raper2014b) have done some work on net returns to feeder cattle certifications in large-market contexts, this paper seeks to answer the same question in a small-market context, where the role of feeder cattle associations means that identification of individual producers marketing a lot is more difficult and certification may not be randomly distributed.
2.1. The VQA Program
The VQA program combines producer education and verification of best management practices with the intention of improving the quality of Virginia feeder cattle. For cattle to be eligible for VQA certification, producers must participate in the Beef Quality Assurance (BQA) program (Greiner, McKinnon, and Hall, Reference Greiner, McKinnon and Hall2003), a certification program that focuses on the proper handling and husbandry of beef cattle. Specific topics include vaccination, feeding and watering, and transportation (Osborne and Hockenberry, Reference Osborne and Hockenberry2010).
Following training, participants become eligible for VQA certification. Although the BQA certification is a prerequisite for entry into the program, it certifies the producers, whereas the VQA certification focuses on the characteristics of the cattle. Cattle can be certified at the Gold Tag or Purple Tag levels, signified by ear tags of the corresponding color. A Gold Tag certified animal must have received a panel of vaccines at least 2 weeks prior to the sale date, have been owned by the seller for at least 60 days, and weigh at least 400 pounds. Purple Tag certified cattle must meet the requirements of the Gold Tag program and be sired by bulls expected to pass on above-average yearling weight characteristics. Cattle in both programs may also have a “W” on their ear tag, signifying that they have been weaned for at least 30 days and are trained to eat from feed and water troughs prior to the sale. All standards must be certified by a registered third party, usually veterinarians or Virginia Cooperative Extension agents (McKinnon, Reference McKinnon1998). The intended result is an animal that, due to better handling and genetics, will remain healthier and gain weight faster at the feedlot. If this expectation of better health and increased weight gain is held by buyers as well, then VQA certification would be expected to result in higher sale prices for feeder cattle.
3. Model, Methods, and Data
3.1. Conceptual Model
Feeder cattle producers are assumed to maximize expected profit across their operation. They choose the bundle of characteristics possessed by the cattle, how long the cattle should be fed, and how many cattle should be produced (determined by the number of batches produced and the number of cattle in a batch). For each animal
 $i$
, expected profit
$i$
, expected profit
 $E\left( {{\pi _i}} \right)$
for backgrounded feeder cattle is determined as follows:
$E\left( {{\pi _i}} \right)$
for backgrounded feeder cattle is determined as follows:
 $$E\left( {{\pi _i}} \right) = E\left( {{P_i}\left( {{w_i}\left( f \right),{H_i}} \right)} \right){w_i}\left( f \right) - E\left( {{C_i}\left( {f,\;{H_i}} \right)} \right),$$
where
 ${P_i}$
is the price received per pound as a function of the weight and characteristics of the animal,
${P_i}$
is the price received per pound as a function of the weight and characteristics of the animal,
 ${w_i}$
is the weight of the animal in pounds as a function of time on feed,
${w_i}$
is the weight of the animal in pounds as a function of time on feed,
 ${H_i}$
is a selection of characteristics possessed by the animal (such as voluntary certifications or sex of the animal), and
${H_i}$
is a selection of characteristics possessed by the animal (such as voluntary certifications or sex of the animal), and
 ${C_i}$
is the cost of producing the animal as a function of time on feed and its characteristics. The first term in equation (1) is the expected revenue for the animal. Producers choose the final weight of the animal by varying the amount of time on feed (
${C_i}$
is the cost of producing the animal as a function of time on feed and its characteristics. The first term in equation (1) is the expected revenue for the animal. Producers choose the final weight of the animal by varying the amount of time on feed (
 $f$
); they also choose the animals’ characteristics by changing production practices or pursuing value-added certifications. The cattle included in the data set represent a mix of feeder calves (generally weighing around 400–599 lbs.) and stocker cattle (above 600 lbs.). Stocker cattle are generally fed on pasture prior to sale (referred to as “backgrounding” or “stockering”) to allow them to gain weight cheaply prior to entering the feedlot.
$f$
); they also choose the animals’ characteristics by changing production practices or pursuing value-added certifications. The cattle included in the data set represent a mix of feeder calves (generally weighing around 400–599 lbs.) and stocker cattle (above 600 lbs.). Stocker cattle are generally fed on pasture prior to sale (referred to as “backgrounding” or “stockering”) to allow them to gain weight cheaply prior to entering the feedlot.
Although production costs vary generally based on the days an animal spends on feed and on its characteristics, the specific costs incurred take many different forms. Expected per-head costs of production are
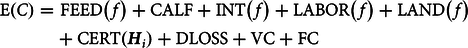 $$\eqalign{{\rm{E}}\left( C\right) & {=} {\rm\ {FEED}}\left( f \right) + {\rm{CALF}} + {\rm{INT}}\left( f \right) + {\rm{LABOR}}\left( f \right) + {\rm{LAND}}\left( f \right) \cr &\quad +\, {\rm{CERT}}\left( {\boldsymbol{H}_i} \right) + {\rm{DLOSS}} + {\rm{VC}} + {\rm{FC}}}$$
Major costs are feed, including pasture and hay (FEED), calf purchases (CALF),Footnote 2 interest accrued on calf purchases (INT), labor (LABOR), land (LAND), certification costs (CERT), which may include VQA certification, death loss (DLOSS),Footnote 3 other variable costs (VC), and fixed costs (FC). Of these, feed costs, interest expenses, labor, and land vary based on the time animals spend on the farm. Certification costs vary based on the direct costs of the value-added certifications (if any) a producer decides to pursue for each animal and the cost of the characteristics required to be eligible for said certifications. Information on how these costs were estimated can be found in the Empirical Procedures section.
Annual farm profits for a producer of backgrounded feeder cattle may be specified as
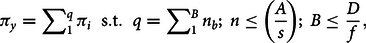 $${\pi _y} = \mathop \sum \nolimits_1^q {\pi _i}\;{\rm{\;s}}.{\rm{t}}.\;\;q = \mathop \sum \nolimits_1^B {n_b};\;n \le \left( {\frac{A}{s}} \right);{\rm{\;}}B \le {\frac{D}{f}},$$
where π
y
is the farm’s annual profit from the cattle operation in year y, q is the number of head produced in that year,
 ${n_b}$
is the number of cattle in batch b, B is the number of batches produced in a year,Footnote
4
A is the total acreage available to the farm, and s represents acres required per animal. D is the number of days in the feeder cattle production season, which we assume is equal to 180,Footnote
5
and f is the number of days on feed from equation (1). This equation introduces n and b as new choice variables, while A and s are given. Although D is assumed to be 180 given the beef production systems and grazing seasons present in most of Virginia, this is not a restrictive assumption, as it may change based on forage management, stocking rates, or the use of supplemental feeds. The total number of head produced in a year (q) depends on the stocking rate, the time animals spend on feed, and the length of the growing season. The acreage constraint shows that a farm cannot produce more cattle in a year than their space allows. To produce more cattle, farms can expand (increase A by renting or buying more land) or reduce the acreage requirement per head (s), such as using more intensive grazing practices or by introducing supplemental or even dry-lot feeding. While these practices increase the stocking rate of the farm, they also increase the cost of producing feeder cattle. The batch constraint shows that producers cannot replace the current batch of animals with a new batch if there is not sufficient time left in the season.
${n_b}$
is the number of cattle in batch b, B is the number of batches produced in a year,Footnote
4
A is the total acreage available to the farm, and s represents acres required per animal. D is the number of days in the feeder cattle production season, which we assume is equal to 180,Footnote
5
and f is the number of days on feed from equation (1). This equation introduces n and b as new choice variables, while A and s are given. Although D is assumed to be 180 given the beef production systems and grazing seasons present in most of Virginia, this is not a restrictive assumption, as it may change based on forage management, stocking rates, or the use of supplemental feeds. The total number of head produced in a year (q) depends on the stocking rate, the time animals spend on feed, and the length of the growing season. The acreage constraint shows that a farm cannot produce more cattle in a year than their space allows. To produce more cattle, farms can expand (increase A by renting or buying more land) or reduce the acreage requirement per head (s), such as using more intensive grazing practices or by introducing supplemental or even dry-lot feeding. While these practices increase the stocking rate of the farm, they also increase the cost of producing feeder cattle. The batch constraint shows that producers cannot replace the current batch of animals with a new batch if there is not sufficient time left in the season.
Keeping cattle on feed for a longer period entails an opportunity cost of replacing them with newer, younger animals (Burt, Reference Burt1993). This opportunity cost influences the producer’s selection of an optimal sale weight. If producers keep an animal on feed for too long, they will run out of time to replace it with a new animal. In Virginia, producers can stocker up to two batches of animals, that is,
 $b \in \left\{ {1,2} \right\}$
.Footnote
6
We assume that producers will choose how many batches to produce at the beginning of the year, influencing their choice of f. Although producers may sell cattle slightly earlier or later to take advantage of short-term price movements, f will primarily be based on the number of batches produced, which will itself be based on the long-term price expectations. Because all Virginia cattle producers are subject to a similar grazing season, most farmers have the same ability to produce up to two batches.Footnote
7
$b \in \left\{ {1,2} \right\}$
.Footnote
6
We assume that producers will choose how many batches to produce at the beginning of the year, influencing their choice of f. Although producers may sell cattle slightly earlier or later to take advantage of short-term price movements, f will primarily be based on the number of batches produced, which will itself be based on the long-term price expectations. Because all Virginia cattle producers are subject to a similar grazing season, most farmers have the same ability to produce up to two batches.Footnote
7
Feeder cattle prices are determined by their expected profitability in a feedlot operation. Prices for feeder cattle and other intermediate inputs are the sum of the marginal values of each input’s characteristics to the buyer (Ladd and Martin, Reference Ladd and Martin1976). This allows us to explicitly estimate the price term in equation (1). Following Schroeder et al. (Reference Schroeder, Mintert, Brazle and Grunewald1988), we model price as
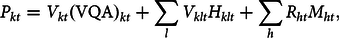 $${P_{kt}} = {V_{kt}}{\left( {{\rm{VQA}}} \right)_{kt}} + \mathop \sum \limits_l {V_{klt}}{H_{klt}} + \mathop \sum \limits_h {R_{ht}}{M_{ht}},$$
where P reflects market prices for the kth lotFootnote 8 at time t and is a function of characteristics (H) and market forces (M) subject to the values of those characteristics (V) and price effects of market forces (R), where l refers to a specific characteristic and h indexes the market forces, which include corn price (representing input prices generally), market location, and time. All characteristics and market forces are shown later in equation (5). Because the value of VQA certification is the main variable of concern in this study, we have separated it from the other characteristics (H). Feeder cattle producers will pursue certification for a given feeder if certification increases expected profit.Footnote 9 Feeder cattle producers may also pursue attributes normally associated with VQA-certified cattle, such as vaccination or weaning, without actually certifying the cattle.
3.2. Data Description
In most in-person livestock markets, buyers rely heavily on visual assessment to infer the quality of the animals in the lot. Animal size, condition, and lot uniformity can be assessed rapidly, with buyers making quick decisions about bidding. In a teleauction, bills of sale containing a variety of information about each lot are published ahead of the sale so that buyers can make decisions in advance about which lots to bid on. This information provides the lot characteristics included as
 $H$
in equation (4). Variables are described in Table 1; summary statistics are in Table 2.
$H$
in equation (4). Variables are described in Table 1; summary statistics are in Table 2.
Table 1. Description of variables
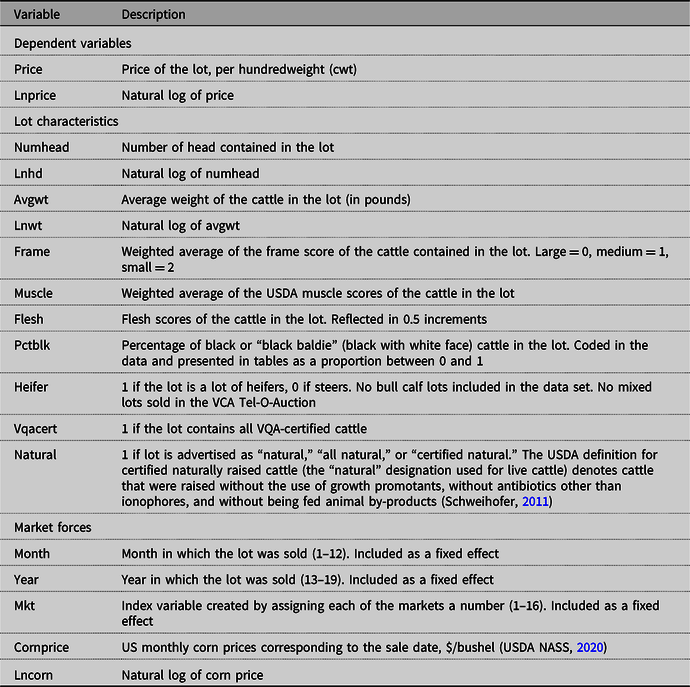
Table 2. Summary statistics of variables, including comparison of means by VQA certification status
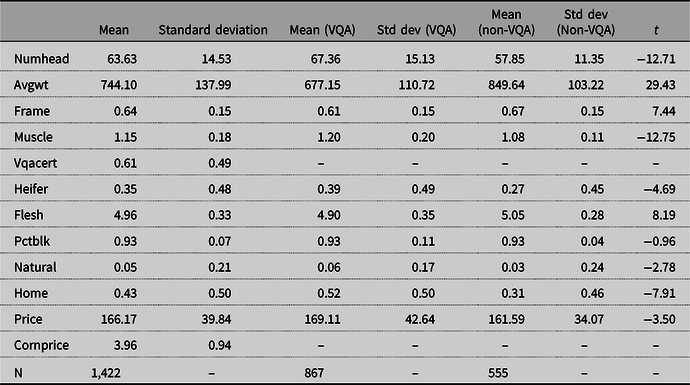
Notes: “t” refers to t-test for difference in means. Source: VCA Tel-O-Auction data and USDA NASS.
Data are obtained from the bills of sale for the VCA Tel-O-Auction from January 2013 to August 2019. Lots included in this data set cover an area representing most of Virginia’s beef-producing regions, which are concentrated in the western part of the state. Fourteen of the 28 stockyards in Virginia are involved in these sales as administrative entities (Virginia Market News Service, n.d.), and the data set also contains a few lots from sales in Pocahontas County, West Virginia, and Boone, North Carolina. The majority of the lots were sold in southwest Virginia, with 43.53% sold via the Tri-State Livestock Market in Abingdon, VA and another 26.16% sold via the Pulaski Livestock Market in Dublin, VA (Table 3). Sales of cattle and calves in Virginia totaled 825,758 head in 2017 (National Agricultural Statistics Service, 2020), so although the data set covers a large area, it represents a small proportion of total Virginia cattle sales (Table 4).
Table 3. Distribution of lots by market
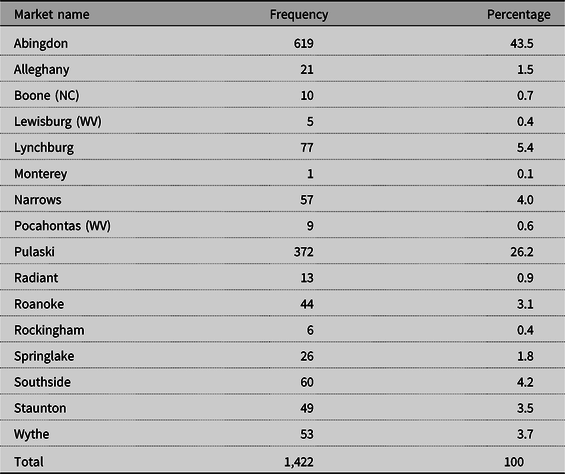
Notes: All markets shown administer sales through the VCA Tel-O-Auction. Although the markets in Boone, Lewisburg, and Pocahontas contain cattle raised outside of Virginia, they may also contain cattle raised in Virginia due to their relative proximity to the Virginia border.
Source: VCA Tel-O-Auction data.
Table 4. Mean prices ($/cwt) and number of head sold by year and VQA certification status
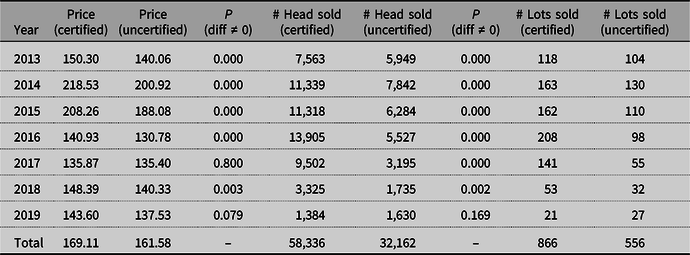
Source: VCA Tel-O-Auction data.
Market and time fixed effects, represented in M in equation (4), are included to account for differences across time and space. Monthly US average corn prices corresponding to the auction date are included to control for changes in input prices (USDA NASS, 2020).
Various ownership structures are present in the data. In some cases, cattle are sold by single farms or individuals, with the name of the seller listed on the bill of sale. Some sellers consign several lots of cattle a month, some sell only once a year, and some sell more sporadically. In other cases, cattle in the data set were consigned to local and regional feeder cattle associations, such as the Dublin Feeder Cattle Association, which generally sell large, commingled lots of VQA-certified cattle. However, because of the commingling of lots, we are not able to effectively identify these producers in the data.
3.3. Empirical Procedures
Following the framework adapted from Schroeder et al. (Reference Schroeder, Mintert, Brazle and Grunewald1988) as shown in equation (3), regression analysis is used to estimate mean prices and weights for VQA-certified and uncertified cattle. Based on equations (1)–(4), the natural log of price is regressed on lot characteristics, including fixed effects for market location, month, and year. Characteristics other than VQA certification, shown as H in equation (4), include average weight of the lot, number of head in the lot, sex of the lot, natural certification, frame score, muscle score, flesh score, and proportion of black cattle in the lot. Market effects (M) are represented by corn price, market location, month, and year. Using the variables listed in Table 1, the regression model is estimated as follows:
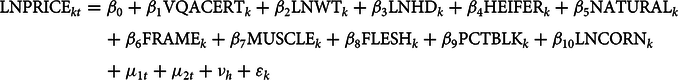 $$\begin{align*}{\rm{LNPRIC}}{{\rm{E}}_{kt}} & = {\beta _0} + {\beta _1}{\rm{VQACER}}{{\rm{T}}_k} + {\beta _2}{\rm{LNW}}{{\rm{T}}_k} + {\beta _3}{\rm{LNH}}{{\rm{D}}_k} + {\beta _4}{\rm{HEIFE}}{{\rm{R}}_k} + {\beta _5}{\rm{NATURA}}{{\rm{L}}_k} \\
&\quad + {\beta _6}{\rm{FRAM}}{{\rm{E}}_k} + {\beta _7}{\rm{MUSCL}}{{\rm{E}}_k} + {\beta _8}{\rm{FLES}}{{\rm{H}}_k} + {\beta _9}{\rm{PCTBL}}{{\rm{K}}_k} + {\beta _{10}}{\rm{LNCOR}}{{\rm{N}}_k}\, \\
&\quad + {\mu _{1t}} + {\mu _{2t}} + {\nu _h} + {\varepsilon _k}\end{align*}$$
$$\begin{align*}{\rm{LNPRIC}}{{\rm{E}}_{kt}} & = {\beta _0} + {\beta _1}{\rm{VQACER}}{{\rm{T}}_k} + {\beta _2}{\rm{LNW}}{{\rm{T}}_k} + {\beta _3}{\rm{LNH}}{{\rm{D}}_k} + {\beta _4}{\rm{HEIFE}}{{\rm{R}}_k} + {\beta _5}{\rm{NATURA}}{{\rm{L}}_k} \\
&\quad + {\beta _6}{\rm{FRAM}}{{\rm{E}}_k} + {\beta _7}{\rm{MUSCL}}{{\rm{E}}_k} + {\beta _8}{\rm{FLES}}{{\rm{H}}_k} + {\beta _9}{\rm{PCTBL}}{{\rm{K}}_k} + {\beta _{10}}{\rm{LNCOR}}{{\rm{N}}_k}\, \\
&\quad + {\mu _{1t}} + {\mu _{2t}} + {\nu _h} + {\varepsilon _k}\end{align*}$$
where
 ${\beta _1}$
is the main parameter of interest,
${\beta _1}$
is the main parameter of interest,
 ${\mu _{1t}}\;{\rm{and}}\;{\mu _{2t}}\;$
are month and year fixed effects, respectively,
${\mu _{1t}}\;{\rm{and}}\;{\mu _{2t}}\;$
are month and year fixed effects, respectively,
 ${\nu _h}$
are market fixed effects for each lot, and is the error term. Average weight, number of head in the lot, and corn priceFootnote
10
are included as natural logs so that the coefficients may be interpreted as elasticities.Footnote
11
The values of characteristics (V) are represented by
${\nu _h}$
are market fixed effects for each lot, and is the error term. Average weight, number of head in the lot, and corn priceFootnote
10
are included as natural logs so that the coefficients may be interpreted as elasticities.Footnote
11
The values of characteristics (V) are represented by
 ${\beta _1}$
through
${\beta _1}$
through
 ${\beta _9}$
, while the price effects of market forces (R in equation 3) are represented by
${\beta _9}$
, while the price effects of market forces (R in equation 3) are represented by
 ${\beta _{10}}$
and the fixed effects.
${\beta _{10}}$
and the fixed effects.
We treat VQA certification as exogenous in equation (5); identification of
 ${\beta _1}$
rests on the assumption that cov
${\beta _1}$
rests on the assumption that cov
 ${({\rm{VQACERT}},\,{\varepsilon_k})=0}$
. This assumption is reasonable as certification occurs well before market prices are realized and any potential correlation is absorbed by inclusion of the characteristic and market forces covariates. Williams et al. (Reference Williams, DeVuyst, Peel and Raper2014a, Reference Williams, DeVuyst, Peel and Raper2014b) have discussed the appropriateness of using propensity score matching to study participation in feeder cattle certification programs and net returns to value-added practices making up many preconditioning programs. Their research confirmed significant premiums for preconditioning programs in general and value-added certifications in particular, and they suggested that selection bias present in hedonic models may bias premiums downward relative to propensity score matching (Williams et al. Reference Williams, DeVuyst, Peel and Raper2014a, Reference Williams, DeVuyst, Peel and Raper2014b.). We discuss additional potential biases below.
${({\rm{VQACERT}},\,{\varepsilon_k})=0}$
. This assumption is reasonable as certification occurs well before market prices are realized and any potential correlation is absorbed by inclusion of the characteristic and market forces covariates. Williams et al. (Reference Williams, DeVuyst, Peel and Raper2014a, Reference Williams, DeVuyst, Peel and Raper2014b) have discussed the appropriateness of using propensity score matching to study participation in feeder cattle certification programs and net returns to value-added practices making up many preconditioning programs. Their research confirmed significant premiums for preconditioning programs in general and value-added certifications in particular, and they suggested that selection bias present in hedonic models may bias premiums downward relative to propensity score matching (Williams et al. Reference Williams, DeVuyst, Peel and Raper2014a, Reference Williams, DeVuyst, Peel and Raper2014b.). We discuss additional potential biases below.
An enterprise budget is used to estimate the costs for producing certified and uncertified cattle based on the costs outlined in equation (2). Certification costs (CERT) are a function of the certification status of a given animal, while FEED, INT, LABOR, and LAND are all functions of the amount of time an animal spends on feed. We assume that CALF, DLOSS, VC, and FC are the same for both VQA and non-VQA cattle. Cost advantage for calf purchases is more likely to be determined on a producer-by-producer basis than categorically for certified and uncertified cattle, although the data at hand do not provide any indication one way or the other.
The only direct costs of VQA certification are the $1 per unit cost of purchasing ear tags; indirect cost differences are the other elements in equation (2). Extension agents make visits to certify cattle at no direct cost to farmers. We also assume that cost does not vary between Purple Tag and Gold Tag VQA certification. Although calves used to produce Purple Tag cattle may cost more due to their improved genetics, the bills of sale used to construct the data set generally do not indicate Gold or Purple Tag certification specifically, so we do not include these differences here. Additionally, veterinary and medical costs do not differ based on VQA status because the budget assumes a VQA-compliant vaccine panel for all cattle, certified and uncertified (Griffith and Bowling, Reference Griffith and Bowling2020). This is consistent with the Tel-O-Auction data set, where all cattle are subject to vaccination in some form.
The age of the animals in the data set is not consistently recorded. While it is possible to directly measure differences in weight between certified and uncertified cattle, it is not possible to measure differences in age. It is, however, feasible to estimate the number of days on feed (f) based on differences in sale weight and assumptions of average daily gains. This process is described in greater detail in the “Differences in Cost and Profitability for VQA-Certified and Uncertified Cattle” portion of the results section. When combined with other descriptive statistics and figures, we feel that these estimates are sufficient to make statements about likely differences in the number of cattle that can be produced by a farm in a given year.
4. Results
A comparison of the mean prices of VQA certified and noncertified cattle by year, shown in Table 4, suggests that certified cattle consistently command higher prices than uncertified cattle. However, the temporal variability in the price premium for certified cattle is high, ranging from less than $1 per hundredweight in 2017 to over $20 in 2015. This variability is in line with the results from previous VQA research, where lower premiums in some years were attributed to the combination of decreases in finished cattle prices and futures and rises in feeder cattle prices (Greiner et al., Reference Greiner, McKinnon and Hall2003). However, the price differentials shown here do not account for differences in weight or other physical characteristics, so controls for weight and other physical characteristics must be examined.Footnote 12
Because VQA certification entails education intended to change producer behavior and required practices intended to change the physical characteristics of the cattle, certified and uncertified cattle generally do not have identical characteristics. In Table 5, columns 1 and 2 show the effects of VQA certification on price when controlling for physical attributes and non-VQA certifications while including fixed effects for market and time. In column 1, VQA certification has a small and nonsignificant effect on price. Due to the log-linear nature of this relationship, this coefficient represents a 1.3% premium, which translates to $2.18 per cwt at the mean price. In addition to not being statistically significant, this premium is smaller than the $2.39 to $5.74 per cwt that Williams et al. (Reference Williams, Raper, DeVuyst, Peel and McKinney2012) found for a similar certification in Oklahoma, and it is also smaller than the $3 or more premium that Zimmerman et al. (Reference Zimmerman, Schroeder, Dhuyvetter, Olson, Stokka, Seeger and Grotelueschen2012) found for both weaning and vaccination certifications independently. Physical attributes such as weight, frame size, and flesh score play a larger role and once these factors are accounted for, VQA participation has a negligible effect. This finding is in contrast to Williams and Zimmerman, where certifications carried statistically significant premiums when controlling for physical attributes of the cattle. The impact of average weight of a lot of cattle on price received is large, negative, and highly significant. The results suggest that a 1% increase in weight per head (roughly 7.4 pounds at the mean) decreases the price received for a lot by 0.19%. Because marginal weight gain per unit of feed drops as animals gain weight, this outcome is consistent with expectations.
Table 5. Effects of lot characteristics on logged price per cwt
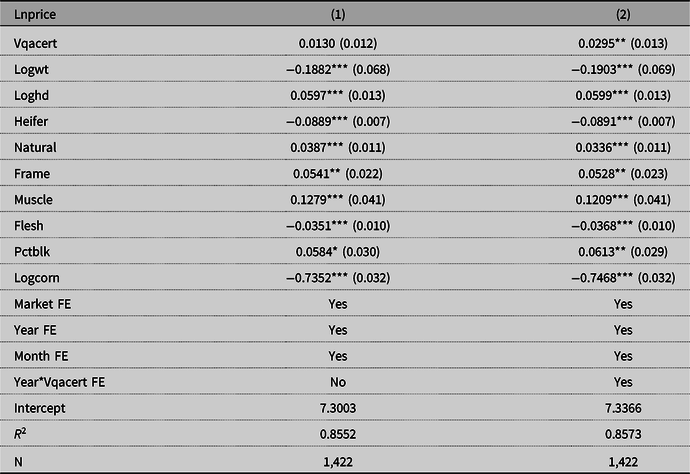
Notes: Robust standard errors in parentheses. Market fixed effect refers to the market location, while year and month fixed effects refer to the sale date. Year*Vqacert is an interaction effect to discern differences in VQA premiums over time. “No” means the fixed effect was not included, while “Yes” means the fixed effect was included.
A 1% increase in the price per bushel of corn decreases feeder cattle prices by 0.74% (Table 5, column 1). This price effect is statistically significant at the 1% level and is expected because an increase in corn price decreases feedlot profit margins (ceteris paribus).
The suggestion that VQA certification price effects vary over time is examined by adding an interaction term between VQA certification and year. Results are presented in Table 5, column 2. The coefficient for certification shows a highly significant premium of 2.99% in the base year 2013. The interaction effects have negative signs, with differing magnitudes and degrees of significance, suggesting the net effect varies over time. The interaction effect in 2017, when the VQA cattle price premium was very small, was particularly large, with a negative coefficient that is highly significant and almost double the magnitude of the VQA premium of the base year. The combination of the main effect (shown for the base year) and the interaction effects for the other years shows that even though VQA cattle received higher prices every year, the net effect of VQA certification controlling for animal attributes varied from year to year and sometimes even had a negative effect.
Estimates of premiums associated with VQA certification based on regression analysis do not necessarily imply higher profitability of VQA-certified cattle. To analyze profitability of certified versus uncertified cattle, price and weight information is necessary to compare revenues and costs of the two groups using enterprise budgets. Certified cattle are generally sold at a significantly lower weight, with a mean weight of 677 lbs. per animal for lots of certified cattle compared to 848 lbs. for lots of uncertified cattle. A
 $t$
-test confirms that this difference is highly significant (Table 2). As an additional robustness check, we regressed logged weight on VQA certification, sex, breed, and corn price (Table 6). This regression shows that certified cattle are 18.6% lighter than uncertified cattle, which is highly significant and close to the unconditional mean differences. Another
$t$
-test confirms that this difference is highly significant (Table 2). As an additional robustness check, we regressed logged weight on VQA certification, sex, breed, and corn price (Table 6). This regression shows that certified cattle are 18.6% lighter than uncertified cattle, which is highly significant and close to the unconditional mean differences. Another
 $t$
-test shows that a highly significant difference in average price for certified and uncertified cattle is also evident, with certified cattle receiving an average price of $169.11/cwt and uncertified cattle receiving an average price of $161.59/cwt (Table 2).
$t$
-test shows that a highly significant difference in average price for certified and uncertified cattle is also evident, with certified cattle receiving an average price of $169.11/cwt and uncertified cattle receiving an average price of $161.59/cwt (Table 2).
Table 6. Effects of lot characteristics on logged weight
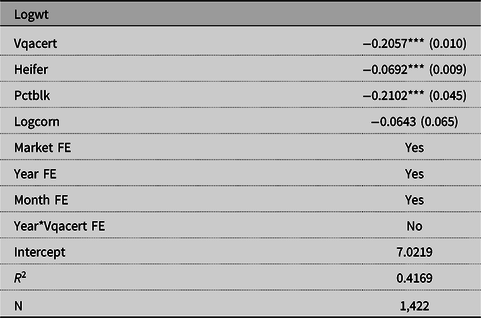
Notes: Robust standard errors in parentheses. Market fixed effect refers to the market location, while year and month fixed effects refer to the sale date. Year*Vqacert is an interaction effect to discern differences in VQA premiums over time. “No” means the fixed effect was not included, while “Yes” means the fixed effect was included.
Although an important relationship between weight and certification status is evident, an attempt to model this by interacting the certification dummy variable with the natural log of weight rendered the interaction, weight, and certification coefficients all statistically insignificant. Since prior research and microeconomic theory show weight to be a major driver of feeder cattle prices, this approach was not adopted. However, as Figure 1 shows, prices per cwt received for VQA-certified cattle are significantly higher for lighter weight classes, while uncertified cattle receive higher prices for heavier weight classes. Because the prices shown in this graph do not include explicit controls for the effects of other lot characteristics, Figure 1 represents correlation between weight class and price rather than weight directly determining price; however, differences in price by weight class are observable by farmers and may explain why VQA cattle are marketed at dramatically lighter weights. Given the role of VQA certification as a risk management tool for feedlot operators when buying feeder cattle, it makes sense that VQA cattle would be more valuable at lighter weights, when there is still plenty of weight for them to put on, than at heavier weights, when the stocker has already assumed more of the risk.
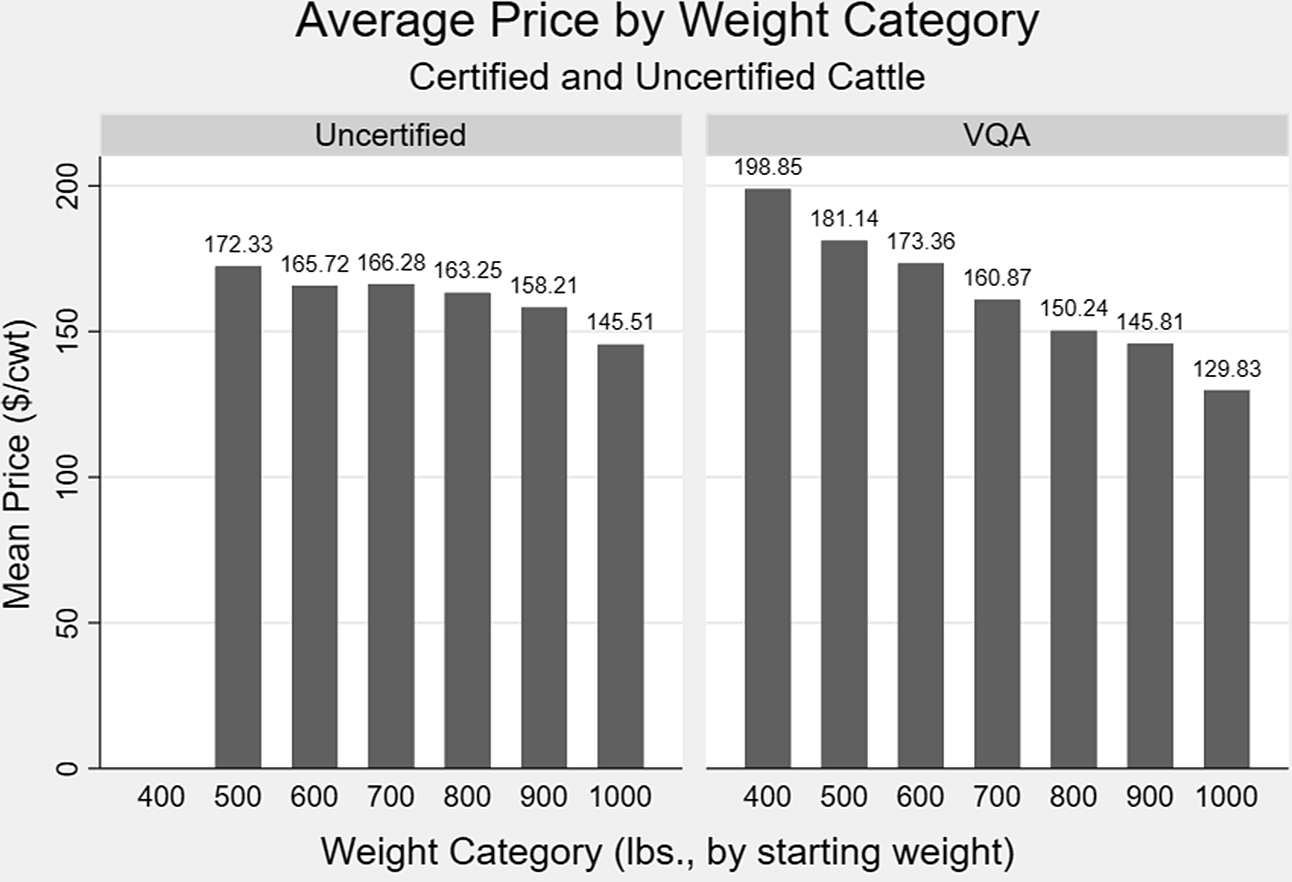
Figure 1. Average prices of VQA and uncertified cattle, grouped by average weight of sale lot.
Source: VCA Tel-O-Auction bills of sale.
Because VQA is an extension program, there is likely to be some bias in terms of farmer participation. Farmers who place less value on extension education in general are less likely to participate in BQA training, and therefore less likely to participate in VQA. Conversely, because extension education programs are often bundled or marketed together, producers involved in VQA may have greater exposure to extension programs beyond VQA. This selection effect might lead to a bias due to unobserved factors affecting participation in the program that may also affect price received. For instance, if a producer is a more active participant in state and local feeder cattle associations, they may have a positive reputation among buyers who deal with those associations while also being more likely to participate in VQA. If this problem is significant, it would most likely lead to an overestimation of the effect of participation on price received.
The selection bias could be controlled for if we had information on individual farmers and factors affecting program participation. However, feeder cattle associations market commingled lots of VQA cattle from different producers, so identification of participating farmers and gathering information on their attributes is impossible. Given that detailed information on farmer participation and eligibility for the VQA program was not available, we focus on identifiable physical differences between certified and uncertified cattle. However, additional information on the farmers themselves would improve the assessment of the program’s success. Without this information, our sense is that selection imparts a positive bias on the estimated price impact.
4.1. Differences in Cost and Profitability for VQA-Certified and Uncertified Cattle
A comparison of costs of production for VQA and uncertified cattle is presented in Table 7. Using the price and weight information from the regression analysis and cost information from the budget, we estimate the differences in revenue per head, cost per head, and overall profitability for producers of certified and uncertified cattle. Because per-head revenues and costs change over time based on changes in input costs, changes in the cattle market cycle, and other factors, readers should not interpret these budgets as suitable for planning a cattle backgrounding enterprise. Instead, these budgets are presented to illustrate the differences in profitability that can result from marketing lighter cattle that are backgrounded for a shorter period. The size of these differences in profitability at any given point in time will depend on the costs and market prices faced by cattle producers at that time.
Table 7. Enterprise budget comparing profits of VQA-certified and uncertified feeder cattle
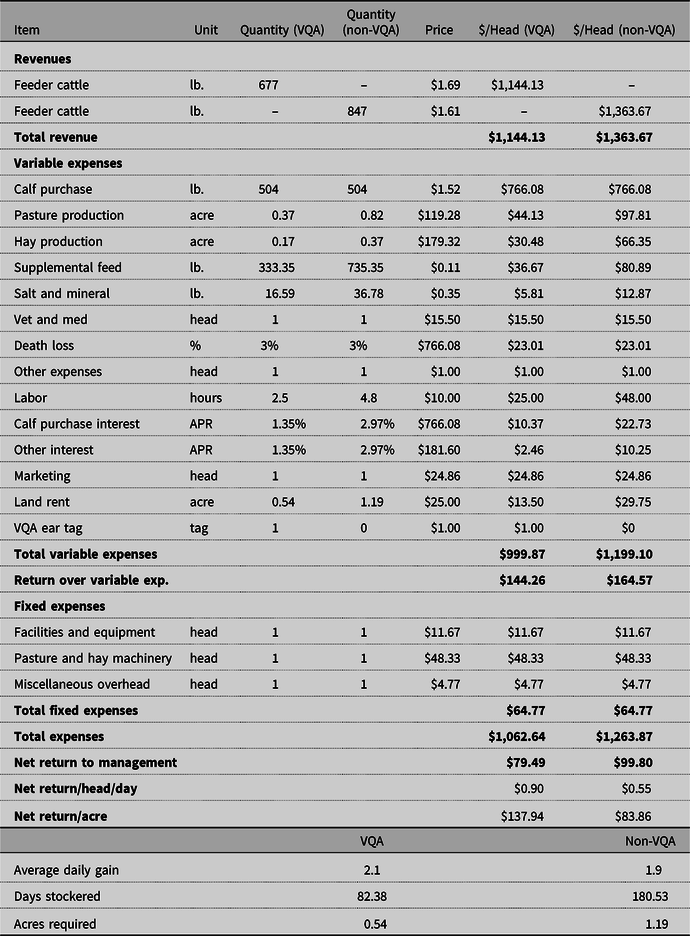
We assume that calves used to produce certified and uncertified cattle are purchased at the same weight. However, based on differences in sales weights and similar purchase weights for certified and uncertified cattle (504 lbs. for both groups), we assume uncertified cattle remain on the farm over twice as long as VQA cattle given similar daily rates of gain.
Estimates of difference in revenue per head can be taken from the first term of equation (1),
 $E\left( {{P_i}} \right)w$
. Recall that P
i
refers here to the price received for an individual animal, and w refers to the weight of the animal. Because differences in price and weight for VQA cattle and uncertified cattle were estimated empirically, the difference in revenue per head between the two groups is estimated as
$E\left( {{P_i}} \right)w$
. Recall that P
i
refers here to the price received for an individual animal, and w refers to the weight of the animal. Because differences in price and weight for VQA cattle and uncertified cattle were estimated empirically, the difference in revenue per head between the two groups is estimated as
 $${\left( {Pw} \right)_{{\rm{VQA}}}} - {\left( {Pw} \right)_{{\rm{non}}}} = {P_{{\rm{VQA}}}}{w_{{\rm{VQA}}}} - {P_{{\rm{non}}}}{w_{{\rm{non}}}}$$
Certified cattle are sold at an average price of $1.69/lb., while uncertified cattle are sold at $1.61/lb. (Table 2). VQA cattle are sold, on average, at 677 lbs., while uncertified cattle are sold at 847 lbs. Thus, each head of VQA cattle sold brings, on average, $1144.13 in revenue, while each head of uncertified cattle sold brings in $1,363.67. Thus, the difference in revenue per head between certified and uncertified cattle (equation 6) is –$219.54.
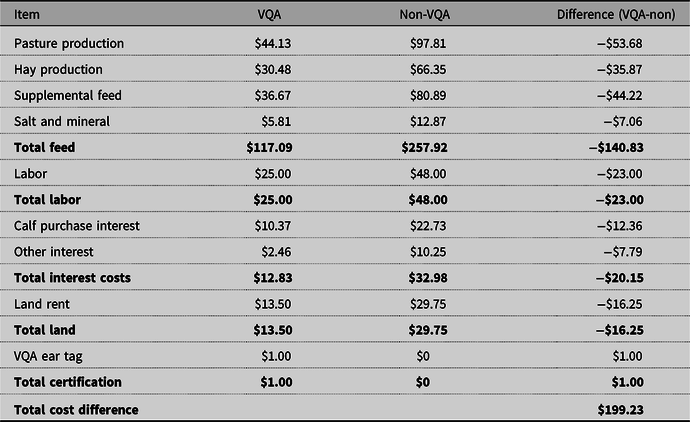
Because certified cattle are lighter when sold, they are on pasture for less time and will consume less feed, accrue lower interest expenses, require less labor, and use less land on an annual per-head basis. The only increase in costs for certified cattle is the $1 cost of the VQA ear tag (CERT) not incurred by uncertified cattle. Thus, the difference in cost between certified and uncertified cattle is
 $$\begin{align*}{C_{{\rm{VQA}}}} - {C_{{\rm{non}}}} & = {\rm{FEE}}{{\rm{D}}_{{\rm{VQA}}}} + {\rm{IN}}{{\rm{T}}_{{\rm{VQA}}}} + {\rm{LABO}}{{\rm{R}}_{{\rm{VQA}}}} + {\rm{LAN}}{{\rm{D}}_{{\rm{VQA}}}} + {\rm{CER}}{{\rm{T}}_{{\rm{VQA}}}} \\
& \quad - \left( {{\rm{FEE}}{{\rm{D}}_{{\rm{non}}}} + {\rm{IN}}{{\rm{T}}_{{\rm{non}}}} + {\rm{LABO}}{{\rm{R}}_{{\rm{non}}}} + {\rm{LAN}}{{\rm{D}}_{{\rm{non}}}}} \right)\end{align*}$$
$$\begin{align*}{C_{{\rm{VQA}}}} - {C_{{\rm{non}}}} & = {\rm{FEE}}{{\rm{D}}_{{\rm{VQA}}}} + {\rm{IN}}{{\rm{T}}_{{\rm{VQA}}}} + {\rm{LABO}}{{\rm{R}}_{{\rm{VQA}}}} + {\rm{LAN}}{{\rm{D}}_{{\rm{VQA}}}} + {\rm{CER}}{{\rm{T}}_{{\rm{VQA}}}} \\
& \quad - \left( {{\rm{FEE}}{{\rm{D}}_{{\rm{non}}}} + {\rm{IN}}{{\rm{T}}_{{\rm{non}}}} + {\rm{LABO}}{{\rm{R}}_{{\rm{non}}}} + {\rm{LAN}}{{\rm{D}}_{{\rm{non}}}}} \right)\end{align*}$$
Using the values from Griffin and Bowling (Reference Griffith and Bowling2020), the total cost reduction is estimated to be $199.23 per head for certified cattle compared to uncertified cattle (Table 8).
Table 8. Cost differences by VQA certification status, as described in equation (7)
Finally, the effect of VQA certification on per-head profitability is
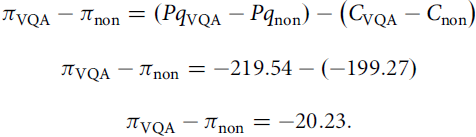 $$\begin{gathered}
{\pi _{{\text{VQA}}}} - {\pi _{{\text{non}}}} = (P{q_{{\text{VQA}}}} - P{q_{{\text{non}}}}) - \left( {{C_{{\text{VQA}}}} - {C_{{\text{non}}}}} \right) \\
{\pi _{{\text{VQA}}}} - {\pi _{{\text{non}}}} = - 219.54 - ( - 199.27) \\
{\pi _{{\text{VQA}}}} - {\pi _{{\text{non}}}} = - 20.23. \\
\end{gathered}$$
$$\begin{gathered}
{\pi _{{\text{VQA}}}} - {\pi _{{\text{non}}}} = (P{q_{{\text{VQA}}}} - P{q_{{\text{non}}}}) - \left( {{C_{{\text{VQA}}}} - {C_{{\text{non}}}}} \right) \\
{\pi _{{\text{VQA}}}} - {\pi _{{\text{non}}}} = - 219.54 - ( - 199.27) \\
{\pi _{{\text{VQA}}}} - {\pi _{{\text{non}}}} = - 20.23. \\
\end{gathered}$$
On a per-head basis, VQA cattle are less profitable than uncertified cattle, because the revenue effect of lighter sale weights outweighs the increase in profits from higher prices received and lower feed, labor, and interest costs. However, the lighter sale weight of VQA cattle also means that they spend less than half as much time on the farm, making it possible to produce two batches of cattle per year where only one batch of heavier cattle is possible. The distribution of lots by month and certification status suggests that this is the case, with most uncertified cattle being marketed in the summer months, while VQA cattle are marketed in the summer and again in the winter months (Figure 2). Although uncertified cattle could be sold at a lighter weight, for the lots in our data set, this is emphatically not the case (Table 2).
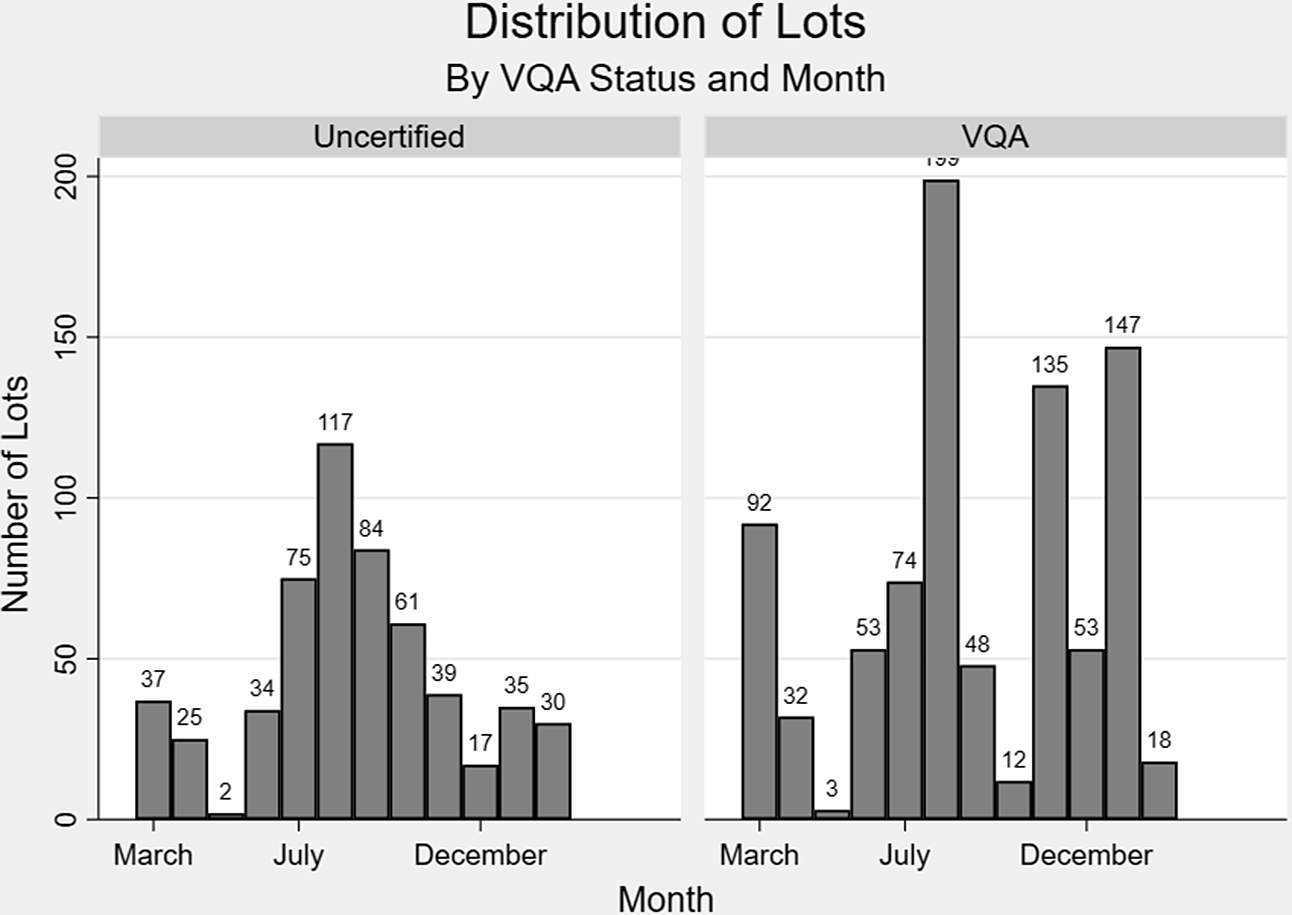
Figure 2. Distribution of VCA Tel-O-Auction sale lots by VQA certification status and month.
Source: VCA Tel-O-Auction bills of sale.
This increase in the number of head produced leads to higher overall annual profits for producers of VQA cattle. By producing two batches per year, producers of certified cattle can spread their fixed costs over more animals and earn profits that are 63.6% higher per head per day than for a single batch of heavier cattle (Table 7, net return/head/day). Because certified cattle are on feed for a shorter time, they also use less than half as much pasture per head. Combined with higher prices received, this higher stocking density increases their returns per acre by 64.5% (Table 7, net return/acre) and makes them attractive to producers for whom land is a constraint. Reducing the time and land needed to produce an animal can allow greater stocking densities, allow for replacement with fresh animals, or even allow the expansion of other farm operations (such as adding more cow-calf pairs for farms who produce both calves and feeder cattle). Although VQA cattle have lower revenue per head, their faster turnover and higher stocking density allow operations producing VQA cattle to earn greater total revenues for the operation than those producing uncertified cattle (Table 7, land rent).
Non-VQA cattle producers can also turn their cattle over faster by selling their cattle at lighter weights, but even small differences in price and average daily gain mean that they will not see the increase in profitability that VQA producers do. By selling cattle at a weight of 677 lbs. (the mean for VQA cattle) and given their slightly lower average daily gain of 1.9 lbs., non-VQA cattle will be ready for market in 91 days, which is comparable to the 82 days for VQA cattle. However, because of their lower sale price, lighter non-VQA cattle will generate a net return of only $0.28 per head per day, compared to $0.55 for heavier non-VQA cattle at the same price and $0.90 for VQA cattle. Thus, even if non-VQA producers produce roughly the same number of head in the same number of batches with roughly the same productive season, their net returns will still be less than one-third of the returns realized by VQA producers buying and selling at the same weights. On the other hand, if we set prices equal using the original sale weights but the mean price for the entire sample of $1.66/lb., uncertified cattle become slightly more profitable per head per day at ($0.79) than the reduced profits for VQA cattle at $0.74 per head per day. This demonstrates that both faster turnover and price advantages play a role in making certified cattle more profitable per head per day.
5. Conclusions
The analysis suggests that the VQA program does not have a large price effect, but it has a positive impact on producer profitability by allowing production of a greater number of smaller, higher-priced feeder cattle. These cattle have been handled properly and will gain weight faster in a feedlot due to their smaller size. Cattle marketed through the VQA program are fed for a shorter time, command higher prices per hundredweight, and increase producer profits. The increase in profitability may be the main incentive for participation in the program.
Although prior work on value-added feeder cattle programs suggests that certification programs should increase the price received for feeder cattle (Williams et al., Reference Williams, Raper, DeVuyst, Peel and McKinney2012; Zimmerman et al., Reference Zimmerman, Schroeder, Dhuyvetter, Olson, Stokka, Seeger and Grotelueschen2012), our analysis does not suggest a consistently high premium to certification once controlling for other factors. The difference in prices by weight and certification status suggests that the certification is more valuable for younger cattle, perhaps indicating the use of the certification to manage risk for buyers of younger cattle. Regional differences may also play a role, particularly given the role of local extension and producer associations in marketing and producer participation. Price premiums for VQA certification vary over time, as do profits per acre, but this analysis suggests that profits per acre provide a stronger and more consistent motivation for producers seeking VQA certification than do price premia.
We conclude that the VQA program adds value to Virginia’s feeder cattle industry by increasing producer profits and reducing the demands of feeder cattle on land and time. Prior studies have judged feeder cattle certification programs solely on their ability to command price premiums, but we find that there are important differences in the regimes used to produce VQA and noncertified cattle. The difference in regimes leads to differences in profitability with regard to important production constraints (in this case, time on feed and land available).
These findings have important implications for work in the USA and elsewhere. In the USA, these findings encourage researchers to focus on the profitability (rather than price) of new practices before suggesting their adoption to producers. This is as true for feeder cattle as it is in other contexts, such as organic certification (Spalding and Sexton, Reference Spalding and Sexton2019). This study highlights the importance of profitability relative to major production constraints. Although time and land used are still important considerations in the USA, they can be even more crucial in contexts where land markets may function imperfectly or where time for off-farm employment is an important part of family income. Thus, research in international contexts should look for certifications that increase profits and create incentives for judicious use of scarce resources. Certification literature should be driven by the issues that matter most to the potential users—in this case, farmers.
Data Availability Statement
All data and code used in this study are available from the corresponding author by request.
Funding Statement
This work was supported by funding from the Virginia Agricultural Experiment Station.
Competing Interests
The authors declare none.
Author Contributions
Conceptualization: B.G., J.A., G.W.N., and J.B.; data curation: B.G.; formal analysis: B.G., J.A., G.W.N., and J.B.; funding acquisition: J.A. and G.W.N.; investigation: B.G.; methodology: B.G., J.A., G.W.N., and J.B.; project administration: J.A. and G.W.N.; software: B.G.; supervision: J.A. and G.W.N.; visualization: B.G. and J.B.; writing—original draft: B.G.; writing—review and editing: B.G., J.A., G.W.N., and J.B.


 Open access