


Introduction
Animal welfare is an important component of decision making on farms and is something desired by consumers and wider society (Rivero and Lee, Reference Rivero and Lee2022). Within beef systems, one of the most critical decisions to be made is the extent to which cattle are housed or grazing on pasture. Across England, approximately 0.87 of farms use a mixture of housing and grazing and 0.04 exclusively house their cattle (DEFRA, 2019). There are potential welfare benefits to both housing and grazing, as well as environmental, economic and social benefits. Housing protects animals from adverse weather and ground conditions that could otherwise cause welfare losses such as lameness (Gregory et al., Reference Gregory, Craggs, Hobson and Krogh2006), though properly managed grazing has also been found to reduce similar welfare losses (Haskell et al., Reference Haskell, Rennie, Bowell, Bell and Lawrence2006). There is growing evidence which suggests cattle find grazing environments more psychologically ‘rewarding’ than indoor environments (Crump et al., Reference Crump, Jenkins, Bethell, Ferris, Kabboush, Weller and Arnott2021) and that access to pasture can provide welfare benefits (Charlton and Rutter, Reference Charlton and Rutter2017; de Graaf et al., Reference de Graaf, Ampe and Tuyttens2017). Inevitably, decisions surrounding housing/grazing will impact diet which will in turn impact performance. This is reflective of the fact that housed systems are typically used as a means to intensify production.
The demand for ‘ethical’ animal products is increasing, driven by a moral view from consumers about the societal responsibility to care for animals (Frey and Pirscher, Reference Frey and Pirscher2018). Consumers generally view pasture-reared livestock to be more ethical on the basis of animal welfare and environmental standards (Xue et al., Reference Xue, Mainville, You and Nayga2010; Stampa et al., Reference Stampa, Schipmann-Schwarze and Hamm2020; Wilkinson et al., Reference Wilkinson, Lee, Rivero and Chamberlain2020). This also provides an economic opportunity due to the price premiums available for animal products perceived to be of higher welfare standards (Lagerkvist and Hess, Reference Lagerkvist and Hess2011; Yang and Renwick, Reference Yang and Renwick2019; Cornish et al., Reference Cornish, Briley, Wilson, Raubenheimer, Schlosberg and McGreevy2020).
Welfare work on cattle has overwhelmingly focussed on the dairy sector, due to larger herd sizes, greater preference towards continual housing (relative to beef) and the fact that the output (milk) is produced continuously and thus any short-term adversity has an instant financial impact. There is, therefore, a need to improve our holistic understanding of beef cattle welfare. Assessing animal welfare, however, is challenging. Welfare is not one single variable; it is a complex interaction of all aspects of an animal's existence and being. It is therefore essential to address welfare assessment holistically, considering factors spanning different aspects of the animal (Mellor and Reid, Reference Mellor and Reid1994; Rivero and Lee, Reference Rivero and Lee2022).
Of the five ‘Domains’ of animal welfare, i.e. Nutrition, Environment, Health, Behaviour and Mental State (Mellor, Reference Mellor2016), the health domain of animal welfare is perhaps the most apparent indicator, being evidenced by the animals physical health and condition, factors that are often easily visible, unambiguous or part of wider husbandry checks and veterinary care. These can be assessed by looking into the veterinary records of animals or by direct assessment, using procedures such as those outlined by the Welfare Quality protocol (Welfare Quality®, 2009) and the Beef Cattle Assessment Protocol (AssureWel, 2017), both of which cover health indicators such as: discharges, hairlessness and lameness. Behavioural assessment, on the other hand, is an element that can provide insights into the behavioural domain of animal welfare. In recent years, qualitative behaviour assessments (QBA) (Wemelsfelder, Reference Wemelsfelder2008) has become a popular approach both academically and commercially (Fleming et al., Reference Fleming, Clarke, Wickham, Stockman, Barnes, Collins and Miller2016; Battini et al., Reference Battini, Barbieri, Vieira, Can, Stilwell and Mattiello2018; Ceballos et al., Reference Ceballos, Góis, Sant'Anna, Wemelsfelder and Paranhos da Costa2021; Waitrose and Partners, 2021; Cooke et al., Reference Cooke, Mullan, Morten, Hockenhull, Lee, Cardenas and Rivero2022). The method has also shown potential in the detection of illness (Health ‘domain’), such as mastitis (de Boyer des Roches et al., Reference de Boyer des Roches, Lussert, Faure, Herry, Rainard, Durand, Wemelsfelder and Foucras2018), though studies investigating correlations with other health, clinical and welfare indicators have yielded mixed results (Brscic et al., Reference Brscic, Wemelsfelder, Tessitore, Gottardo, Cozzi and Reenen2009; Battini et al., Reference Battini, Barbieri, Vieira, Can, Stilwell and Mattiello2018). However, QBA should not be used in isolation and may have limited correlation with other welfare assessments such as the Welfare Quality protocol (Andreasen et al., Reference Andreasen, Wemelsfelder, Sandøe and Forkman2013). Hormone levels can act as indicators and drivers of both health and mental state (one of the domains of animal welfare). For example, cortisol is a steroid hormone that is widely regarded as an indicator of stress and anxiety in cattle (Mitchell et al., Reference Mitchell, Hattingh and Ganhao1988; Bristow and Holmes, Reference Bristow and Holmes2007) and can be elevated in response to events such as social separation (Boissy and Le Neindre, Reference Boissy and Le Neindre1997) but also overcrowding (Friend et al., Reference Friend, Polan, Gwazdauskas and Heald1977). However, whilst there has been some assumption that cortisol is indicative of cattle welfare, van Eerdenburg et al. (Reference van Eerdenburg, Hof, Doeve, Ravesloot, Zeinstra, Nordquist and van der Staay2021) found that it did not correlate with other welfare assessments such as the Welfare Quality protocol. Serotonin is an important neurotransmitter which regulates a variety of bodily processes including the secretion of growth hormones (Kasuya et al., Reference Kasuya, Yayou, Hashizume, Kitagawa and Sutoh2010), regulation of lactation (Collier et al., Reference Collier, Hernandez and Horseman2012) and the immune system (Wu et al., Reference Wu, Denna, Storkersen and Gerriets2019). In humans, low levels and deficiencies of serotonin have been linked to depression and various mood disorders (Cowen and Browning, Reference Cowen and Browning2015). Sunlight has also been found to promote the turnover and synthesis of serotonin in humans (Lambert et al., Reference Lambert, Reid, Kaye, Jennings and Esler2002), though this has not been studied in cattle, thus there is the potential that restricting exposure of cattle to sunlight, due to housing, could influence serotonin concentrations. Non-invasive hormone quantification is possible using saliva or nasal mucus, which have been found to correlate with serum concentrations (Houbeau et al., Reference Houbeau, Sulon, Demey-Ponsart and Mélon1986) and are matrices widely used to quantify various biomarkers (Silva et al., Reference Silva, Bassetto and Amarante2012; Johnsen et al., Reference Johnsen, Chincarini, Sogstad, Sølverød, Vatne, Mejdell and Hänninen2019). The environmental domain can interact strongly with the other four domains. For beef cattle, two of their most common environments are open pasture or enclosed barns, which are largely different environments in terms of factors such as space and climate. This ties in closely to the nutritional domain as housed and grazed cattle differ greatly in the feeds that they received, but also how they consume them.
This work aimed to address the question: How do the health and welfare of beef cattle differ between housed systems and conventional systems? For that purpose, we assessed two beef cattle herds, with and without access to pasture after winter housing, across a variety of health, welfare and performance metrics.
Materials and methods
This study compared the welfare of two herds of finishing beef cattle, one in a housed system and the other in a conventional system. Welfare and health were assessed across four key areas:
1. Physical health – Body condition and health inspections conducted on an individual animal basis. Also, veterinary records for any treatments.
2. Behavioural – QBA was conducted at a group level.
3. Endocrinology – Concentrations of cortisol and serotonin in both hair and nasal mucus on an individual animal basis.
4. Performance – Analysis of monthly liveweight data.
Site and population description
The experiment was conducted at the Biotechnology and Biological Sciences Research Council's National Bioscience Research Infrastructure, hosted at Rothamsted Research: The North Wyke Farm Platform (Devon, UK) (Orr et al., Reference Orr, Murray, Eyles, Blackwell, Cardenas, Collins, Dungait, Goulding, Griffith, Gurr, Harris, Hawkins, Misselbrook, Rawlings, Shepherd, Sint, Takahashi, Tozer, Whitmore, Wu and Lee2016, Reference Orr, Griffith, Rivero and Lee2019; Takahashi et al., Reference Takahashi, Harris, Blackwell, Cardenas, Collins, Dungait, Hawkins, Misselbrook, McAuliffe, McFadzean, Murray, Orr, Rivero, Wu and Lee2018). Weather patterns for the study period are included in online Supplement A.
Two beef rearing systems were compared. The first system had cattle housed all year around, named ‘HH’. The second system saw cattle housed during the winter months, but grazing on pasture the rest of the year, named ‘HG’. Both herds had 30 head of the breeds stabiliser (ST) and stabiliser cross (STX) cattle, all of which derived from the same suckler herd. Animals were allocated from the suckler herd at weaning (27 October 2020) to one of the two systems. At allocation both resultant herds had the same mean age and weight (235 days [s.d. 18.2], 332 kg [s.d. 36.4]). The sex ratio was similar between herds (F:M, 21:9 and 23:7, respectively) as was breed ratio (ST:STX, 24:6 and 23:7, respectively).
HH (housed-housed) – The herd was housed from weaning (27 October 2020) until finishing at ~14–15 months age. During this time, they received grass (predominately perennial ryegrass; Lolium perenne) silage ad libitum, 4 kg per head of rolled barley (Hordeum vulgare) and 0.3 kg per head of wheat (Triticum aestivum) distiller's grain.
HG (housed-grazing) – This herd were housed from weaning (27 October 2020) through winter, during which they received grass silage (predominately perennial ryegrass) ad libitum. In spring, the herd were turned out onto pasture (13 April 2021), which was dominated (>0.60) by perennial ryegrass, with a smaller abundance of creeping bent (Agrostis stolonifera), Yorkshire fog (Holcus lanatus) and marsh foxtail (Alopecurus geniculatus) also contributing to the sward; legumes comprised <0.01 of the overall composition (Orr et al., Reference Orr, Murray, Eyles, Blackwell, Cardenas, Collins, Dungait, Goulding, Griffith, Gurr, Harris, Hawkins, Misselbrook, Rawlings, Shepherd, Sint, Takahashi, Tozer, Whitmore, Wu and Lee2016, Reference Orr, Griffith, Rivero and Lee2019).
Both herds were housed in separate, but adjacent, straw-bedded barns built to the same specification/blueprints. The available space was 24 × 11 m which included a bedding area (7.5 × 24 m) and concrete floored area (3.5 × 24 m). Straw bedding was added to pens daily using a tractor trailed straw chopper. The concreted area was scraped every morning to remove dung and urine using a tractor mounted yard scraper. The entire daily feed ration was distributed along the length of a ground-level feed passage using a tractor trailed forage mixer wagon every morning after bedding and scraping. The feed passage was adjacent to the concreted area and allowed access to feed through diagonal bars. Every evening the remaining feed was pushed up using a tractor mounted silage pusher to ensure it was able to be reached by the animals. The forage mixer wagon was equipped with weigh cells enabling accurate measurement of rations.
Animals were weighed every ~4 weeks and selected for slaughter on the basis of visual assessment and palpation of skeletal reference points as they approach target weights (approx. 620–680 kg for steers, 550–580 kg for heifers) and fat class (4L on the union scale: – moderately high fat cover, lean). Throughout the course of the study, the number of cattle in the HH herd decreased as they were sold to slaughter as part of normal management practice (online Supplement B) this was due to the high growth rates compared to the HG herd.
Physical assessments
Cattle were examined across eight health indicators that covered a range of symptoms associated with common disease/infections of cattle. These were selected and adapted from the Welfare Quality protocol (Welfare Quality®, 2009) and AssureWel protocol (AssureWel, 2017) (Table 1). Checks were conducted along the right side of their bodies whilst they were in the race, waiting to be weighed, thus mitigating for potential time and stress of assessments. Two assessments were conducted during the winter (2 November 2020 and 16 November 2021), when both herds were housed, and two conducted in the summer (16 May 2021 and 21 June 2021), when the HH herd were housed but the HG herd were on pasture. Body condition scoring (BCS) was conducted at the same time, scores were given in line with NADIS guidelines (NADIS, 2010), to whole integers (1–5) (Table 1).
Table 1. Top: List of physical indicators and description of scoring
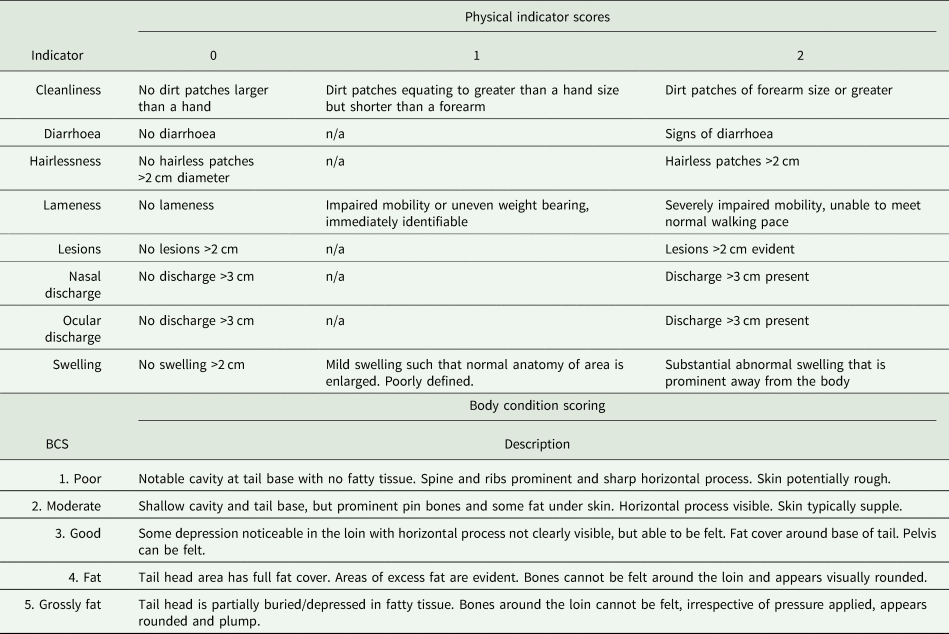
‘n/a’ signifies that that value is not possible and thus the indicator is a binary measure. Bottom: body condition scoring, scores and relevant description (NADIS, 2010).
Qualitative behaviour assessment
QBA was conducted on a weekly basis for both herds. Assessments were conducted by a single assessor with previous experience conducting QBA on beef cattle and who is a qualified professional in animal science with approximately seven years' experience. In previous studies (Cooke et al., Reference Cooke, Mullan, Morten, Hockenhull, Lee, Cardenas and Rivero2022) the assessor showed a very high level of inter-observer reliability (0.78–0.87) with other assessors. Assessments were conducted during daylight hours and both herds were observed within a 30-min window on any given day, excluding the short windows during which husbandry activities (bedding, cleaning, feed being added) were actively occurring. Cattle were observed for 10 min in their ‘home’ environment (e.g. housing or pasture). The assessor watched, stationary, from the outside of the feeding passage of field boundary. If it was felt that the animal's behaviour changed due to their presence the assessor was instructed to wait two minutes for that effect to subside – though this was never necessary as the cattle were familiar with the presence of people. Cattle were scored on a 125 mm visual analogue scale across 20 terms, based on the prevalence and intensity of the relevant factor. Those terms were: Active, Agitated, Apathetic, Bored, Calm, Content, Distressed, Fearful, Friendly, Frustrated, Happy, Indifferent, Inquisitive, Irritable, Lively, Playful, Positively occupied, Relaxed, Sociable, Uneasy (terms taken from the Welfare Quality protocol, see online Supplement C for brief descriptions of these terms).
Hormone levels
Cortisol and serotonin were quantified in the hair and nasal mucus of the cattle. Cortisol was considered as an indicator of stress and anxiety (Boissy and Le Neindre, Reference Boissy and Le Neindre1997; Bristow and Holmes, Reference Bristow and Holmes2007) with nasal concentrations being correlative to those in plasma and saliva (Houbeau et al., Reference Houbeau, Sulon, Demey-Ponsart and Mélon1986). Serotonin was considered in relation to its role as a neurotransmitter influencing mood (Marrero et al., Reference Marrero, Dado-Senn, Field, da Silva, Skibiel and Laporta2019) with higher levels assumed as preferential.
Sample collection and preparation
Hair and nasal mucus samples were taken at the same time as physical checks were conducted. Hair was taken using an electric shearer, from an unshaven/unclipped area around the base of the neck and between shoulder blades. Hair length and growth rates were not measured, though no difference was apparent between herds. Hair samples were stored at −20°C prior to further preparation. Samples were prepared by protocol adapted from van Eerdenburg et al. (Reference van Eerdenburg, Hof, Doeve, Ravesloot, Zeinstra, Nordquist and van der Staay2021) and Sharma et al. (Reference Sharma, Umapathy, Kumar and Phillips2019). Briefly: hair was washed, dried and ground. Methanol was then used to extract hormones from the ground hair, the methanol was evaporated off and the remanent material suspended in PBS (phosphate-buffered saline) for analysis. Nasal mucus was collected using sterile cotton swabs, to a nostril depth of approximately 5 cm. Methanol extraction was conducted on the mucus, methanol evaporated off and the material suspended in PBS for analysis. More information on hormone extraction is included in online Supplement D.
Hair and nasal mucus extracts (suspended in PBS) were analysed for cortisol and serotonin concentrations. Cortisol was quantified by enzyme linked immunosorbent assay (ELISA) using a commercially available kit (Salimetrics, USA, #1-3002). Methodology was adapted from the manufacturer instructions and are further detailed in online Supplement E. Serotonin was also quantified by ELISA using a high sensitivity kit (DLD Diagnositka GMBH, Germany, EA 630/96) in line with manufacturer instructions (see online Supplement E). Once concentrations in the sample extracts were quantified, concentrations relative to the amount of material (hair or nasal mucus) were calculated.
Data analysis
Results for physical health indicators were analysed using cumulative link models (CLM). The dependent variable was the score for the relevant indicator and the independent variables were season, timepoint (nested within season) and herd. The exception to this was the measure of ‘hairlessness’ which had insufficient variance of results for CLM analysis, instead, a general mixed effect model was conducted.
Results from QBA were subject to PCA analysis with scaling and centring (variables centred to a mean of 0 and scaled to a standard deviation of 1). From this, first and second principal components (PC1 and PC2) were derived. Results were reported with 95% confidence ellipses for each treatment each season. For each season, two-tailed t tests were conducted to compare herds across both PC1 and PC2.
Hormone data was analysed using repeated measures ANOVAs with concentrations as the dependent variable and timepoint and herd as independent variables. Post-hoc Tukey testing was then conducted to determine differences between herds at all timepoints.
Cattle growth rates were compared using a general linear model (Gamma distribution) that considered herd, breed and sex as factors.
Across all timepoints and both herds, hormone concentrations, negative health scores and performance (average daily gain, ADG) were compared against each other by way of Kendall's rank correlation. Negative health scores were determined per animal, per timepoint, as the sum of scores for cleanliness, diarrhoea, hairlessness, nasal discharge, ocular discharge, swelling, lesions and lameness.
Statistical analysis and figures were performed in R (i386 4.1.2) (R Core Team, 2021) and R Studio (2021.09.1) (R Studio Team, 2020) using packages ggplot2 (Wickham, Reference Wickham2016), ggfortify (Tang et al., Reference Tang, Horikoshi and Li2016), ordinal (Christensen, Reference Christensen2019), and corrplot (Wei and Simko, Reference Wei and Simko2021) and Cairo (Urbanek and Horner, Reference Urbanek and Horner2020).
Results
Physical health indicators
Differences were observed in scores for physical health indicators both between herds and across time (Fig. 1). Lameness: no incidences were observed over the study period. Swelling: one swelling was observed on the head/neck of an animal in the HH herd at timepoint Summer 1, which was scored as 2 (⩾2 cm diameter). Lesions: one lesion was observed on the head/neck of an animal in the HH herd at timepoint Summer 1. BCS: scores were significantly greater in the HH herd than HG (z = 3.367, P < 0.001). During winter, across both herds scores remained relatively stable (z = 0.67, P = 0.503). Scores were significantly higher in summer than in winter in both herds (z = 7.90, P < 0.001) and increased significantly over summer (z = 7.19, P < 0.001). Cleanliness: no significant difference was found between the two herds across the study period (z = 0.03, P = 0.910). There was a significant difference in cleanliness scores across time (z = 3.95, P < 0.001) and, notably, during winter cleanliness scores were far worse at the end compared to beginning. Cleanliness appeared to improve over summer with animals significantly cleaner at the end compared to start (z = −2.68, P = 0.007) and, overall, animals were cleaner in the summer than in the winter (z = −3.10, P = 0.002). Diarrhoea: scores followed a similar trend to cleanliness scores. Higher (worse) scores were seen in winter compared to summer (z = 3.711, P < 0.001), scores were worst at the end of winter compared to start (z = 2.64, P = 0.008) and there was an improvement over summer (z = −3.41, P < 0.001). At timepoint Summer 2, the diarrhoea rate (at score 2) was higher for the HG herd (43.3%) compared to the HH herd (25.9%). Across the entire study period there was no statistically significant difference between the two herds (z = 0.19, P = 0.951). Hairlessness: incidences were relatively uncommon, though there was a peak for both herds at winter 2 which was significantly greater than at other time points (z = 5.14, P < 0.001). There was no significant difference between herds (z = 0.53, P = 0.597). Nasal discharge: At all timepoints scores were significantly (z = 4.38, P < 0.001) higher (worse) for the HH herd than for HG. A similar temporal effect to cleanliness and diarrhoea was seen with scores being greatest in winter (z = 2.96, P = 0.004) with incidence increasing (albeit not significantly at α = 0.05) over winter (z = 1.95, P = 0.051) and decreasing through summer (z = 1.72, P = 0.086). Ocular discharge: incidences were uncommon in both groups and thus there was no significant difference between herds (z = 0.40, P = 0.687) or seasons (z = 0.713, P = 0.476).

Figure 1. Results of physical inspection of animals for the purpose of scoring physical health indicators. Results are separated between herds and across four time points. (a) body condition scores (b) cleanliness scores (c) diarrhoea scores (d) hairlessness scores (e) nasal discharge scores (f) ocular discharge scores. Results for lameness, swelling and lesions are described in the text.
Veterinary treatment records showed that a total of six different conditions were treated for during the study (Table 2), three of those were observed in the HH herd and five in the HG herd. The total number of non-routine veterinary treatments was greater (18) in the HG herd compared to HH (5) during the winter, however these were predominantly preventative measures. In the summer, there were four bouts of mange treated for in the HH herd, compared to none in the HG herd, whilst five other treatments occurred in the HG herd.
Table 2. Summary of non-routine veterinary treatments divided by season, herd and condition

The number refers to the total number of treatments administered across all animals, the number in brackets refers to the total number of animals treated. A hyphen (–) signifies no treatment.
Qualitative behaviour assessment
PC1 and PC2 accounted for 0.49 of variance (Table 3 and Fig. 2). PC1 was defined as ‘arousal’ due to the high loadings for ‘Calm’, ‘Relaxed’, ‘Agitated’ and ‘Lively’, whilst : arousal and PC2 was defined as ‘mood’ based on the high loadings for ‘Bored’ and in line with the Welfare Quality® protocol. During winter, the herds differed significantly across PC1 (t = 2.23, P = 0.032) but not PC2 (t = 1.51, P = 0.139). The difference in arousal is represented by marginally calmer outcomes observed for HH relative to HG. During summer there were strong and significant differences between herds across both PC1 (t = 3.78, P < 0.001) and PC2 (t = 3.49, P = 0.002). Outcomes of HG were associated strongly with constructive and socially cohesive behaviours. There was larger variation in behaviours for HH, but with an inclination towards negative behaviours and boredom.
Table 3. Loadings of each term for PC1 and PC2
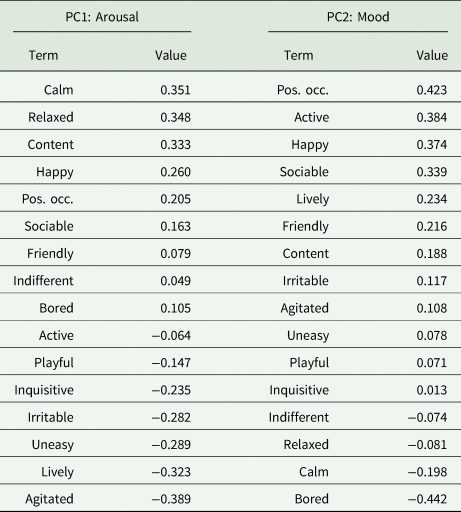
Terms are ranked based on highest to lowest value.
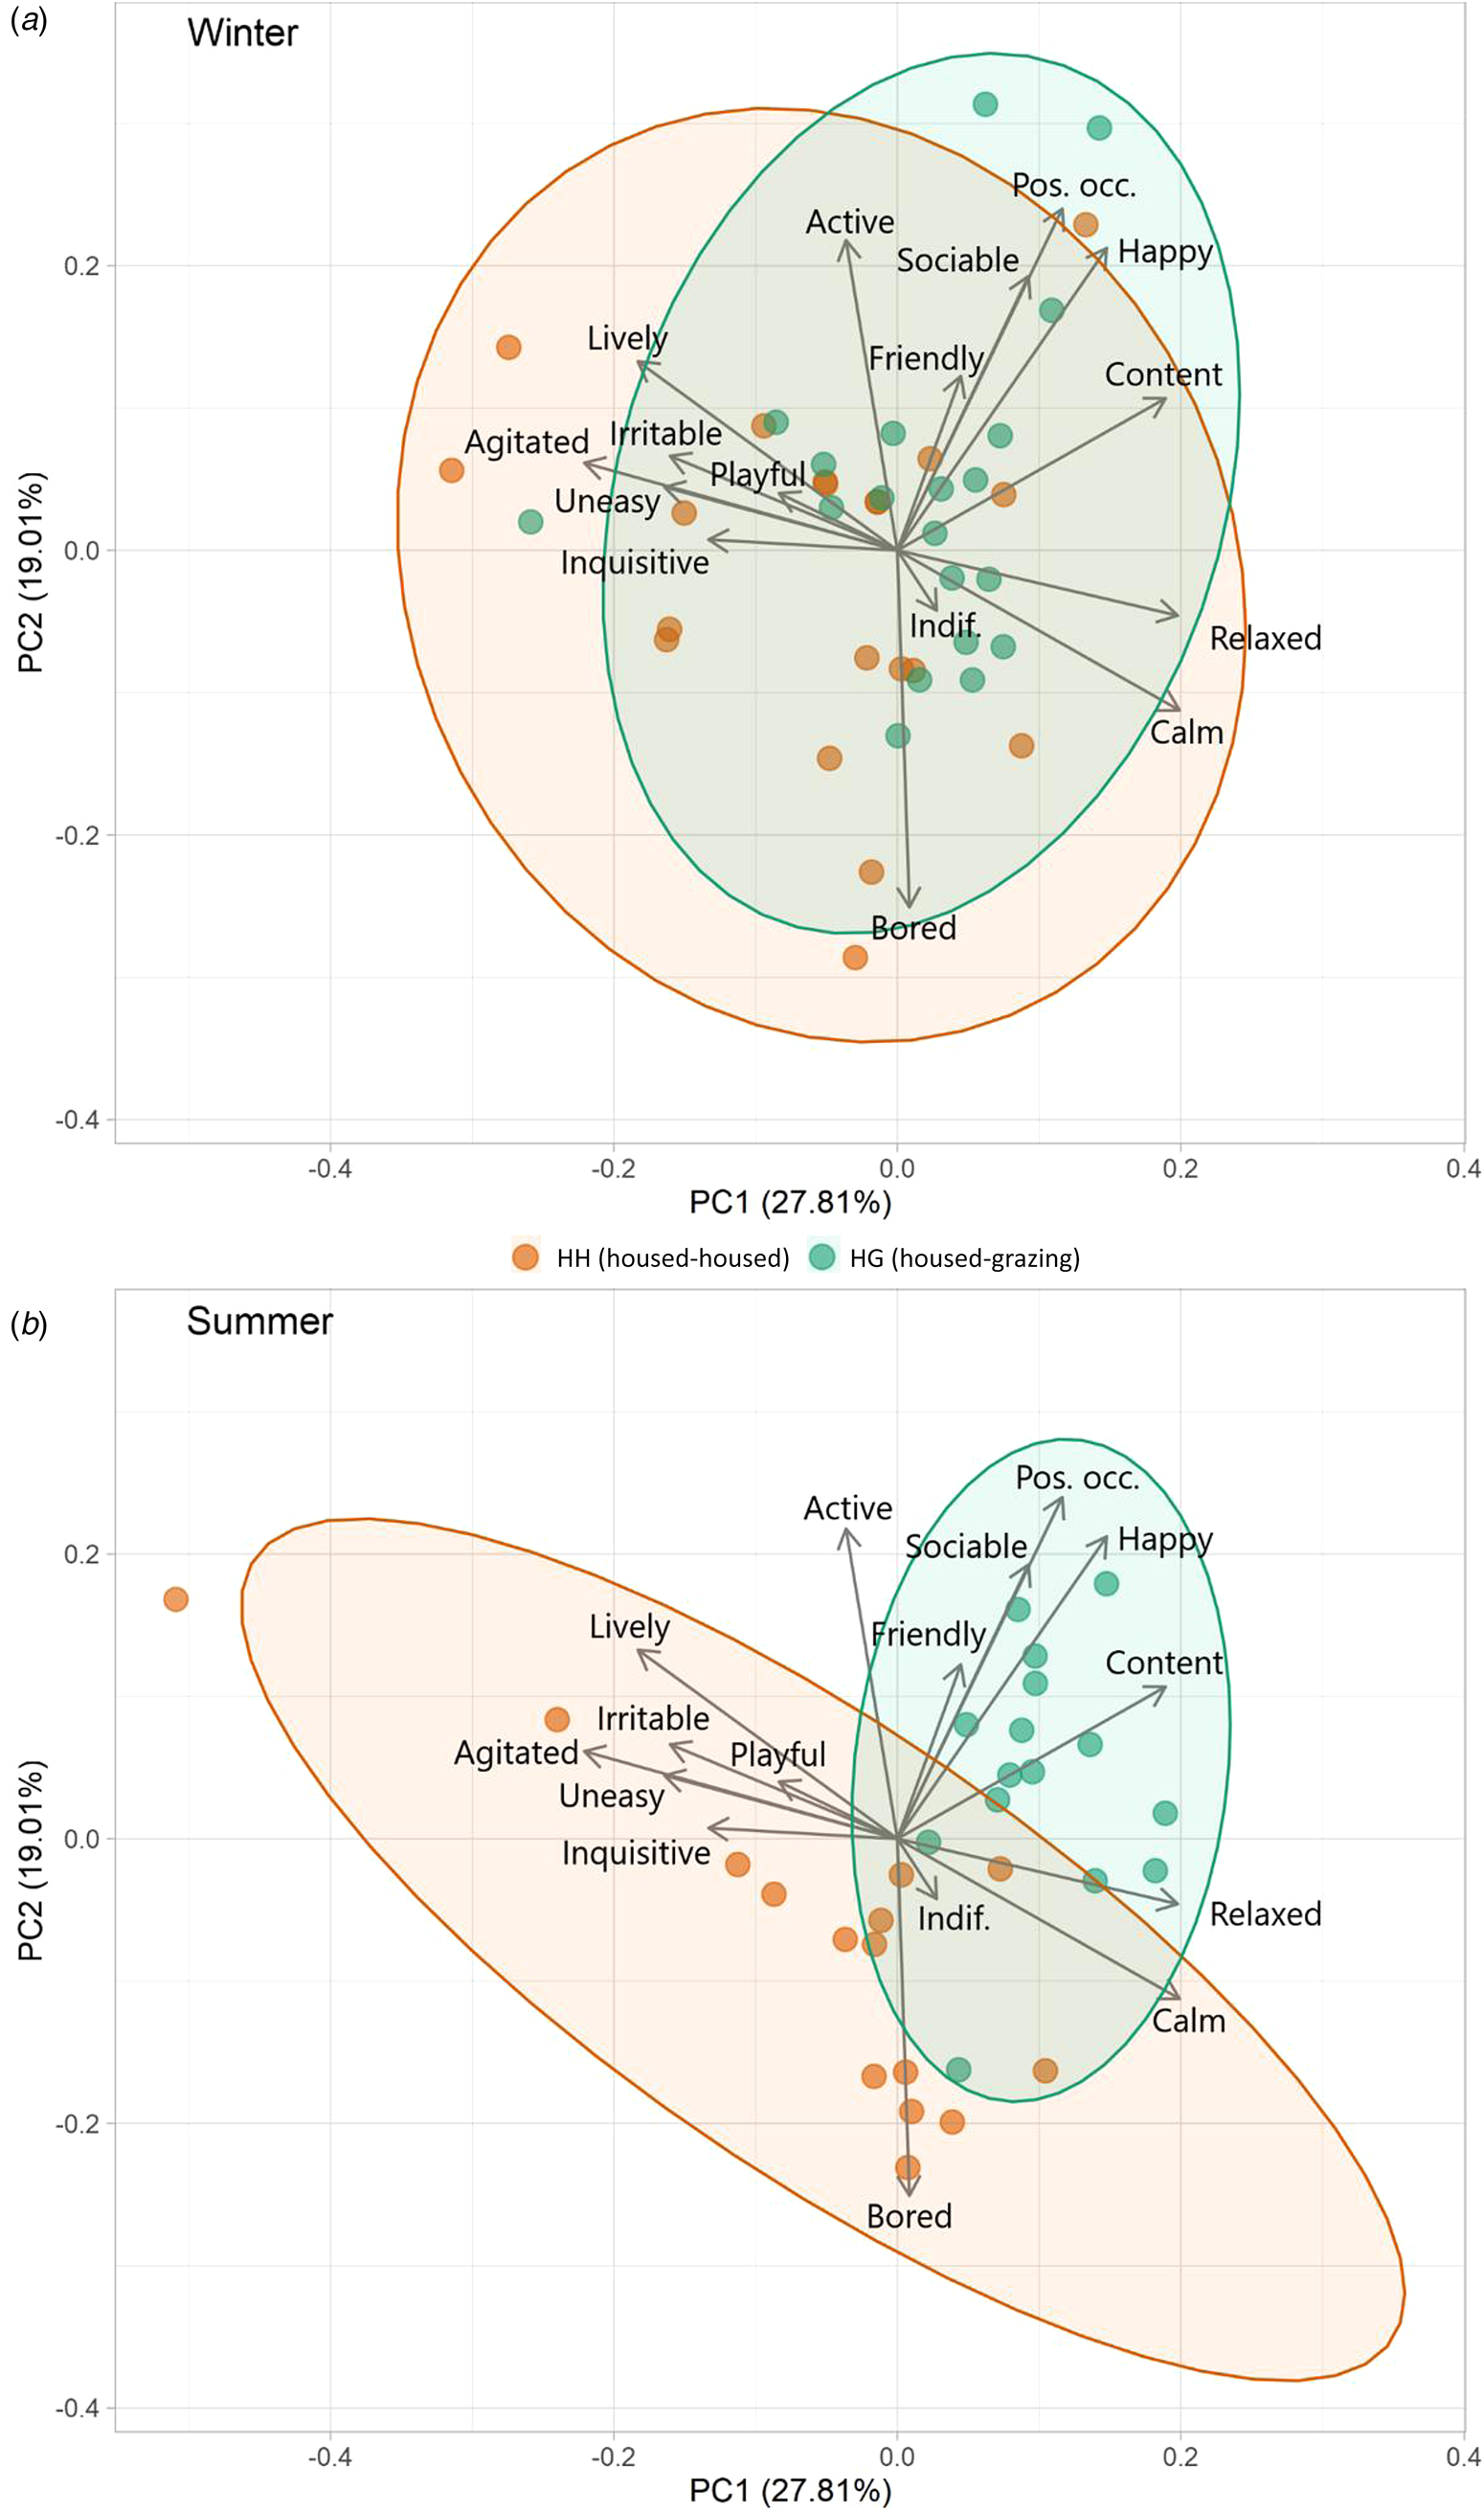
Figure 2. Biplots of PCA results from winter (a) and summer (b) QBA results, showing distribution of data for each herd. Ellipses represent 95% confidence.
Hormone levels
For the HG herd, hair cortisol concentrations (Fig. 3(a)) remained relatively stable over the study period. However, concentrations in the HH herd lowered from a median of 2.08 pg/mg across both winter timepoints to 1.26 and then 0.93 pg/mg. This yielded a significant difference between herds across the time points (F = 6.87, P = 0.011). There was also a significant effect of time (F = 3.39, P = 0.020). Temporal variations in nasal mucus cortisol concentration (Fig. 3(b)) were significant (F = 8.083, P < 0.001). However, the difference between herds was not significant across all time points (F = 2.37, P = 0.130). For the HH herd, concentrations increased from Winter 1 to Summer 1, with a sharp drop off in Summer 2. Whilst a similar shape is seen for the HG herd, it is less extreme and also earlier with a peak in Winter 2 and reduction through the Summer.

Figure 3. Split violin plots of cortisol concentrations (pg/mg) for both herds across all time points in both hair (a) and nasal mucus (b). The left half of each plot is the HH herd (coloured in HH), and the right half is the HG herd (coloured in HG). Boxes in the middle represent Q1, median and Q3. Plots that do not share a letter are significantly different to one another.
Hair serotonin concentrations (Fig. 4(a)) showed significant temporal variation across the study period (F = 56.51, P < 0.001). This was characterized by an increase in concentrations over winter followed by a sharp drop off in summer, for both herds. There was no significant difference in concentrations between herds (F = 0.019, P = 0.892). Concentrations of serotonin within nasal mucus (Fig. 4(b)) varied significantly over time (F = 6.19, P < 0.001). Across both herds, there appeared to be a gradual decrease over winter which somewhat levelled out moving through the summer. Whilst nasal mucus serotonin concentrations were higher in the HH herd than HG, this was not significant at α = 0.05 (F = 6.19, P = 0.071).

Figure 4. Split violin plots of serotonin concentrations (pg/mg) for both herds across all time points in both hair (a) and nasal mucus (b). The left half of each plot is the HH herd (coloured in HH), and the right half is the HG herd (coloured in HG). Boxes in the middle represent Q1, median and Q3. Plots that do not share a letter are significantly different to one another.
Animal performance
ADG was significantly greater for the HH herd (1.21 kg/day) compared to HG (0.74 kg/day) (t = 13.95, P < 0.001) (Table 4 and Fig. 5). A significant difference was also observed between breeds with ST cattle yielding a greater rate (1.01 kg/day) than STX (0.83 kg/day) (t = 3.11, P = 0.003). Despite steers finishing with a greater liveweights than heifers, they started the study period at a greater weight and thus differences in ADG were not significant (t = 1.58, P = 0.119).
Table 4. Summary information of cattle performance in relation to slaughter

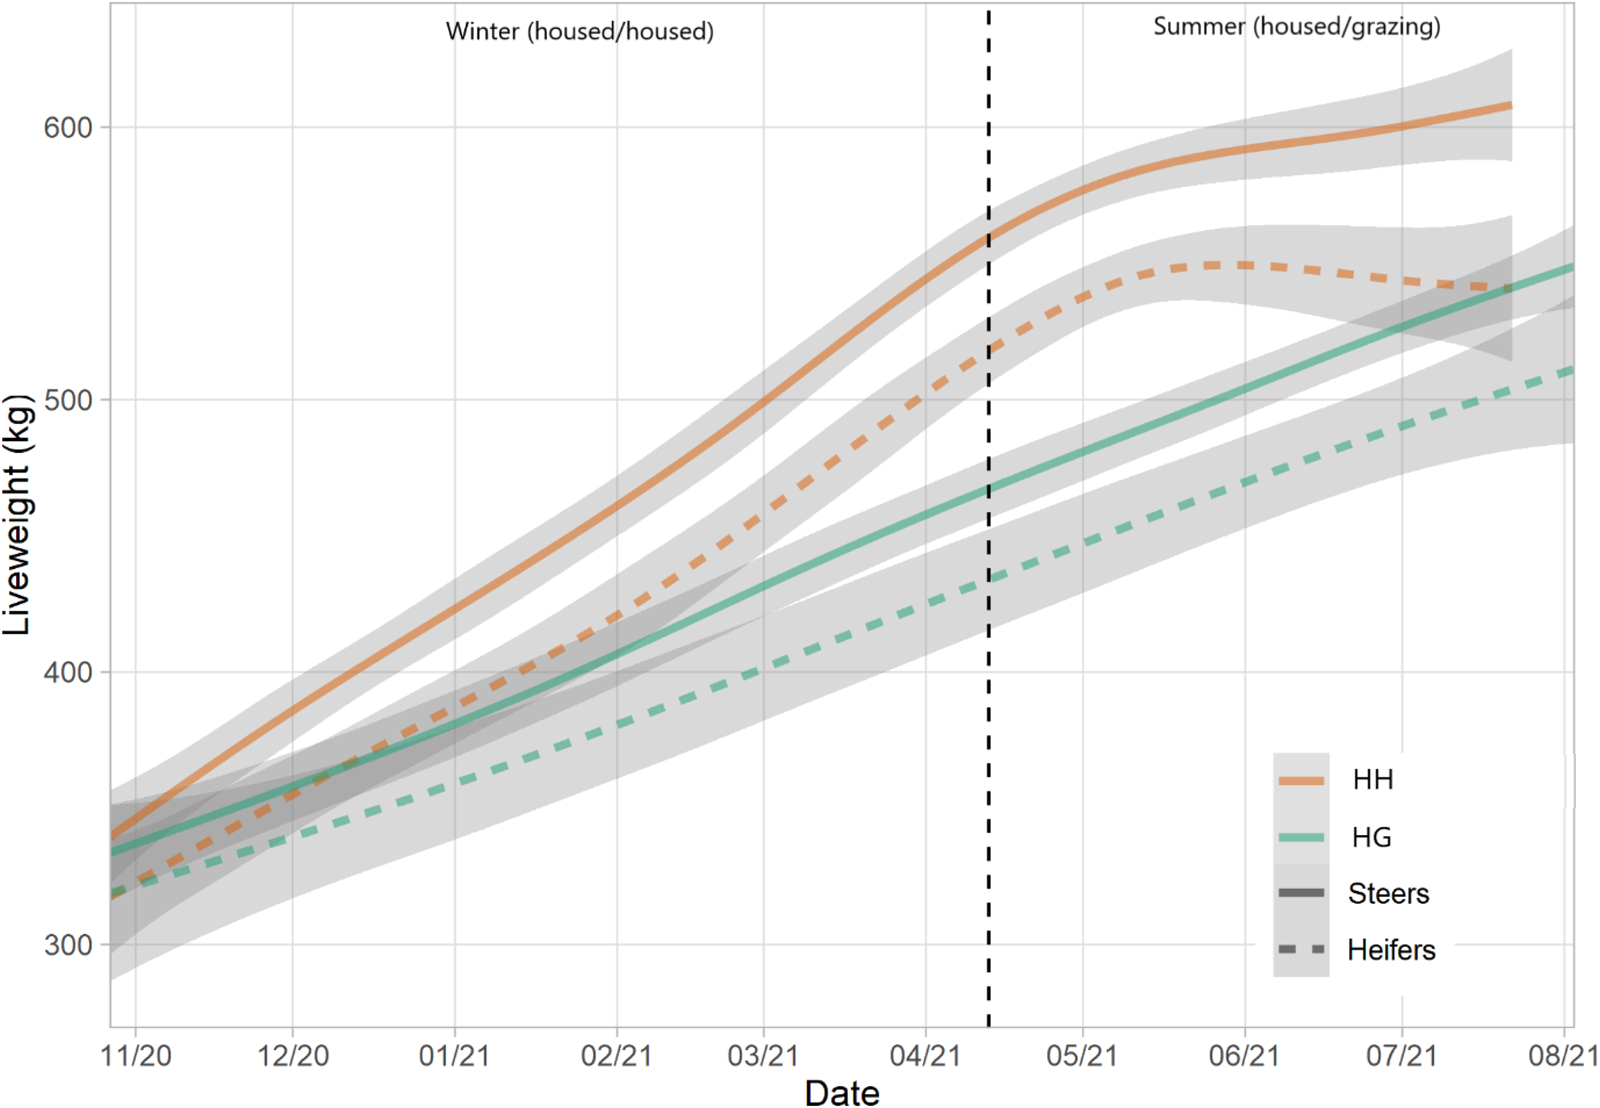
Figure 5. Liveweights of HH and HG herds over the study period, split by sex. Lines represent means and shading represents 95% confidence intervals.
Metric correlations
Metric correlations were statistically significant for 8 of 15 parings (Fig. 6). There was a moderate and statistically significant (τ = 0.377, P < 0.001) correlation of hair serotonin with negative health. The other significant correlations were weak (τ = 0.180 or less).
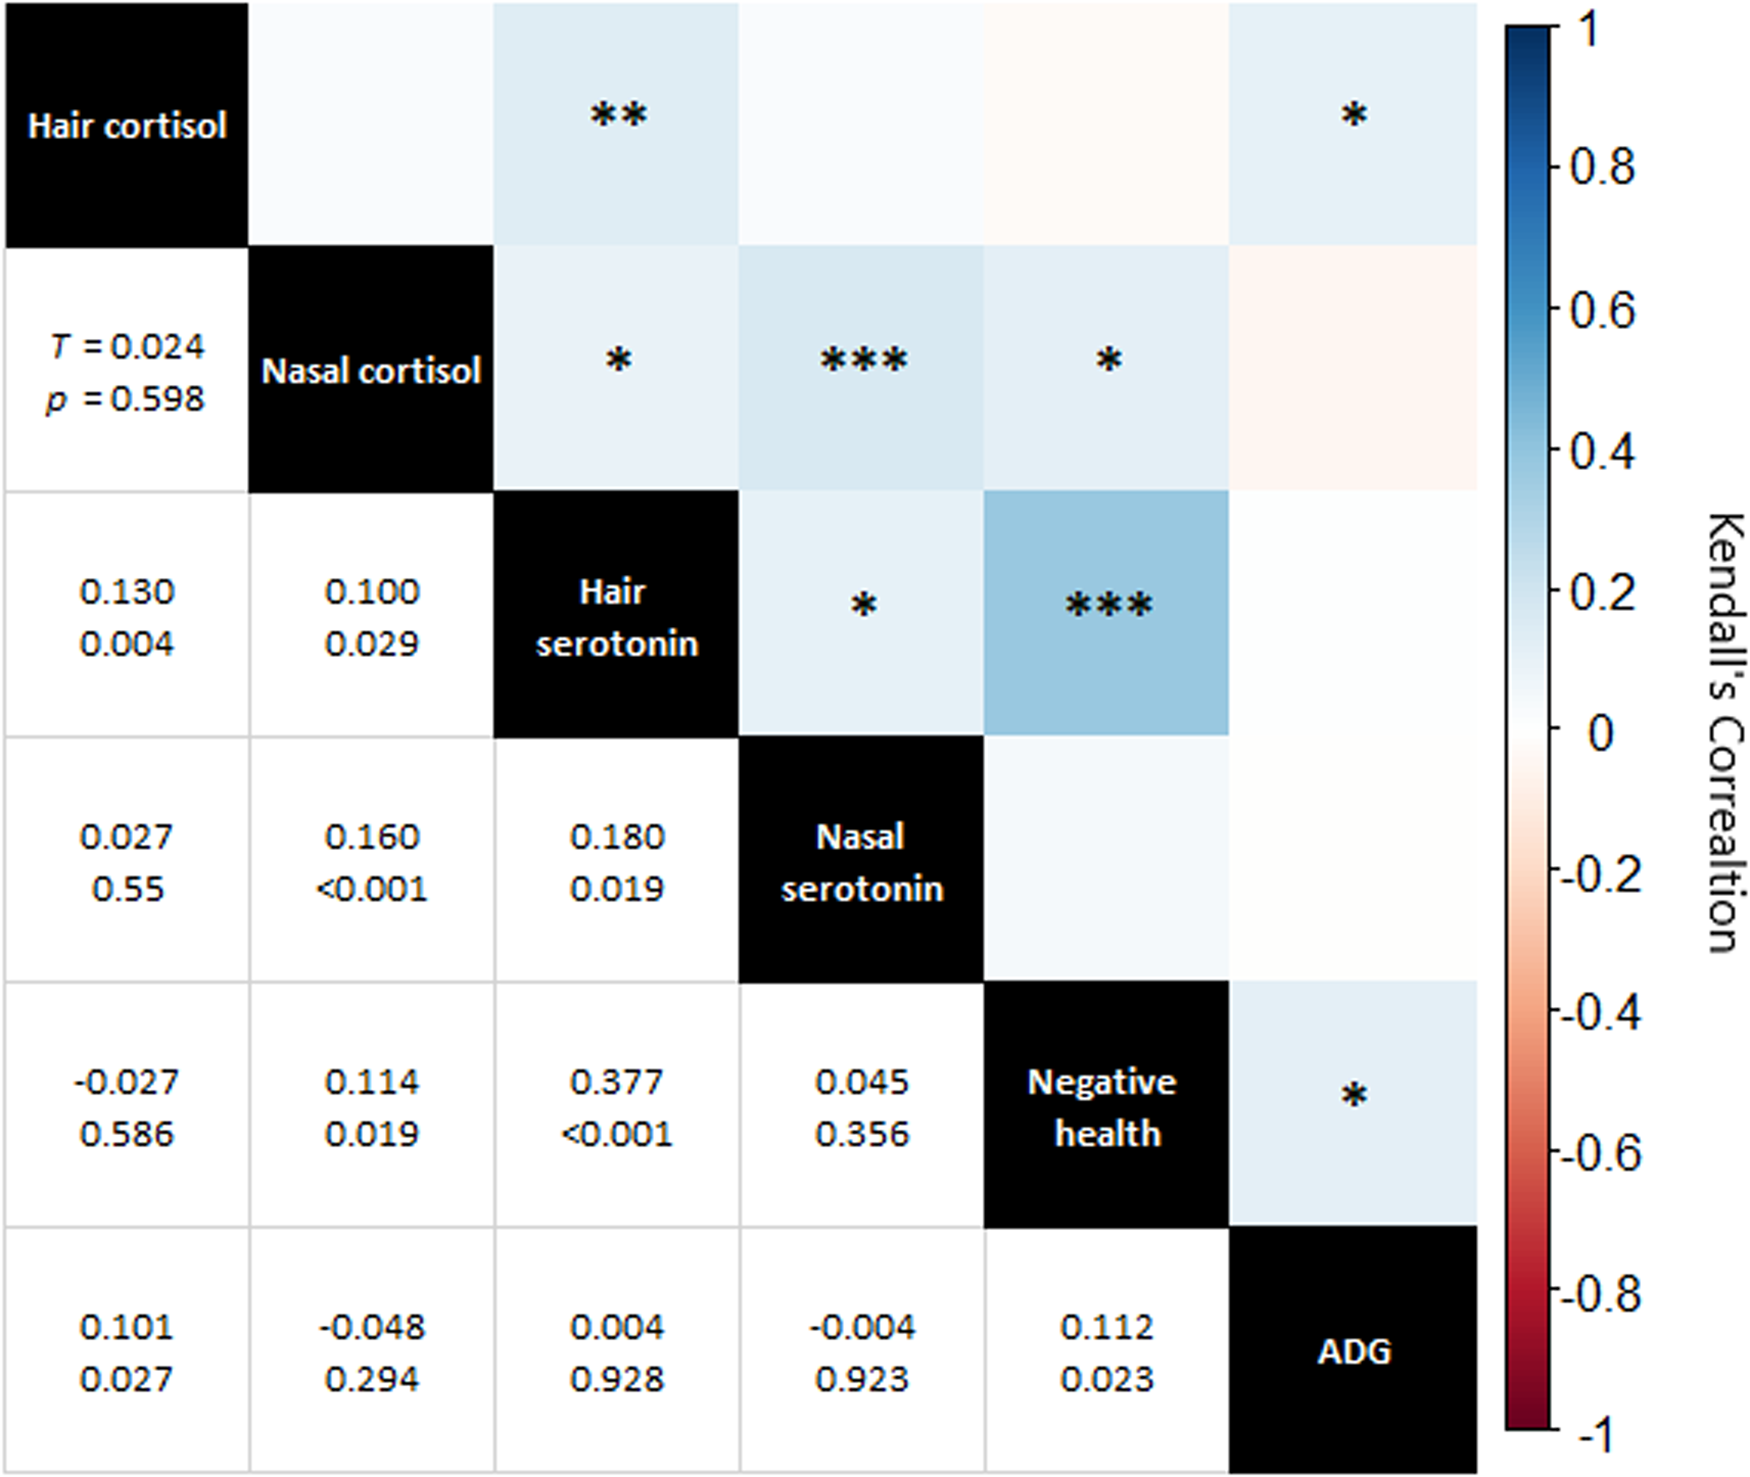
Figure 6. Correlation matrix of hormonal measures, negative health and average daily gain (ADG). Top right of chart: visual representation of correlations with colour indicating Kendall's Tau and asterixis representing P value (0.050 * 0.010 ** 0.001 *** 0.000). Bottom left, specific Kendall's Tau and P value for each correlation pairing.
Discussion
Physical indicators of health were broadly similar across the two systems. Whilst there was a significantly higher incident rate of nasal discharge for HH, this was true from the start of the study period. It continued through winter before prevalence reduced over summer. Given that, nasal discharge prevalence cannot confidently be attributed to grazing/housing. Temporal trends were far stronger than inter-group trends, with negative trait scores being higher in late winter and improving over summer. Research by de Graaf et al. (Reference de Graaf, Ampe and Tuyttens2017) found that welfare indicators scored less favourably towards the end of housing periods, suggesting that prolonged housing may be a risk-factor to welfare. However, the fact that scores for HH improved over summer, despite remaining housed suggests that this phenomenon is a combined impact of housing and cold, wet, weather – not purely a consequence of housing itself. This interpretation is supported by Wagner et al. (Reference Wagner, Brinkmann, March, Hinterstoißer, Warnecke, Schüler and Paulsen2018), who found that the overall welfare of dairy cattle (assessed by the Welfare Quality protocol) improved from winter to summer. Considering nasal discharge as an example, it is broadly accepted that respiratory infections are most common in winter (Svensson et al., Reference Svensson, Hultgren and Oltenacu2006), however, the increased proximity of cattle in housing is also a risk factor (Lago et al., Reference Lago, McGuirk, Bennett, Cook and Nordlund2006). Incidences of hairless patches were marginally more prevalent in cattle that were housed than grazing. This was attributed to potential cases of ringworm, which is more common in housed cattle due to darker, warmer and more moist conditions and due to the proximity to potential sources of infection (Rook and Frain-Bell, Reference Rook and Frain-Bell1954). Reflecting these limited differences in physiological health indicators, the extent of non-routine veterinary treatments was broadly similar between both herds. Whilst there were more treatments for eye conditions for the HG herd, this occurred during winter, when both were housed, and thus cannot be attributed to a difference in management. The mechanical chopping and spreading of straw for bedding deployed in the daily routine can create a lot of airborne particulates and this is a noted risk factor of infectious bovine keratoconjunctivitis. Consequently, staffs are particularly vigilant in responding to the signs of this condition due to historic incidences. It is unlikely that the differences between the herds were due to underreporting (personal communication, 2021). Regarding the four incidences of mange in the HH herd, the condition may be associated to barn conditions (Sarre et al., Reference Sarre, De Bleecker, Deprez, Levecke, Charlier, Vercruysse and Claerebout2012) (it is sometimes referred to as ‘barn itch’) and the increased ability for Psoroptes ovis to spread in barn conditions, compared to pasture (Sweatman, Reference Sweatman1958).
The greater growth rate of the HH herd, compared to HG, was to be expected. The housed system was designed to be representative of real-world practice and thus was relatively intensive with the animals receiving rolled barley and distiller's grain. Both herds grew at relatively steady rates suggesting no significant limiting factors (e.g. disease) to growth outside of diet. This was reflected in BCS data as scores for both herds increased over time towards finishing.
During winter, QBA outcomes of both herds were similar, reflecting their comparable housing. The dispersal was relatively broad across PC1 and PC2, similar to results by Cooke et al. (Reference Cooke, Mullan, Morten, Hockenhull, Lee, Cardenas and Rivero2022) that assessed a previous years cohort of cattle in the same facilities. The reason for the slightly greater variation of QBA in the HH herd, and inclination towards ‘Agitated’, ‘Playful’ and ‘Inquisitive’ is unknown. It may be a consequence of the higher energy density of the diet and less energy spent in moving whilst eating, thus providing more time and energy for other activities. Summer QBA results showed a notable difference in the overall behaviour profiles of the two groups. The HG herd (grazing) were highly associated with descriptors such as ‘Content’, ‘Happy’, ‘Sociable’ and ‘Positively Occupied’. This may be a consequence of a high amount of time spent actively grazing as a cohesive herd unit. Anecdotally, HH animals appeared to value and utilize free space more and perform independent activities, compared to HG who had greater social cohesion. HH animals appeared to spend less time feeding which led to periods when they were awake and alert but were not ‘Positively Occupied’ leading to them being ‘Bored’, often gazing vacantly. This outcome is not dissimilar to results from Krohn et al. (Reference Krohn, Munksgaard and Jonasen1992), who found greater behavioural synchronization of dairy cattle on pasture than in housing. These results highlight the potential for boredom in indoor housing and consequently the potential benefits of environmental enrichment within cattle sheds (Mandel et al., Reference Mandel, Whay, Klement and Nicol2016). The HH herd showed a greater variation in behaviour, this is possibly because they had to spend less time roaming and feeding, thus there was more time for various other activities. It may also be a consequence of the reduced herd size as summer progressed, which could have reduced the effect of social synchronicity, increased the relative weighting of each individual's behaviour, and provided more space (lower stocking density) to express some behaviours. This difference in behaviour needs further investigation and testing cattle preference or developing a specific ethogram with this in mind could provide key insight. Free-choice experiments (as has been carried out in dairy cattle [Legrand et al., Reference Legrand, von Keyserlingk and Weary2009; Falk et al., Reference Falk, Weary, Winckler and von Keyserlingk2012]), giving cattle access to both high quality housing and pasture would perhaps be the most effective method to assess which system/environment best suits the psychological and emotional needs of beef cattle. When interpreting the PCA results from QBA, it is important to consider potential observer bias (Tuyttens et al., Reference Tuyttens, de Graaf, Heerkens, Jacobs, Nalon, Ott, Stadig, Van Laer and Ampe2014) and in this study a single assessor was used, though this is not uncommon (Temple et al., Reference Temple, Manteca, Dalmau and Velarde2013; Muri et al., Reference Muri, Stubsjøen, Vasdal, Moe and Granquist2019) and the assessor had previously shown high inter-observer reliability with other assessors (Cooke et al., Reference Cooke, Mullan, Morten, Hockenhull, Lee, Cardenas and Rivero2022) The extent of behavioural differences between herds were particularly strong and thus subtle subconscious bias to any meaningful extent seems improbable. On the whole, loadings for PC1 and PC2 were relatively weak (−0.442 to 0.423) with no particularly extreme values, possibly due to a level of multicollinearity of terms.
Within the HG herd, there was a rise of nasal mucus cortisol concentrations over winter, which appeared to drop off after turn-out and through summer. Whilst this could indicate a beneficial impact of turn-out and grazing, there was also a decrease for the HH herd over summer. Also, hair cortisol concentrations were lower in the HH herd compared to HG at both summer samplings. It may be that both herds are seeing different positives. For example, the HH herd had a lower stocking density compared to the stocking density and the time that their cortisol levels peaked, whilst the HG herd experienced natural grazing outdoors. Furthermore, during the summer period, compared to the HG herd, the HH herd had a relatively sedentary lifestyle with no need or opportunity to graze. They were also less exposed to weather events, notably cool nights, rain and heat/sun, reducing potential risks of climatic stress, though at no point in the study period did the temperature humidity index exceed 72, which was noted by Higashiyama et al. (Reference Higashiyama, Higashiyama, Ikeda, Komatsu and Fukasawa2013) as a threshold for an elevated cortisol response. Mean hair cortisol concentrations seen in the HG herd across both summer samplings (2.41 pg/mg) was towards the lower ends of those observed in cattle elsewhere [12.15 (González-de-la-Vara et al., Reference González-de-la-Vara, Valdez, Lemus-Ramirez, Vázquez-Chagoyán, Villa-Godoy and Romano2011), 5.7 (Burnett et al., Reference Burnett, Madureira, Silper, Nadalin, Tahmasbi, Veira and Cerri2014), 3.49 (Creutzinger et al., Reference Creutzinger, Stookey, Marfleet, Campbell, Janz, Marqués and Seddon2017), 2.5 (Comin et al., Reference Comin, Prandi, Peric, Corazzin, Dovier and Bovolenta2011), 2.35 (Moya et al., Reference Moya, Schwartzkopf-Genswein and Veira2013)]. Cortisol levels are particularly responsive to acute forms of stress and thus may not be sensitive to the more subtle and long-term welfare implications of housing/grazing in herds of well-cared for cattle. Furthermore, although often referred to as the ‘stress hormone’, cortisol is more complex than that. It coordinates a variety of metabolic process and interacts with other hormones, opening up the possibility of non-stress related factors (e.g. diet) impacting concentrations (Thau et al., Reference Thau, Gandhi and Sharma2023).
Whilst serotonin concentrations changed over time, at any one timepoint they were broadly similar between both herds. Importantly, serotonin concentrations were not lower in the HH herd compared to the HG during the summer, suggesting that exposure to sunlight was not a controlling factor – though the extent to which cattle serotonin synthesis is impacted by sunlight is mostly unknown. The cause for the temporal pattern in serotonin concentrations in both hair and nasal mucus was not clear. However, the moderate positive correlation of hair serotonin with negative health may be driving this. Serotonin plays important roles in the immune process, including acting as a pro-inflammatory mediator and in regulating cytokine production (Wu et al., Reference Wu, Denna, Storkersen and Gerriets2019) and thus might be elevated in response to infection, injury or other health concerns. However, this same trend was not seen for nasal serotonin.
With regards to nasal mucus, it is possible that the composition of the mucus changed over time, perhaps in response to factors such as age, growth, weather and sub-clinical respiratory infection, which could limit the interpretation of nasal mucus results due to variability that may add both temporally and between individuals. For example, in humans, respiratory infections have been shown to influence the consistency of nasal mucus (Yuta et al., Reference Yuta, Doyle, Gaumond, Ali, Tamarkin, Baraniuk, Van Deusen, Cohen and Skoner1998), which may influence the relative concentrations of its constituents. The statistically significant, albeit weak (τ = 0.160), correlation between nasal cortisol and nasal serotonin supports this. Ultimately, the use of non-invasive endocrinological methods in animal welfare requires further development and testing.
The animals included in this study were managed to ‘best practice’ standards and were also covered by the Animal (Scientific Procedures Act) 1986. Consequently, the quality of care and resources available for husbandry were high for both herds and the interpretation of results is limited by that context. In other circumstances, risk factors associated with housing or grazing may be present or exacerbated in ways not evident from this study and the likelihood of this may not be equal across both systems. For example, less frequent ‘mucking out’ could increase disease risk during housing (Peeler et al., Reference Peeler, Green, Fitzpatrick, Morgan and Green2000) or turning cattle out onto inappropriate ground could increase risk of lameness (Tibbetts et al., Reference Tibbetts, Devin, Griffin, Keen and Rupp2006). The decision to house or graze cattle may also be associated with other management decisions that influence animal welfare. Certainly, many farm accreditation schemes (e.g. Soil Association organic status) require minimum grazing periods as part of a wider array of commitments. This study aimed to control for such variables to deliver a controlled study, the next step is to expand research to a wider number of farms to take into account and assess these potentially confounding/conflicting variables.
Results provide limited evidence that summer grazing is beneficial to cattle welfare. This is predominantly evidenced through behavioural indicators of welfare, with some support from physical indicators. Due to the behavioural data, this study was able to draw conclusions beyond those elsewhere, such as those reported by Wagner et al. (Reference Wagner, Brinkmann, March, Hinterstoißer, Warnecke, Schüler and Paulsen2018) who found that grazing time had no overall impact on the welfare of dairy cattle (as measured by the Welfare Quality protocol). However, evidence was not clear across all indicators of welfare, largely due to low incidence of negative health indicators, due to generally good levels of husbandry in both systems. This reinforces the need for holistic approaches to assessing welfare and whilst these have been presented elsewhere (e.g. Welfare Quality protocol) few include molecular techniques, whether that be endocrinological, immunological or other. Though endocrinological data from this study provides only limited evidence of cortisol and serotonin being useful indicators for routine/regular assessment. It suggests that the quality of a system's management is also a significant driver of welfare than the exact system itself. Indeed, Park et al. (Reference Park, Foster and Daigle2020) identified a number of features (e.g. flooring type, stocking density) across different beef cattle housing systems and how they can positively and negatively impact animal welfare. Finally, significant temporal trends were present across all types of indicators, highlighting the potential risk of welfare losses during winter housing.
Conclusion
This study found evidence that summer grazing periods are beneficial to beef cattle welfare, compared to housing. This conclusion was predominantly borne out through behavioural assessments, highlighting not only the role grazing has in livestock production, but also how welfare must be approached holistically using multiple types of measures. Strong temporal differences in welfare, across numerous indicators, highlight the potential for negative welfare outcomes during winter housing and thus housing conditions are a key area for intervention to improve cattle welfare. The study also highlights the need to develop and standardize holistic approaches to animal welfare assessments that are inclusive of molecular techniques.
Supplementary material
The supplementary material for this article can be found at https://doi.org/10.1017/S0021859623000357.
Acknowledgements
The authors are grateful for the work of the Research Farm Team who manage Rothamsted Research's NWFP and who are responsible for animal husbandry.
Authors’ contributions
A. C. – Experimental design, sample collection, laboratory analysis, data analysis, project management, primary manuscript writer. S. M. – Funding acquisition, experimental design, project management, manuscript input. C. M. – Experimental design, sample collection, manuscript input. J. H. – Experimental design, project management, manuscript input. P. L.-G. – Animal husbandry, sample collection, manuscript input. K. L. C. – Laboratory analysis, manuscript input. M. L. – Funding acquisition, experimental design, project management, manuscript input. L. C. – Funding acquisition, experimental design, project management, manuscript input. J. R. – Funding acquisition, experimental design, project management, manuscript input.
Financial support
The work was part of the Rothamsted Research's Institute Strategic Programme Soil to Nutrition (BBS/E/C/000I0320) funded by the Biotechnology and Biological Sciences Research Council (BBSRC) using the BBSRC's National Bioscience Research Infrastructure the North Wyke Farm Platform (NWFP, BBS/E/C/000J0100).
Conflict of interest
The authors declare there are no conflicts of interest.
Ethical standards
Prior to commencement, the study was reviewed and approved by Rothamsted Research's Animal Welfare Ethical Review Body (AWERB) in accordance with the Animal Scientific Procedures Act (1986).


 Open access