


Introduction
The physically effective neutral detergent fibre (peNDF) concept was first introduced by Mertens (Reference Mertens1997) and combines both, the physical and the chemical characteristics of fibre, namely, dietary particle size (PS) and neutral detergent fibre. Besides affecting ruminal mat formation, dietary peNDF concentration reflects the ability of a feed to promote chewing and saliva secretion, which in turn affect ruminal fermentation and digesta passage (Mertens, Reference Mertens1997). Increasing dietary peNDF concentration of total mixed ration (TMR) for high-yielding dairy cows increased their chewing activity and ruminal pH (Krause et al., Reference Krause, Combs and Beauchemin2002), passage rate of liquid digesta, total tract nutrient digestibility (Kononoff and Heinrichs, Reference Kononoff and Heinrichs2003) and milk fat content (Yang et al., Reference Yang, Beauchemin and Rode2001; Kononoff et al., Reference Kononoff, Heinrichs and Lehman2003). Also, increasing dietary PS enhanced the efficiency of microbial protein synthesis (MPS) in the rumen of lactating dairy cows fed 80% alfalfa hay and 20% corn-based concentrate (Rode et al., Reference Rode, Weakley and Satter1985).
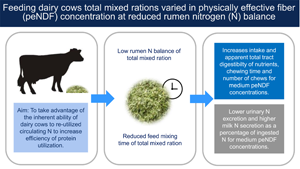
As dietary peNDF concentration may affect feed intake, nutrient digestibility and ruminal MPS, it may also affect the animals' nitrogen (N) excretion and N use efficiency. Heering et al. (Reference Heering, Selje-Assmann and Dickhoefer2020) found pronounced effects of marginal increases in dietary peNDF concentration on chewing activity, nutrient digestibility, ruminal MPS and N partitioning in cows fed high peNDF diets with reduced rumen-degradable crude protein (CP) supply, but not with adequate rumen-degradable CP supply. The study of Heering et al. (Reference Heering, Selje-Assmann and Dickhoefer2020) did not evaluate variables such as ruminal fermentation and digesta passage rates to explain the observed effects. Moreover, only two peNDF concentrations were tested. However, the effects of increasing peNDF concentration on nutrient intake, chewing behaviour, and milk performance differ depending on its level in the diet (Heering et al., Reference Heering, Selje-Assmann and Dickhoefer2020) and may be linear or quadratic. As increased chewing activity enhances saliva secretion (Mertens, Reference Mertens1997), and therefore possibly also endogenous N supply to the rumen, there may also be linear or quadratic effects of increasing peNDF concentration on ruminal MPS, N balance and milk N use efficiency.
Hence, the aim of the present study was to determine the effects of gradually and marginally increasing dietary peNDF concentration – varied solely in dietary PS – on chewing behaviour, ruminal fermentation, fractional passage rate, ruminal MPS and partitioning of N excretion in dairy cows at reduced rumen-degradable CP supply. Moderate to high peNDF concentrations were selected to ensure normal rumen health functioning and health of the animals. A quadratic effect of increasing dietary peNDF concentration on feed nutrient intake and digestibility, digesta passage rates, total chewing activity (i.e. eating and rumination), ruminal MPS and milk yield as well as on N use and excretion was expected.
Materials and methods
Animals and housing
A study was conducted at ‘Les Cedres’ experimental farm belonging to ‘Herbipôle’ experimental unit (https://doi.org/10.15454/1.5572318050509348E12) of the French National Institute for Agriculture, Food, and Environment (INRAE) in Saint-Genes Champanelle, France. The study comprised four periods of 21 d (13 d adaptation to the experimental diets and 8 d of data and sample collection) and lasted from January to July 2020. Since the study had to be interrupted after the third period at the end of March due to COVID-19 restrictions, the fourth period was conducted only from June to July 2020. The Auvergne Rhône-Alpes Ethics Committee for Studies on Animals approved all experimental procedures (DGRI's agreement APAFIS15401-2017062616304407, France), which were compliant with the guidelines established by the European Union Directive 2010/63/EU.
Initially, four multiparous, rumen-cannulated and lactating Holstein cows were selected. Nevertheless, in the second period, one cow had mastitis and was replaced by a primiparous rumen-cannulated, lactating Holstein cow. All data from the sick animal were omitted from the final dataset, and no data were available for the replacement cow for the first period. At the beginning of the study, animals had (arithmetic mean ± one standard deviation) a milk yield of 31.9 ± 2.69 kg/d, body weight (BW) of 678 ± 51.8 kg and 75 ± 8.4 d in milk. Cows were housed in individual tie stalls bedded with sawdust and were milked twice daily at 07:30 and 15:00 h in an auto-tandem milking parlour (C100E Basic SA, Delaval) with daily milk yield being recorded by in-parlour milk meters (MM27BC, Delaval) from days 15 to 21 of each experimental period. The BW was recorded daily after each milking using an automated walk-over-weighing system (AWS100, Delaval). Cows had ad libitum access to fresh drinking water.
Study design and diets
The study followed a 4 × 4 latin square design. Cows were offered a TMR with a forage to concentrate ratio of 57:43 (on dry matter [DM] basis). The TMR was formulated according to the German Feeding Recommendation System (GfE, 2001) to supply sufficient net energy of lactation (NEL) and postruminal CP for a 720 kg-cow to produce 30 kg/d of milk containing 40 g fat and 35 g protein per kg milk at a DM intake of 25 kg/d. The postruminal CP is defined as the sum of undegraded dietary CP and microbial CP, and is further used to estimate the rumen nitrogen balance (RNB) by dividing the difference between dietary CP intake and the postruminal CP supply by 6.25 (GfE, 2001). The RNB was a variable used in the present study to indicate the excess of ruminal N supply not used by the microbes. The TMR was formulated to have a predicted negative RNB (–2.1 g/kg DM) so that more pronounced effects of peNDF could be investigated (Heering et al., Reference Heering, Selje-Assmann and Dickhoefer2020). From the one TMR, four different experimental diets were created that had the same ingredient composition and similar nutrient and energy concentrations (Table 1) but varied in their PS and thus peNDF concentration. The dietary PS and thus peNDF concentration were adjusted by increasing the mixing time of the TMR in the feed mixer wagon (Unifeed Dessilmix 80, Jeulin SA): 60, 45, 30 and 15 min corresponding to low (L), medium-low (ML), medium-high (MH) and high (H) peNDF concentrations, respectively. The grass haylage and hay were prepared from the first cuts (May and June, respectively; i.e. heading stage) of a meadow containing a mixture of grass and few herb species, most importantly Dactylis glomerata L., Arrhenatherum elatius L. and Holcus mollis L. The diets were prepared in the mornings of days 1, 3, 5, 8, 10, 12, 15, 17 and 19 of every period. Every period, each cow was fed one of the four experimental diets. From days 1 to 13, diets were offered twice daily in two equal meals for ad libitum consumption at 09:00 and 16:00 h with amounts offered being adjusted daily to allow for refusals of 10% of the offered diet (on DM basis). The amount of mineral mixture (Table 1) added to the TMR was adjusted prior to TMR mixing to achieve a daily intake from the mineral mixture of 250 g (as-fed)/cow. Cows were subjected to restrictive feeding from days 14 to 21 by reducing the amounts of the offered diets to 95% of the average ad libitum DM intake (10% refusals) of each animal recorded during the adaptation phase to ensure a stable nutrient and energy intake of cows during the sampling and data collection phase.
Table 1. Ingredient composition of the total mixed ration fed to lactating dairy cows

a Corn silage was harvested in Sep and ensiled on the same day. The forage harvester was set to produce 18 mm particles.
b Grass haylage and hay were prepared from the first cuts (May and June, respectively; i.e. heading stage) of a meadow containing a mixture of grass and few herb species, most importantly Dactylis glomerata L., Arrhenatherum elatius L. and Holcus mollis L. Both forages were harvested from the full height of the meadow and not chopped.
c Barley straw was the residue remaining after the grain harvest in July. The straw was baled in the field without prior chopping.
d Concentrate composition (per kg dry matter) according to manufacturer information: 300 g sugar beet pulp, 227 g corn grain, 200 g barley grain, 150 g rapeseed, 79 g soybean grain, 15 g sugarcane molasses, 10 g Ca3(PO4)2, 9 g trace elements, 5 g Mg and 5 g NaCl (Centraliment).
e Mineral composition (per kg dry matter) according to manufacturer information: 35 g P, 200 g Ca, 45 g Mg and 10 g Na in the form of Mg3(PO4)2, CaHPO4, MgO and NaCl, 400 000 UI Vitamin A, 120 000 UI Vitamin D3, 1600 UI Vitamin E, 6000 mg ZnO, 3500 mg MnO, 1300 mg CuSO4, 90 mg Ca(IO3)2, 36 mg CoCO3 and 20 mg Na2SeO3.
Feed intake, milk performance and faeces and urine excretion
Offered and refused diet
Samples of offered diets were taken on days 15, 17 and 19 of each period directly after TMR mixing for analyses of chemical composition and PS distribution. For chemical composition analyses, approximately 400 g (as-fed) of each diet was collected, weighed (Spider SW, Mettler), frozen at – 20°C and then lyophilized (Pilote LPCCPLS15, Cryotec) for 96 h. Additionally, a separate sample of 1.2 kg (as-fed) was collected for each diet for immediate determination of PS distribution (see below). Refusals of each animal were collected daily from the troughs and weighed in the morning before feeding and samples (400 g; as-fed) for analysis of chemical composition were taken only when the amount of refused diet of an individual cow was ≥1 kg (as-fed). Samples of refusals were also weighed, frozen at – 20°C and lyophilized for 96 h. Lyophilized samples of offered and refused diets were weighed, ground to pass a 2-mm sieve (SM 1, Retsch GmbH) and pooled per diet and period by taking equal amounts from each day.
Milk
Milk samples were taken once daily from each cow from day 15 until day 1 of the subsequent period (before the new diet was offered), alternating between afternoon and morning milking. Samples (30 ml) were collected directly in bottles, preserved with bronopol (2-bromo-2-nitropropane-1,3-diol; final concentration 0.03%, w/v; UNITED CAPS) and stored at 4°C for later analyses of milk fat, protein, lactose and milk urea-nitrogen (MUN).
Urine
Urine spot samples (≥300 ml) were collected by perineal massage once daily from each cow from days 14 to 19, alternating between afternoon and morning feeding, resulting in a total of six samples per cow and period. Timing of urine sampling varied slightly between days (between 06:00 to 08:00 h and 14:00 to 18:00 h), because it was synchronized as much as possible with faecal sampling to minimize disruption to the cows' routine. Immediately after collection, urine samples were homogenized and filtered through a gauze with a pore size of 0.5 mm to remove impurities. A subsample of 250 ml was then acidified using an aqueous solution of H₂SO₄ (20%; vol/vol; Roth GmbH) to reduce urine pH to below 3. Four aliquots of the acidified urine (40 ml each) were transferred into 50-ml falcon tubes of which two were used for the analysis of N and the other two for the analysis of purine derivatives (PD). All urine samples were stored at – 20°C until the end of each period. For N analysis, two out of the four aliquots collected per cow and collection time were thawed and pooled by period by taking the same amount from each aliquot. The other two aliquots, collected during both collection times (AM and PM) over two consecutive days (total of four aliquots), were thawed and pooled by taking the same amount from each aliquot, resulting in a total of three pooled samples per cow and period. Aliquots for both, N and PD analyses were processed according to Kand and Dickhoefer (Reference Kand and Dickhoefer2021) and frozen at – 20°C until analysis.
Faeces
Daily faecal excretion of cows and consequently, the apparent total tract nutrient digestibility were determined using the external faecal marker titanium dioxide (TiO2, 60 797, Kronos® 1171, Kronos Worldwide Inc. Dallas). For this, 17.5 g (± 0.02) of TiO2 were weighed into gelatin capsules (Size XL, 10 ml volume, Kapselwelt), which were inserted directly into the rumen through the fistula twice daily during morning and afternoon feeding (i.e. a daily dosage of 35 g/cow) from days 10 to 18 (Glindemann et al., Reference Glindemann, Tas, Wang, Alvers and Susenbeth2009). The total adaptation period for TiO2 was 4.5 days. Faecal spot samples (400 g fresh matter) were collected once daily on days 14 (afternoon) and 19 (morning) and twice daily (morning and afternoon) from days 15 to 18. Samples were taken either from boxes placed directly behind the animals to avoid discomfort to the animals or via manual grab from the rectum if cows did not voluntarily excrete any faeces until 1 h after feeding. Whenever possible, sampling was conducted simultaneously with faecal sampling for passage rate determination (see the section below) to minimize the discomfort of the animals. Immediately after collection, samples were frozen at – 20°C. At the end of each sampling period, samples were thawed again and pooled by cow and period by taking the same amount from each sample. Pooled samples were then homogenized and a subsample (180 g fresh matter) taken, its weight recorded and then frozen at – 20°C. After lyophilization (Pilote LPCCPLS15, Cryotec), the subsample was weighed back and ground through a 1-mm screen (SM 1, Retsch GmbH).
The passage rates of solid and liquid digesta through the gastrointestinal tract were determined using ytterbium (Yb)-marked fibre particles and Cobalt-EDTA (Co-EDTA; EDTA = ethylenediaminetetra-acetic acid), respectively. The Yb-marked fibre was prepared according to Teeter et al. (Reference Teeter, Owens and Mader1984) and Villalobos et al. (Reference Villalobos, Klopfenstein, Adams, Shain and Thomas1997) and the Co-EDTA marker was prepared according to Udén et al. (Reference Udén, Colucci and van Soest1980). The Yb concentration of the obtained marked fibre was 66.87 mg/g DM (see chemical analysis). The Co-EDTA was stored in an airtight jar and immediately before dosing, the Co-EDTA precipitate was solubilized in 250 mL of tap water. Single doses of Yb-marked fibre (5.6 mg of Yb kg−1 BW; Richter and Schlecht (Reference Richter and Schlecht2006)) and Co-EDTA (23.56 mg kg−1 BW; Ali et al. (Reference Ali, Wassie, Korir, Merbold, Goopy, Butterbach-Bahl, Dickhoefer and Schlecht2019)) solution were directly administered to the rumen via the fistula on day 15 of each experimental period during morning feeding (09:00 h). No attempt was made to manually mix the markers with the ruminal contents. The time of marker application (t 0) was recorded individually for each cow as the time when the Co-EDTA solution was inserted into the rumen.
For Yb and Co analysis, faecal samples were taken at 0, 4, 6, 8, 10, 12, 14, 16, 22, 24, 28, 32, 36, 40, 46, 52, 58, 64, 70, 76, 82, 88, 96, 104, 112, 120, 128, 136 and 148 h after marker application (t 0; Ali et al. (Reference Ali, Wassie, Korir, Merbold, Goopy, Butterbach-Bahl, Dickhoefer and Schlecht2019)). Sampling was conducted as explained for faecal sampling for TiO2 analysis. Collected samples (400 g fresh matter) were directly homogenized and a subsample of 60 g fresh matter was weighed into a plastic box and dried at 60°C for 2 d. Then, dried subsamples were weighed and ground to pass a 1-mm sieve (SM 1, Retsch GmbH).
Chewing behaviour
The chewing behaviour (i.e. eating and rumination) of animals was recorded from days 15 to 21 using automatic jaw movement recorders at 10-Hz-frequency (RumiWatch System, Itin & Hoch GmbH; Zehner et al., Reference Zehner, Umstätter, Niederhauser and Schick2017). The jaw movement sensors were validated in own preliminary experiments by comparing the records of the sensors with visual observations (Selje-Aßmann et al., Reference Selje-Aßmann, Lawrence, Frey, Meitinger, Stökle and Dickhoefer2015). The 24-h-resolution option of the RumiWatch conversion software V0.7.3.2 was used to convert recorded data to daily eating and rumination time and daily number of eating and rumination chews with their sum being defined as daily total chewing time and daily number of total chews respectively. Eating, rumination and total chewing time as well as number of eating, rumination and total chews were also expressed per kg of DM and aNDF (neutral detergent fibre determined using heat-stable amylase and expressed inclusive of residual ash) intakes.
The RumiWatch conversion software V0.7.3.36 was used to convert recorded data to daily number of eating meals and rumination events. The converter considered a meal as occurring when eating lasted for a minimum of 7 min with an intra-meal interval of less than 7 min; a rumination event was considered as occurring when rumination lasted for a minimum of 3 min with an intra-event interval of less than 1 min. The eating time spent per meal was calculated by dividing the eating time by the number of meals per day. The rumination time spent per event was calculated by dividing the rumination time by the number of events per day. All data were averaged per cow and period prior to statistical analysis.
Ruminal pH and fermentation
Rumen fluid (about 300 ml) was collected from the ventral sack of the rumen using a probe (manufactured by INRAE) at 0.0, 1.5, 3.5, 5.5, 6.5, 8.5, 11.5, 14.5, 21.5 and 24.5 h starting after morning feeding at 9:00 h on day 19 of each period. Ruminal pH of the collected rumen fluid was measured directly using a portable pH meter (Multi 340i, WTW GmbH) and a pH electrode (InLabR Easy, Mettler-Toledo), which was calibrated daily using pH 4.0 and 7.0 standards. Thereafter, samples were filtered through a nylon mesh (100 μm pore size) and two subsamples of the filtrate (10 ml each) transferred into 15-ml centrifugation tubes filled with 2 ml each of HPO3 (25%; w/v; Roth GmbH). All samples were stored at – 20°C until analysis of volatile fatty acids (VFA) and ammonium–nitrogen (NH4–N) (see below). The maximum and minimum recorded ruminal pH of each animal and period were noted.
Sample analyses
Proximate analysis of offered diets, refused diets, urine and faeces were performed in duplicate according to the official analytical methods in Germany (VDLUFA, 2007). The DM and crude ash (methods 3.1 and 8.1, respectively) were analysed in offered diets, refused diets and faecal samples to further estimate the organic matter (OM) concentration (g/kg DM). The crude lipid concentrations in offered and refused diets were determined according to method 5.1.1. Analyses of N concentrations in samples of the offered and refused diets, faeces and urine were performed using Kjeldahl digestion (KT20 KJELDAHLTHERM®, C. Gerhardt GmbH & Co. KG), distillation (B324, Büchi Labortechnik GmbH) and titration (719 S Titrino, Metrohm AG) to further calculate the CP concentrations as the product of N concentration and 6.25 (method 4.1.1). The aNDF and ADF concentrations in offered and refused diets were determined sequentially inclusive of residual ash using an Ankom200 Fibre Analyzer (ANKOM Technology) (methods 6.5.1 and 6.5.2). Additionally, faecal samples were analysed for aNDF (method 6.5.1). All aNDF analyses were conducted with heat-stable α-amylase (ANKOM Technology) and sodium sulfite (Merck KGaA), inclusive residual ash. Starch in samples of offered diets was analysed in duplicate using an enzymatic kit (Test-Combination Nr. 10 207 748 035, R-Biopharm AG).
For samples of the offered and refused diets, gas production during 24 h of in vitro incubations was determined in triplicate on two days and used to estimate concentrations of metabolizable energy (ME) and NEL (equation 14f) and digestible OM (equation 43f) according to Menke and Steingass (Reference Menke and Steingass1988). For postruminal CP determination, pooled samples of offered diets were additionally pooled across treatments per period by taking the same amount of each treatment, generating one pooled diet sample per period. The postruminal CP concentrations in pooled diet samples were estimated from changes in the NH4–N concentrations in rumen inoculum during 24 h of in vitro incubation, which was performed in triplicate on two different days (Steingass and Sudekum, Reference Steingass and Sudekum2013).
The PD (allantoin and uric acid) concentrations of urine spot samples were determined in duplicate according to the procedures described by Balcells et al. (Reference Balcells, Guada, Peiró and Parker1992) with minor modifications. The samples were diluted using a 20 mM ammonium dihydrogen phosphate solution in a 1:4 ratio. Subsequently, the diluted samples were centrifuged at 22 000 × g at 4°C for 10 min (Avanti 30, Beckman Coulter). 20 μl of the resulting supernatant was transferred into 1.5-ml glass vials. These vials were then loaded into a HPLC system (Varian 920-LC).
Faecal samples were analysed in duplicate for TiO2 using a spectrophotometer (Varian Cary 50 Bio UV-Visible Spectrophotometer, Varian Australia Pty Ltd) following the procedure of Boguhn et al. (Reference Boguhn, Baumgärtel, Dieckmann and Rodehutscord2009) with the slight modification that the Kjeldahl digestion was carried out for 4 h instead of only 40 min. The Yb and Co in faecal samples were extracted by sealed chamber digestion following Anderson and Henderson (Reference Anderson and Henderson1986). After a 1:10 dilution with distilled water, Yb and Co were analysed with single determinations using atomic absorption spectrophotometry (Spectra AA, 220 FS, Varian Australia Pty Ltd).
The concentration of NH4-N in rumen fluid was determined following the method described by Weatherburn (Reference Weatherburn1967) using a spectrophotometer (Varian Cary 50 Bio UV-Visible Spectrophotometer, Varian Australia Pty Ltd). Rumen fluid was also analysed for VFA using a GC (GC14-A Shimadzu Corp) equipped with an auto-injector (AOC–20i, Shimadzu Corp.). The stainless steel column used for separation was 3 m long with an internal diameter of 3 mm and was packed with 10% SP™–1000, 1% phosphoric acid, 100/120 Chromosorb® WAW (Supelco 221 Inc.), with N 2 as the carrier gas.
Milk fat, protein, lactose and milk urea concentrations were determined in duplicate by Agrolabs in Aurillac, France, using a Fourier transform infrared spectrometer (MilkoScan™ FT + , Foss).
All chemical analyses were repeated when the coefficient of variation between duplicate or triplicate analyses exceeded 5%.
The PS distribution of fresh samples of offered diets was determined using the Penn State Particle Separator (Nasco education) with three sieves (19.0, 8.0 and 4.0 mm) and a bottom pan (Jones and Heinrichs, Reference Jones and Heinrichs2016). Collected samples were divided into four equal parts and individually sieved, resulting in four repetitions per sample. After sample sieving, the material on each sieve and the bottom pan was weighed and the weight of material retained on each sieve was recorded and averaged across the four replicates.
Calculations
The physical effectiveness factor (pef) of the experimental diets is the ratio between the sum of the amount of material retained on two (pef>8.0; 19.0 and 8.0 mm) or three sieves (pef>4.0; 19.0, 8.0 and 4.0 mm) and the total weight of sieved material (all in g). The peNDF>8.0 and peNDF>4.0 concentrations of the experimental diets were calculated by multiplying the dietary aNDF concentration by the pef>8.0 and pef>4.0, respectively (Jones and Heinrichs, Reference Jones and Heinrichs2016). The geometric mean (X gm) of the PS was estimated according to Jones and Heinrichs (Reference Jones and Heinrichs2016). The pef>8.0, pef>4.0, peNDF>8.0, peNDF>4.0 and X gm were then averaged per diet and period.
Daily DM intake of individual animals was calculated by multiplying the offered feed fed (kg/d; as-fed) by the DM concentration (g/kg; as-fed) in the respective diet minus the refused amount of DM calculated in the same way. The offered and refused amounts of OM, CP, N, NDF and ME were calculated by multiplying individual DM offered and refused amounts (kg/d) with the concentrations (g or MJ/kg DM) of the respective nutrients or ME in the diets. Finally, the nutrient and ME intakes were calculated as the difference between offered and refused amounts of the respective nutrients or ME in the diet. Starch intakes were calculated by multiplying the starch concentration in the diet (g/kg DM) with the DM intake (kg/d) of individual cows.
Daily faecal DM excretion was estimated from the daily TiO2 dosage and the concentration of TiO2 in faecal DM assuming a recovery rate of the marker in faeces of 100% according to Glindemann et al. (Reference Glindemann, Tas, Wang, Alvers and Susenbeth2009). The digestible OM intake was calculated as the difference between total OM intake across each sampling period and faecal OM excretion estimated from the pooled sample of each sampling period. The apparent total tract digestibility of DM (aDMd), OM (aOMd), CP (aCPd) and aNDF (aNDFd) of the ingested diets were estimated for each cow from its average nutrient intake across each sampling period and its faecal nutrient excretion estimated from the pooled sample of each sampling period. The digestible OM intake was derived from the daily OM intake of cows multiplied by the measured aOMd.
Milk protein, fat and lactose yields were calculated by multiplying milk yield (kg/d) by the respective component concentration (g/kg milk) in milk. The energy-corrected milk (ECM) yields were calculated according to Spiekers et al. (Reference Spiekers, Nussbaum and Potthast2009) as milk yield (kg) × ([0.38 × milk fat [g/100 g] + 0.21 × milk protein [g/100 g] + 1.05]/3.28). The feed efficiency was calculated as ECM yield (kg/d) divided by DM intake (kg/d) of animals. The MUN (mg/dl) was calculated as milk urea (mg/dl) multiplied by 0.47.
The urinary N loss of each animal was defined as the difference between its daily N intake and the sum of its N losses via faeces, skin and hair and its milk N secretion (all in g/d). Milk N secretion was calculated by dividing the milk protein yield by 6.38 (McDonald et al., Reference McDonald, Edwards, Greenhalgh, Morgan, Sinclair and Wilkinson2011). Skin and hair N losses (g/d) were estimated by multiplying the metabolic BW of the animals (kg0.75) by 0.018 (g N/kg0.75 BW) (GfE, 2001). No significant BW change was observed for any of the animals throughout the study and thus N mobilization or retention in BW was not considered in estimating the urinary N excretion. Finally, urine volume (l/d) of individual cows was calculated by dividing the estimated urinary N excretion (g/d) by the urine N concentration (g/l).
Urinary PD excretion (mmol/d) of individual animals was calculated as the product of their urine volume (l/d) and the urinary PD concentration (mmol/l). The duodenal absorption of microbial PD (mmol/d) was then estimated according to Verbic et al. (Reference Verbic, Chen, MacLeod and Ørskov1990) and used to calculate MPS (g N/d) according to equation 5 of Chen and Gomes (Reference Chen and Gomes1992). The efficiency of MPS was expressed in g of microbial N per kg of DM, digestible OM and CP intakes.
The NLIN procedure (PROC NLIN method = dud) in SAS (V9.4, SAS Institute Inc., Cary) was used to compute the first-time appearance of the marker in faeces (TT; equivalent to post-ruminal laminar flow), the ruminal passage rate, the retention time in the mixing compartment (CMRT:2 × passage rate−1) and the retention time in the total gastrointestinal tract (TMRT: CMRT + TT) for solid and liquid digesta. The one-compartment Gamma-2 model of Richter and Schlecht (Reference Richter and Schlecht2006) was used for the Yb-marker (i.e. solid digesta), whereas the double-compartment, age-dependent G1G1 model of Moore et al. (Reference Moore, Pond, Poore and Goodwin1992) was used for the Co-EDTA (i.e. liquid digesta). Estimates of passage rate and outflow rate of the marker from the rumen were taken from the respective publications. The initial estimates for the iterative encompassed the peak values, which were observed and also the first marker appearance in faeces. Data on passage rate and MPS variables were averaged per animal and period.
Statistical analyses
All data were analysed using the MIXED procedure of SAS (V9.4, SAS Institute Inc., Cary). Since one cow had mastitis in the first period, the cow was replaced starting from the second period. As a result, diet MH had only three observations. For ruminal fermentation variables, the model accounted for the effects of peNDF concentration (i.e. L, ML, MH and H), sampling time, period and the interaction between sampling time and peNDF concentration as fixed effects and cow within period included as repeated measurements. Cow was included as a random effect in the model. The covariance structure selection between heterogenous first-order autoregressive, compound symmetry and spatial power was based on the Akaike's information criterion. For the remaining variables, the model accounted for the effects of peNDF concentration and period as fixed effects and cow as random effect. The interaction between peNDF concentration and period was originally included in both models as well as the interaction between sampling time and period in the first model but were removed due to insignificancy (P ≥ 0.10). All variables were tested for linear and quadratic orthogonal contrasts using the CONTRAST statement. All means are presented as least-squares means. Effects were declared significant at P < 0.05 and trends were recognized at 0.05 ≤ P < 0.10.
Results
Chemical and physical properties of diets
As intended, diets were isoenergetic and isonitrogenous (Table 2), with a predicted RNB of –2.1 g/kg DM. Increasing the peNDF concentration from L to H by reducing the mixing time, increased linearly the percentage of material retained on the 19.0-mm sieve (P < 0.001; Table 3) while decreasing linearly the percentage of material in the bottom pan (P < 0.001). No differences in the percentage of material on the 8.0-mm and 4.0-mm sieves were found (P ≥ 0.259). Accordingly, reducing the mixing time increased linearly pef>8.0, pef>4.0 and X gm as well as the concentrations of peNDF>8.0 and peNDF>4.0 from diet L to H (P ≤ 0.008 for all variables).
Table 2. Chemical composition of offered experimental diets differing in physically effective neutral detergent fibre (peNDF) concentration fed to lactating dairy cows (n = 4)
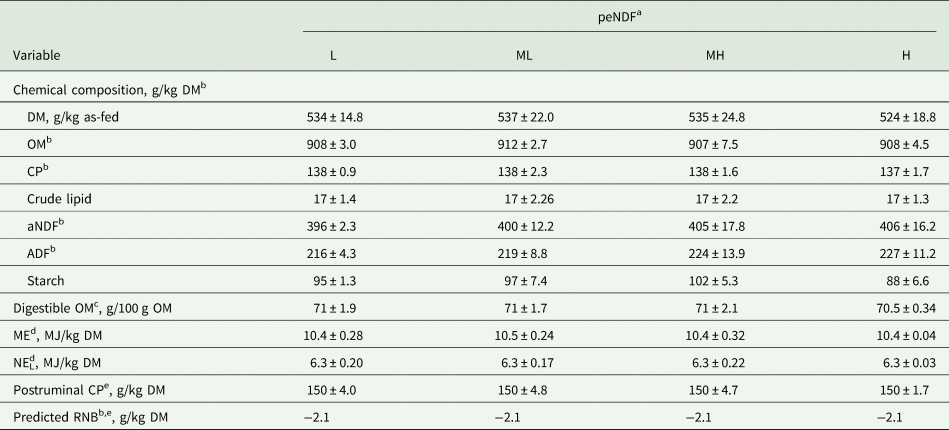
a peNDF concentration: low (L), medium-low (ML), medium-high (MH) and high (H).
b ADF, acid detergent fibre expressed inclusive of residual ash; CP, crude protein; DM, dry matter; ME, metabolizable energy; NEL, net energy of lactation; aNDF, neutral detergent fibre determined using heat-stable amylase and expressed inclusive of residual ash; OM, organic matter; RNB, ruminal nitrogen balance.
c Estimated by the in vitro Hohenheim gas test method (Menke and Steingass, Reference Menke and Steingass1988; equation 43f).
d Estimated by the in vitro Hohenheim gas test method (Menke and Steingass, Reference Menke and Steingass1988; equation 14f).
e Estimated by the modified in vitro Hohenheim gas test method (Steingass and Sudekum, Reference Steingass and Sudekum2013) to further calculate predicted RNB as RNB (g/kg DM) = (CP [g/kg DM] – postruminal CP [g/kg DM])/6.25 (GfE, 2001) with n = 1.
Table 3. Physical characteristics of offered experimental diets differing in physically effective neutral detergent fibre (peNDF) concentration fed to lactating dairy cows (n = 4)

a peNDF concentration: low (L), medium-low (ML), medium-high (MH) and high (H).
b DM, dry matter; s.e.m., standard error of means.
c pef>8.0 and pef>4.0 = physical effectiveness factor determined as the percentage of DM retained on 19.0- and 8.0-mm sieves, and 19.0-, 8.0- and 4.0-mm sieves, respectively.
d peNDF>8.0 and peNDF>4.0 = peNDF determined as the dietary neutral detergent fibre (using heat-stable amylase and expressed inclusive of residual ash) concentration multiplied by pef>8.0 and pef>4.0, respectively (Jones and Heinrichs, Reference Jones and Heinrichs2016).
e X gm = geometric mean of particle size determined according to Jones and Heinrichs (Reference Jones and Heinrichs2016).
Body weight, feed intake and nutrient digestibility
The BW was similar across dietary peNDF concentration (P ≥ 0.388; Table 4). Intakes of DM, CP and starch responded quadratically (P ≤ 0.043), while intakes of OM, aNDF and ME tended to be quadratically affected (P ≥ 0.052) with increasing dietary peNDF concentrations with greater intakes for both, ML and MH, than for the H and L diets. Intake of digestible OM was similar across the four diets (P ≥ 0.137).
Table 4. Nutrient and energy intakes and apparent total tract nutrient digestibility (ATTD) in lactating Holstein cows restrictively fed diets differing in physically effective neutral detergent fibre (peNDF) concentration

a Concentrations (per kg DM) of peNDF with particle size >8 mm: low (L; 202 g), medium-low (ML; 205 g), medium-high (MH; 218 g) and high (H; 234 g) (see Table 3).
b No data available in period 1.
c DM, dry matter; ME, metabolizable energy; aNDF, neutral detergent fibre determined using heat-stable amylase and expressed inclusive of residual ash; OM, organic matter; s.e.m., standard error of means.
d Digestible OM intake estimated as the difference between total OM intake and faecal OM excretion.
e Dietary ME concentration (MJ/kg DM) estimated by the in vitro Hohenheim gas test method (Menke and Steingass, Reference Menke and Steingass1988; equation 14f) multiplied by DM intake (kg/d).
Increasing dietary peNDF concentration tended to quadratically affect aOMd (P = 0.074) with the greatest aOMd observed for ML and MH diets. However, no linear (P ≥ 0.237) or quadratic (P ≥ 0.139) responses to increasing peNDF concentration were observed for aDMd, aCPd and aNDFd.
Milk production and composition
A quadratic response of ECM and milk fat yield with increasing peNDF concentration was observed with lower values for MH and ML diets (P ≤ 0.020; Table 5). There were no linear or quadratic relationships between dietary peNDF concentration and any of the other variables related to milk yield and composition (P ≥ 0.100). Feed efficiency (kg ECM yield/kg DM intake) responded quadratically to increasing peNDF concentration (P = 0.004), with greater values observed for H and L diets, for which also the lowest DM intakes were observed.
Table 5. Milk yield and composition of lactating dairy cows restrictively fed diets differing in physically effective neutral detergent fibre (peNDF) concentration

a Concentrations (per kg dry matter) of peNDF with particle size >8 mm: low (L; 202 g), medium-low (ML; 205 g), medium-high (MH; 218 g) and high (H; 234 g) (see Table 3).
b No data available for period 1.
c ECM, energy-corrected milk; MUN, milk urea-nitrogen; s.e.m., standard error of means.
d ECM yield calculated as milk yield (kg) × ([0.38 × milk fat [g/100 g] + 0.21 × milk protein [g/100 g] + 1.05]/3.28) according to Spiekers et al. (Reference Spiekers, Nussbaum and Potthast2009).
e Calculated as ECM yield (kg/d) divided by dry matter intake (kg/d).
Chewing behaviour
All eating parameters were not affected linearly (P ≥ 0.313; Table 6) or quadratically (P ≥ 0.132) by increasing peNDF concentration. Daily rumination time, daily number of rumination chews and daily number of rumination events were not affected by dietary peNDF concentration (P ≥ 0.116), but rumination time and number of rumination chews per kilogram of DM or aNDF intake increased linearly with higher peNDF concentration (P ≤ 0.045). Total chewing time (daily and per kilogram of aNDF intake) as well as total number of chews per kilogram of DM and aNDF intake were not affected by increasing peNDF concentration (P ≥ 0.118). A tendency for a quadratic response of total chewing time per kilogram of DM intake to increasing peNDF concentration was observed (P = 0.091), with higher values observed for both medium peNDF concentrations. Consequently, the total number of chews exhibited a quadratic response to increasing peNDF concentration, with higher values observed for ML and MH diets.
Table 6. Chewing behaviour of lactating dairy cows restrictively fed diets differing in physically effective neutral detergent fibre (peNDF) concentration

a Concentrations (per kg DM) of peNDF with particle size > 8 mm: low (L; 202 g), medium-low (ML; 205 g), medium-high (MH; 218 g) and high (H; 234 g) (see Table 3).
b No data available in period 1.
c DM, dry matter; aNDF, neutral detergent fibre determined using heat-stable amylase and expressed inclusive of residual ash; s.e.m. = standard error of means.
Rate of passage, ruminal pH and fermentation
There were no differences in rumen or total digestive tract liquid and solid digesta passage rates and retention times among the four diets (P ≥ 0.146; Table 7). Average ruminal pH responded quadratically to increasing peNDF concentration (P = 0.007; Table 8), resulting in higher ruminal pH for cows fed L and H diets. Total VFA concentration, VFA profile, acetate-to-propionate ratio and ruminal NH4–N concentration were similar across peNDF concentrations (P ≥ 0.201).
Table 7. Liquid and solid digesta passage in lactating dairy cows restrictively fed diets differing in physically effective neutral detergent fibre (peNDF) concentration
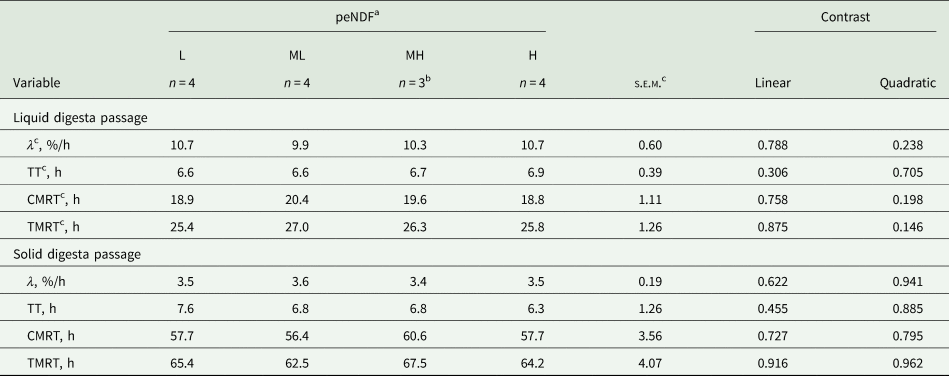
a Concentrations (per kg DM) of peNDF with particle size >8 mm: low (L; 202 g), medium-low (ML; 208 g), medium-high (MH; 221 g) and high (H; 238 g) (see Table 3).
b No data available for period 1.
c CMRT, retention time in the rumen; λ, ruminal passage rate; s.e.m., standard error of means; TMRT, retention time in total gastrointestinal tract; TT, post-ruminal transit time.
Table 8. Ruminal pH and fermentation variables of lactating dairy cows restrictively fed diets differing in physically effective neutral detergent fibre (peNDF) concentration

a Concentrations (per kg DM) of peNDF with particle size >8 mm: low (L; 202 g), medium-low (ML; 205 g), medium-high (MH; 218 g) and high (H; 234 g) (see Table 3).
b NH4–N, ammonium–nitrogen; s.e.m., standard error of means; VFA, volatile fatty acids.
c Mean ruminal pH: n = 29 for MH, n = 39 for ML and L and n = 40 for H.
d Minimum and maximum ruminal pH: n = 3 for MH and n = 4 for H, ML and L.
e VFA and NH4–N concentrations: n = 18 for MH and n = 24 for H, ML and L.
Nitrogen metabolism and turnover
The amount (g N/d) and efficiency of ruminal MPS per kilogram DM and CP intakes decreased linearly with increasing peNDF concentration, resulting in a lower amount and efficiency of MPS observed for the H diet (P ≤ 0.049; Table 9). A similar pattern was observed for ruminal MPS per kilogram digestible OM intake, where the efficiency of rumen MPS tended to decrease linearly with increasing peNDF concentration (P = 0.059).
Table 9. Nitrogen (N) balance and ruminal microbial protein synthesis in lactating dairy cows restrictively fed diets differing in physically effective neutral detergent fibre (peNDF) concentration
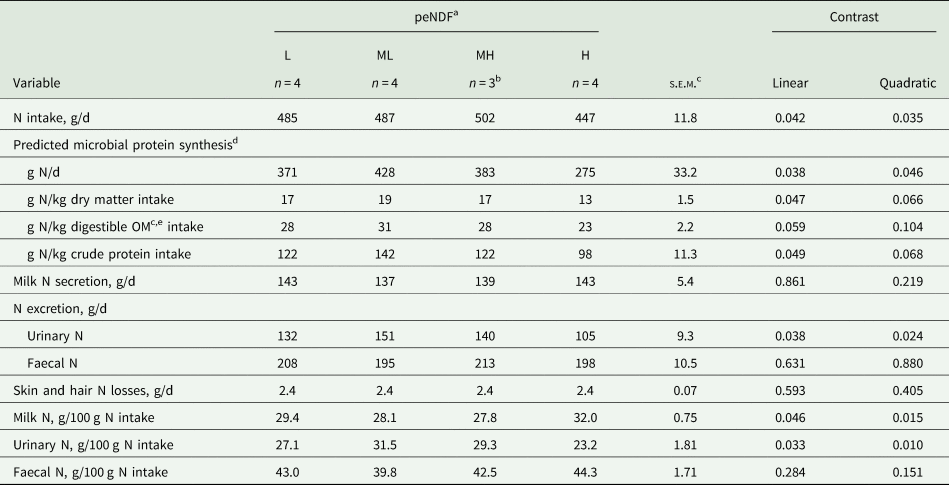
a Concentrations (per kg DM) of peNDF with particle size >8 mm: low (L; 202 g), medium-low (ML; 205 g), medium-high (MH; 218 g) and high (H; 234 g) (see Table 3).
b No data available for period 1.
c OM, organic matter; s.e.m., standard error of means.
d Estimated from the duodenal absorption of microbial purine derivatives (estimated according to Verbic et al. (Reference Verbic, Chen, MacLeod and Ørskov1990)) according to equation 5 of Chen and Gomes (Reference Chen and Gomes1992).
e Digestible OM intake estimated as the difference between total OM intake and faecal OM excretion.
Milk N secretion and daily faecal N loss were similar between peNDF concentrations (P ≥ 0.219). A quadratic relationship was observed between peNDF concentration and daily urinary N loss (P = 0.024), where urinary N loss was greater for ML and MH diets. The percentage of ingested N excreted via faeces was similar between peNDF concentrations (P ≥ 0.151); however, the percentage of ingested N excreted via urine and secreted via milk responded quadratically to increasing peNDF concentration with greater percentage of ingested N excreted via urine and less secreted via milk for ML and MH diets (P < 0.015 for all variables).
Discussion
Relationships between physically effective fibre, feed intake, nutrient digestibility and performance
Feeding dairy cows diets containing long dietary PS reduces solid passage rate and distends the reticulorumen, therefore limiting their DM intake (Allen, Reference Allen2000). In the present study, a quadratic response of feed intake, digestibility and performance in cows to increasing peNDF concentration was expected. Reducing the mixing time of the TMR resulted in a linear increase in peNDF>8.0 concentration from 202 to 234 g/kg DM and in X gm of PS from 7.3 to 8.9 mm. Indeed, increasing dietary peNDF concentration had a quadratic effect on nutrient intakes, with greater intakes observed for ML and MH diets. Positive effects on feed intake of smaller dietary PS were observed mostly in studies with a great proportion of forage (Soita et al., Reference Soita, Christensen, McKinnon and Mustafa2002, 100% barley silage fed to steers) or those including very long forage PS in the diet (Kononoff et al., Reference Kononoff, Heinrichs and Lehman2003, X gm = 7.4–8.8 mm, fed to lactating Holstein cows). The present study (X gm = 7.3–8.9 mm) confirmed the results of previous studies of decreasing DM intake when increasing the PS of the diets. However, nutrient intakes were lower for L than for ML and MH diets. Nonetheless, the differences in DM intakes between L and both, ML and MH, were small (≤0.7 kg/d) and might not be of biological relevance. Surprisingly, passage rate, CMRT and TMRT of liquid and solid digesta were similar across all peNDF concentrations. The quadratic effect observed on DM intake was rather caused by the pronounced decrease in DM intake of cows fed the H diet, which was likely related to a greater rumen fill due to the long PS, and the lower aOMd of the diet (see below). It is important to note that the adaptation period for TiO2 marker allocation in the present study was relatively short at 4.5 d. Therefore, the digestibility data should be regarded with caution due to this shorter adaptation period.
In line with the effects on DM intake, a tendency for a quadratic response of aOMd to varying peNDF concentrations was observed where aOMd was greater for ML and MH diets. Although mean aDMd, aNDFd and aCPd were statistically similar across peNDF concentrations, they followed numerically the same pattern as aOMd. Similar to DM intake, differences in mean aOMd between ML or MH and L diets were small (≤0.02), which suggested that the biological significance of these differences was also small. Yet, the lower aOMd for H was likely due to reduced surface area of the dietary particles for microbial adherence and attack due to the long particles (Zebeli et al., Reference Zebeli, Aschenbach, Tafaj, Boguhn, Ametaj and Drochner2012). As the passage rate of solids was similar across dietary peNDF concentrations, CMRT did not compensate for supposedly reduced microbial fermentation at high peNDF concentrations. Thus, the longer rumination time (per kg of DM and aNDF intakes) for H than for L, ML and MH diets supports the assumption of reduced ruminal OM and aNDF degradation (Kand and Dickhoefer, Reference Kand and Dickhoefer2021).
Although OM intake and aOMd were greater for both ML and MH diets, milk yield was not affected by dietary peNDF concentration in the present study. In contrast, ECM yield and milk fat yield were greater for L and H diets, as a result of numerically greater milk yield for L and H diets. Moreover, feed efficiency was greater for cows fed the L and H diets compared to ML and MH diets. Milk fat, protein and lactose contents and milk protein and lactose yields were not affected by dietary peNDF concentration despite the differences in nutrient intakes and digestibility. There were no differences in the BW and thus ME requirements for maintenance of the animals between treatments. The lack of effects on milk yield and composition, as well as the higher ECM and milk fat yields despite the pronounced decline in digestible OM and ME intakes for L and H diets cannot be fully explained. However, cows fed the ML and MH diets might have deposited body fat and/or those offered the H diet might have mobilized body tissue to sustain milk yield. Due to the short duration of the experimental periods, such changes in BW could not be detected, although animals were weighed frequently before morning feeding. Additionally, the fourth period of the study had to be postponed (due to COVID). The advanced lactation stage of cows in that period might have impacted average milk performance estimates, especially as the replacement cow was primiparous. Nevertheless, the drop in DM intake and ECM between the third and fourth period was similar for all four cows.
Although animals were fed a diet with predicted negative RNB, and hence, low N supply to rumen microbes, mean postruminal CP supply exceeded the requirements of animals (2688 g/d; GfE, 2001) in all diets with 3308, 3329, 3436 and 3145 g/d for L, ML, MH and H diets, respectively. This excess postruminal CP supply may explain the similar milk protein content and yield across diets. Moreover, increasing dietary peNDF concentration may have shifted starch digestion from the rumen to the duodenum, as previously observed by Yang and Beauchemin (Reference Yang and Beauchemin2006a) when high-yielding dairy cows fed a barley silage-based TMR with varying PS. Additionally, increasing CP flow to the small intestine may improve starch digestion through greater pancreatic amylase capacity (Harmon and Swanson, Reference Harmon and Swanson2020). The energy in form of glucose arising from postruminal starch digestion can be used energetically more efficiently by the animal for milk synthesis as well as for omental and mesenteric fat as compared to the energy derived from starch fermented in the rumen (Reynolds, Reference Reynolds2006). Hence, the excess in postruminal CP supply may have improved intestinal starch digestion in the present study, and thus may have enabled cows fed the H diet to maintain or even increase their BW and milk yield. However, the magnitude of the positive effect of the shift in starch digestion in combination with excess postruminal CP was likely to be small, because dietary starch concentration was lower in the H diet than in the other diets. The lack of effect on milk fat content was presumably due to the overall high peNDF concentrations of offered diets, with the lowest dietary peNDF>8.0 concentration in the present study of 202 g/kg DM, which was much greater than the recommendation for peNDF>8.0 by Zebeli et al. (Reference Zebeli, Dijkstra, Tafaj, Steingass, Ametaj and Drochner2008) of 149–185 g/kg DM for dairy cows. Consequently, the milk fat content of, on average, 40.3 g/kg milk was high in the present study.
Relationships between physically effective fibre, chewing behaviour, passage rate and rumen fermentation variables
The present study hypothesized that increasing dietary peNDF concentration also increases the intensity of total chewing activity (minutes and chews per kg DM intake). Due to a quadratic response of nutrient intake and aOMd to increasing peNDF concentration, total chewing activity (in minutes and chews per day) and liquid and solid digesta passage rates were also expected to be quadratically affected by peNDF concentration. Similarly, total chewing time (min/kg DM intake) tended to increase linearly with increasing peNDF concentration, although total number of chews (chews/kg DM intake) did not differ between diets. The increase in total chewing time (min/kg DM intake) in response to increasing peNDF concentration resulted from a prolonged rumination time (min/kg DM intake) because eating time (min/kg DM intake) was not affected. Nevertheless, due to the quadratic relationship between DM intake and increasing peNDF concentration, the daily rumination time was similar between diets, same as for daily eating time.
Compared to eating time (min/kg DM intake), rumination time (min/kg DM intake) is generally less affected by dietary PS or peNDF concentration, because additional mastication during eating reduces the need for additional PS break-down during rumination (Beauchemin, Reference Beauchemin2018). Similarly, Heering et al. (Reference Heering, Selje-Assmann and Dickhoefer2019) observed a linear increase in eating time (min/kg DM intake) but not in rumination time (min/kg DM intake) as peNDF>8.0 concentration increased from 237 to 283 g/kg DM. In comparison to the present study (X gm = 7.3–8.9 mm), the X gm of PS was greater in Heering et al. (Reference Heering, Selje-Assmann and Dickhoefer2019; X gm = 11.1–14.6 mm). In this line, Allen (Reference Allen1997) proposed that small or limited increases in rumination time can only be expected when X gm is above a threshold of 10 mm, which confirms observations in the present study. Moreover, diets in the present study contained more aNDF and had a greater proportion of forage, so cows needed more time to chew per kg aNDF intake (42–46 min) compared to those in the study of Heering et al. (Reference Heering, Selje-Assmann and Dickhoefer2019; 31–38 min).
Passage rate of solid digesta was similar across diets in the present study and was not affected by the peNDF concentration of the diet. This is in line with observations by Yang et al. (Reference Yang, Beauchemin and Rode2001), who were feeding high-yielding dairy cows TMR with increasing forage PS but is in contrast to the results of a study of Rode et al. (Reference Rode, Weakley and Satter1985) in which passage rate of solid material declined when the forage PS of diets fed to dairy cows was increased. Moreover, previous studies (Rode et al., Reference Rode, Weakley and Satter1985; Kononoff and Heinrichs, Reference Kononoff and Heinrichs2003) recorded a faster liquid passage rate in dairy cows with greater dietary PS, which was probably due to a rise in rumination activity (minutes and chews per kg DM intake) and salivary flow as forage PS in the diets fed to them increased. In contrast, passage rate of liquids was not affected by peNDF in the present study. However, compared to the situation in the present study, Rode et al. (Reference Rode, Weakley and Satter1985) tested a broader range of dietary PS (ground to long alfalfa hay) with a greater proportion of forage (80%, on DM basis) in their diets. Moreover, the lack of effect of peNDF on solid digesta passage rate in the present study and that of Yang et al. (Reference Yang, Beauchemin and Rode2001) might be due to an increase in chewing intensity (min/kg DM intake) and mastication with increasing peNDF concentration, suggesting that PS reduction is not a rate-determining step in ruminal particulate passage rate. Besides the narrow range in peNDF concentrations in the present study, the greater chewing intensity with increasing peNDF concentration may not have affected ruminal mat formation and hence, liquid passage rate. Nevertheless, an increase in chewing and rumination intensity (min/kg DM intake) for MH and ML diets probably enhanced saliva secretion, and hence, N recycling, as speculated by Kand and Dickhoefer (Reference Kand and Dickhoefer2021). However, the increments in total saliva secretion and thus in N recycling were probably very small. For instance, Maekawa et al. (Reference Maekawa, Beauchemin and Christensen2002) determined an increase in saliva production of only 25 l/d (11%) when the total chewing time of dairy cows increased by 107 min/d (14.4%) as the proportion of forage in their diet was raised from 40 to 60% (on DM basis). This difference in daily chewing time was greater than the one observed in the present study, in which daily chewing time increased by only 78 min (7.8%) from L diet (with the shortest daily chewing time) to MH diet (with the longest daily chewing time). Hence, as the differences in daily chewing time between treatments were smaller in the present study, the increase in salivation may be even smaller than in the study of Maekawa et al. (Reference Maekawa, Beauchemin and Christensen2002).
It is a commonly accepted principle that greater peNDF concentration plays a significant role in promoting chewing and salivation and hence, increases buffering capacity within the rumen (Mertens, Reference Mertens1997). The mean ruminal pH displayed a quadratic response to increasing peNDF concentrations, resulting in slightly higher average ruminal pH for both L and H diets. However, these differences might not have any biological relevance. Furthermore, there were no differences observed in total VFA concentrations in rumen fluid or in the rumen fluid VFA profile between the diets.
The average ruminal pH observed across all peNDF concentrations ranged from 6.29 to 6.43, which is consistent with findings from other studies with diets of comparable forage-to-concentrate ratios as in the present study (Kononoff et al., Reference Kononoff, Heinrichs and Lehman2003). Moreover, the observed mean ruminal pH was higher than the recommended minimum mean ruminal pH of 6.16, which is necessary to mitigate the risk of acidosis in high-yielding dairy cows (Zebeli et al., Reference Zebeli, Dijkstra, Tafaj, Steingass, Ametaj and Drochner2008). The high pH levels across the diets can be attributed to the overall high concentration of and (396–406 g/kg DM) and high X gm (7.3–8.9 mm) in the experimental diets offered to cows in the present study, as well as the low starch concentrations (88–102 g/kg DM). In addition, the total chewing time of cows was ≥42 min/kg DM intake, which is greater than the threshold of ≥30 min/kg DM intake of chewing proposed by Sudweeks et al. (Reference Sudweeks, Ely, Mertens and Sisk1981) to reduce the risk of digestive disorders.
Relationship between physically effective fibre, nitrogen metabolism and turnover
It was proposed that increasing peNDF concentration promotes ruminal MPS via enhanced N recycling due to increased total chewing time and number of chews of cows, when N is limiting in the rumen. However, above a certain peNDF concentration, both MPS and chewing activity, are expected to decrease, due to potentially lower feed intake and digestibility. Correspondingly, increasing peNDF concentration elevated MPS only up to a certain point, after which the dietary PS was too large and negatively affected feed intake and aOMd. The quadratic response in MPS with increasing peNDF concentration is in line with the results of a study of Yang and Beauchemin (Reference Yang and Beauchemin2006b) with lactating dairy cows offered diets with 47% barley silage and 53% concentrate (on DM basis), as well as dietary peNDF>8.0 concentrations of 100–176 g/kg DM. However, while the efficiency of ruminal MPS (g N/kg digestible OM intake) also tended to respond quadratically to increasing peNDF concentrations in the study of Yang and Beauchemin (Reference Yang and Beauchemin2006b), it tended to decline linearly with increasing peNDF concentration in the present study. Moreover, the efficiency of ruminal MPS (g N/kg DM intake and g N/kg CP intake) declines linearly with increasing dietary peNDF concentration. The efficiency of MPS is, among other factors, affected by the type of feed, forage quality, synchronization of N and energy from the diet, the ruminal pH, and outflow rate (Harun and Sali, Reference Harun and Sali2019). The lower efficiency of ruminal MPS for the H diet compared to the other diets was probably attributable to a lower supply of rumen-degradable CP and fermentable energy due to lower digestible OM, starch and N intakes, the lower aOMd and the reduced ruminal starch degradation in response to increasing dietary PS (see above), as well as the unexpectantly similar solid and liquid digesta passage rates. As indicated by Yang and Beauchemin (Reference Yang and Beauchemin2006a), increasing the peNDF concentration by varying the PS of a TMR might lower starch digestion in the rumen resulting in a shift in starch digestion to the intestine.
Irrespective of the differences in ruminal MPS, ruminal NH4–N and MUN concentrations were similar across diets. Since only spot-measurements of the concentration of NH4–N were made, possible effects of dietary peNDF concentration on ruminal NH4-N production cannot be fully excluded. Nevertheless, the excess of postruminal CP supply over the animals' requirements was greater for L, ML and MH diets as compared to the H diet. Together with the prolonged chewing time and greater number of chews, this presumably resulted in greater endogenous N supply to the rumen microbes as speculated by Kand and Dickhoefer (Reference Kand and Dickhoefer2021). Additionally, CP intakes were greater for L, ML and MH diets than for the H diet, suggesting that ruminal NH4–N release was probably higher for these diets. At the same time, the greater MPS for the L, ML and MH diets as compared to the H diet indicates an increased incorporation of NH4–N by rumen microbes, thus explaining the similar ruminal NH4–N and also MUN across diets.
Feeding excess N to animals beyond their requirements is known to increase excretion of N, in particular via urine (Huhtanen et al., Reference Huhtanen, Nousiainen, Rinne, Kytölä and Khalili2008), while reducing the percentage of ingested N being utilized by the animal for milk protein synthesis (Castillo et al., Reference Castillo, Kebreab, Beever and France2000). In the present study, there was a quadratic response of N intake to increasing peNDF concentration. The percentage of N excreted via urine was greater, and the percentage of ingested N secreted via milk was lower for ML and MH diets, while there was no effect on the proportion of ingested N excreted via faeces. Although N intake was lower and the percentage of ingested N secreted via milk was greater in L compared to ML and MH diets, absolute differences in both variables between these treatments were small and may not be of relevance. Instead, the differences in the percentage of ingested N excreted via urine or secreted via milk were greater for the H diet compared to the other diets, due to a much lower N intake of the animals receiving this diet. Moreover, the greater milk N use efficiency (g milk N/100 g N intake) observed for the H diet might also be due to the hypothesized enhanced efficiency of milk synthesis as a result of greater intestinal starch digestion and uptake of glucose in the duodenum (see above).
Increasing the efficiency of N use in dairy production is currently an environmental challenge. Feeding diets with reduced N supply (i.e. a slightly negative RNB) and optimal dietary peNDF concentration with respect to feed intake and health to dairy cows may provide a promising opportunity to reduce potential negative effects of low RNB on apparent total tract digestibility of nutrients and ruminal MPS, while at the same time, maintaining animal performance and decreasing N emissions. Moreover, it is important to consider the RNB of a diet when monitoring the effects of peNDF and vice versa under practical on-farm and research conditions, for a better comprehension of the physiological effects of dietary RNB or peNDF concentration in dairy cows.
Conclusions
Under conditions similar to those in the present study, increasing peNDF concentration of diets with negative RNB and moderate-to-high aNDF concentrations quadratically affects nutrient intake and digestibility, with no effects on ruminal fermentation, passage rates of solid and liquid digesta, as well as performance of high-yielding dairy cows. However, the quantity and the efficiency of MPS decline linearly with increasing peNDF concentration. In contrast, increasing the dietary peNDF concentration tended to have a positive linear effect on total chewing intensity (min/kg DM intake) and had a quadratic effect on the fate of ingested N in the animal, resulting in a lower percentage of ingested N being secreted via milk and a higher excretion of N in urine for moderate peNDF concentrations. Hence, offering dairy cows’ diets with a low RNB and high dietary peNDF concentration may reduce the potential negative effects of low RNB, while maintaining the animals' performance and providing environmental benefits. Yet, a better understanding is needed of the interaction between RNB and dietary peNDF concentration and its effect on the protein metabolism of dairy cows.
Acknowledgements
This paper builds upon work undertaken for the first author's doctoral thesis. The authors thank Florence Fournier, Sylvie Rudel, Dominique Roux, Lionel Mouly, François Rosa and Hervé Tournadre of INRAE Herbipôle experimental unit and Aline Le-Morvan of INRAE UMR Herbivores for their contributions during the execution of the experiment. We appreciate the supply of rumen fluid provided by the Institute of Animal Science at the University of Hohenheim. The authors acknowledge the contribution of Hermann Baumgärtner in laboratory analyses at the University of Hohenheim. The authors thank Professor Eva Schlecht from the University of Kassel for her guidance in passage rate determination and her valuable comments on the manuscript.
Author contributions
R. Heering, N. Selje-Aßmann and U. Dickhoefer conceived and designed the study. R. Heering conducted data gathering, performed statistical analyses and wrote the original draft. Supervision and writing were performed by U. Dickhoefer. R. Baumont provided supervision during the investigation and conducted the review and editing of the article. N. Selje-Aßmann reviewed and edited the article.
Funding statement
This work was supported by the H. Wilhelm Schaumann Stiftung, Germany. Financial support provided by the Transnational Access to Research Infrastructures activity in the European Union's Horizon 2020 research and innovation programme (Project ‘SmartCow’; grant agreement 730924) is gratefully acknowledged.
Competing interests
The authors declare there are no competing interests.
Ethical standards
Prior to commencement, the Auvergne Rhône-Alpes Ethics Committee for Studies on Animals approved all experimental procedures (DGRI's agreement APAFIS15401-2017062616304407, France), which were in compliance with the guidelines established by the European Union Directive 2010/63/EU.


 Open access