


Introduction
Lolium perenne (LoPe) is the most important species on intensively managed grasslands in Central Europe, especially when precipitation is high (Norris, Reference Norris1982); and is well adapted to clay soils and frequent defoliations such as those on intensively grazed pasture and lawn (Watson and More, Reference Watson and More1962; Frame, Reference Frame1992; Turner et al., Reference Turner, Holloway-Phillips, Rawnsley, Donaghy and Pembleton2012). However, in some areas in Central Europe conditions for optimal growth of LoPe are likely to become less favourable as climate change might lead to more frequent periods of prolonged drought (IPCC, 2022). There is also a growing trend towards all-year housing of dairy cows relying on systems with cutting-only grassland for silage which usually implies fewer defoliations. Consequently, species better adapted to fewer defoliations might invade the sward and suppress and displace even a highly competitive grass like LoPe (Turner et al., Reference Turner, Holloway-Phillips, Rawnsley, Donaghy and Pembleton2012). Fewer defoliations usually also have a negative effect on feed quality due to longer growing periods resulting in greater plant maturity. Motazedian and Sharrow (Reference Motazedian and Sharrow1990) found that the content of crude protein (CP) of a grass-clover sward decreased by approximately 0.2% for each additional day between defoliations compared to a minimum defoliation interval of seven days.
Against this background there seems to be a need for alternative species to LoPe. Festuca arundinacea (FeAr), for example, is better adapted to dry conditions (Suter et al., Reference Suter, Frick, Hirschi and Chapuis2009; Cougnon et al., Reference Cougnon, Baert, Van Waes and Reheul2014). Phleum pratense (PhPr) has a higher content of CP than LoPe (Frame, Reference Frame1991) and is better adapted to cutting-only systems with fewer defoliations (Suter et al., Reference Suter, Frick, Hirschi and Chapuis2009). However, these alternative species also have some disadvantages: PhPr often has lower yields than LoPe (Frame, Reference Frame1991); FeAr has harder leaves, contains silicates, has a lower digestibility than LoPe (Cougnon et al., Reference Cougnon, Baert, Van Waes and Reheul2014), and can affect animal health when infected with endophytes (Stuedemann and Hoveland, Reference Stuedemann and Hoveland1988). New varieties of FeAr, however, are much better accepted by livestock also under grazing (Suter et al., Reference Suter, Frick, Hirschi and Chapuis2009) as they have softer leaf tissue, less silicate and are free of endophytes.
In response to the need for alternatives to L. perenne, we set up a field experiment with modern varieties of FeAr and PhPr and used LoPe as a reference. These three grass species were sown as the main species in mixtures with smaller amounts of Poa pratensis (PoPr) and Trifolium repens (TrRp) on three sites with different soils – a clay, a peat and a sandy soil. The established swards were then subjected to three management schemes that differed in frequency of defoliation: ‘cutting-only’ (four cuts), ‘simulated grazing’ (seven cuts) and a ‘mixed system’ (six cuts).
In the first part of the study, Becker et al. (Reference Becker, Isselstein, Jürschik, Benke and Kayser2020) reported on yields and persistence of the main species in the sward over time. We are now presenting results on the feed quality of the three mixtures as affected by the frequency of defoliation, soil type and the interaction of both factors.
To answer the question whether F. arundinacea and P. pratense might serve as alternatives to L. perenne, we followed the hypotheses (i) the feed quality (content of net energy and CP in harvested biomass) of mixtures with F. arundinacea and P. pratense as the main species is not lower than that of L. perenne under varying climatic, soil and management conditions (frequency of defoliation) and (ii) the feed quality of F. arundinacea and P. pratense is sufficient for the nutrition of dairy cows.
Material and methods
Experimental site and set-up
The experiment was established in early autumn 2013 on three sites – a sandy, a clay and a peat soil – in Northwest Germany within a 30 km radius of the town of Oldenburg (53° 9’ N and 8° 5’ E; 5 m a.s.l.). Main experimental years covering the full vegetation period were 2014, 2015 and 2016. The pH was 5.2, 4.1 and 5.7 for the sandy, peat and clay soil, respectively. Plant available concentrations of the macronutrients P, K (CAL, calcium-acetate-lactate extraction) and Mg (CaCl2 extraction) in the topsoil (0–10 cm) for the year 2014 were in a range of 40–80 mg/kg for P, 60–130 mg/kg for K and Mg 60–420 mg/kg for Mg, and can in all cases be regarded as sufficient for grass production (Landwirtschaftskammer Niedersachsen, 2011). Climatic conditions are similar for all sites and are characterized by a maritime climate with moderate temperatures in summer and mild and rainy winters. Rainfall in 2014 was comparatively high in May, July and August and moderate in June; in 2015, spring and early summer were characterized by dry conditions that ended only with significant rainfall in July; in 2016 rainfall in spring was rather limited but high in June (Table 1).
Table 1. Average monthly temperature (Temp.) and monthly total precipitation (Prec.) in 2014, 2015 and 2016 and long-term average
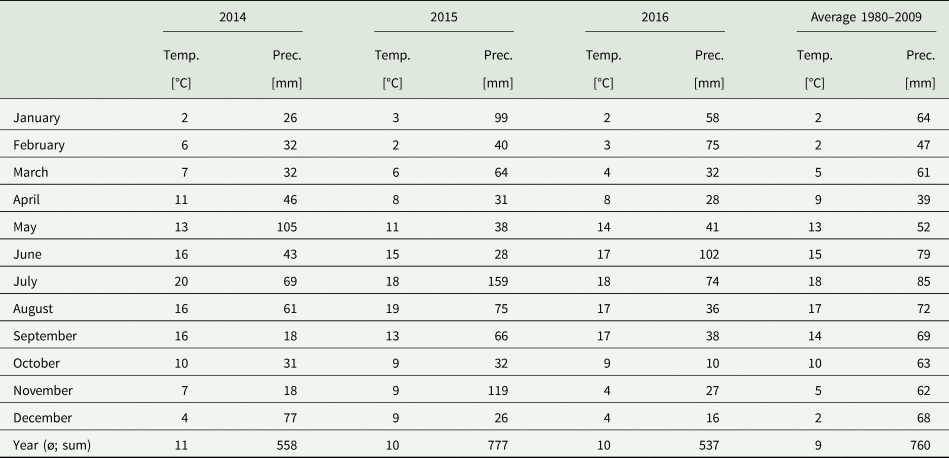
Averaged over two weather stations on the clay site and the sandy soil site; the peat-site is located between the two other sites within a distance of 15 km.
The experimental set-up was the same on all sites and followed a split-plot design with the treatment ‘management’ forming three sub-blocks within the three main blocks (replications) and plots of the treatment ‘mixtures’ randomly allocated to the sub-blocks. The modern varieties of the main species LoPe, FeAr and PhPr were each accompanied by T. repens and PoPr and were sown by a self-propelled plot seeder (Wintersteiger Seedmech, Hege 76) in autumn 2013 (Table 2). The mixtures were subjected to three different defoliation frequencies: a cutting-only system (four cuts), a simulated grazing system (seven cuts) and a mixed system (six cuts; one cut as in cutting-only followed by simulated grazing) over three experimental years. The design is an adaption of that of Corrall and Fenlon (Reference Corrall and Fenlon1978) where crop growth rates are determined by weekly cuttings of four week old regrowths. In our study, we harvested four week old regrowths of alternate sub-plots every second week and were thus able to determine bi-weekly crop growth rates. There were two sub-plots for every mixture in the simulated grazing and mixed system which were each harvested every four weeks (thus a double set of plots); harvesting of the second set of the respective sub-plots started two weeks later than that of the first set allowing for calculation of growth curves based on two-week intervals (Becker et al., Reference Becker, Isselstein, Jürschik, Benke and Kayser2020). The cutting-only plots only consisted of one sub-plot per block. First cutting for the simulated grazing took place from 5–15 April each year whereas the mixed system and the cutting-only system were harvested from 15–25 May for the first time. Other than the four week regime (28-day interval) for the simulated grazing and mixed systems, the cutting-only plots were harvest every six weeks after the first cut. As we are not showing growth-rates here, the double set of data for the management schemes grazing and the mixed system were averaged to give one value for yield, energy content and CP for each defoliation date. That gives us robust values and also ensures that grazing, mixed and cutting-only now have one data set for each defoliation date for statistical analysis.
Table 2. Factorial design of the experiments and information on sowing and management
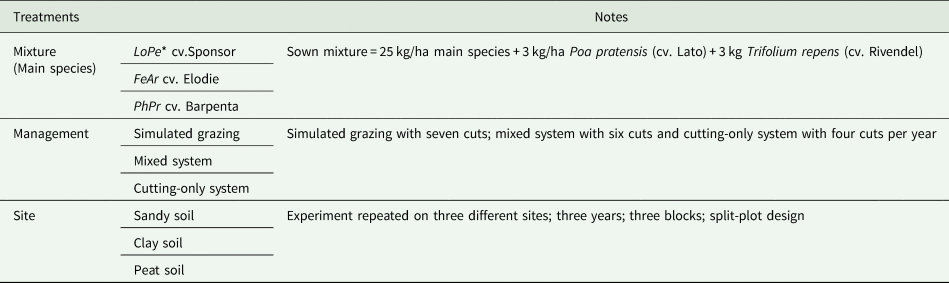
* LoPe: Lolium perenne, FeAr: Festuca arundinacea, PhPr: Phleum pratense.
The supply of the main nutrients with fertilizer was according to that of intensively managed grassland. A nitrogen deficiency was to be avoided. All plots received 320 kg synthetic N/ha, 75 kg P/ha and 150 kg K/ha per year. The nitrogen fertilizer was applied depending on the cutting system in three to six doses of 28–100 kg N/ha per regrowth (cutting only, 100:80:80:60 kg N/ha; grazing, 100:41:41:41:41:28:28 kg N/ha; mixed system, 100:50:50:50:35:35 kg N /ha). After an initial supply of 100 kg N/ha in March/April of each year, the remaining N was applied for each defoliation frequency (four to seven cuts) after each cut in respective doses. The type of N fertilizer was calcium-ammonium-nitrate (CAN; 27% N). Phosphorus and potassium were applied in March in mineral form as triple-phosphate (20.1% P) and potassium chloride (33.2% K), respectively.
A more detailed description of the experiment can be found in Becker et al. (Reference Becker, Isselstein, Jürschik, Benke and Kayser2020).
Samples and analyses
Plot size was 1.5 × 7.0 m and plots were harvested in total with a remaining stubble height of 4 cm. Grab samples of 500 g were taken by hand from the mown swaths and dried for 48 h at 60°C. Dried material was ground to 1 mm and analysed by near infrared reflectance spectroscopy (NIRS) for total N, and for energy content and CP as indicators of feed quality. A grass and forage calibration (Tillmann, Reference Tillmann2010) was used to process spectra files which contained 3169 calibration samples for CP with a standard error of calibration (SEC) of 7.6, a standard error of cross validation (SECV) of 7.7 and a standard error of prediction (SEP) of 8.0 g/kg DM. In parallel to this we determined the dry matter (DM) content at 105°C. The net energy content (MJ/kg DM) was calculated in accordance with the guidelines of the German Society of Nutrition Physiology (GfE, 2009). Data on energy content and CP is based on analyses of samples from all treatments, replications and harvest cuts. Annual averages of energy content and CP are weighted averages. When calculating the weighted averages for energy content and CP from data of each cut, the proportions of the DM yield of each cut of the accumulated annual DM yield is considered.
Before each harvest, the plant cover of the different species and the proportion of bare soil were assessed visually. In the third year, July 2016, we determined the mass proportions of the main occurring species by separation of grab samples from every plot.
Statistics
For statistical analysis of the parameters net energy content, CP content, and of their total yields, we used the lme function of the nlme package (Pinheiro et al., Reference Pinheiro, Bates, DebRoy, Sarkar, Heisterkamp, Van Willigen and Maintainer2017) in R Studio (R software environment version 3.6.3, 2020). Year, site, mixture and management and their interactions were considered as fixed factors in a mixed model approach; replications in blocks and sub-blocks were taken as random factors. Least square means were calculated using the ‘emmeans’ package (Lenth et al., Reference Lenth, Singmann, Love, Buerkner and Herve2019). Comparison of means is done at α = 0.05.
Results
In the following, the species name is synonymous with the sown mixture in which it is the main species; if the reference is to the species alone, this is indicated.
Yield and persistence
The DM yields of the three mixtures differed significantly (P < 0.05) and yields were also significantly influenced by management and year. The soil type had no significant effect on the DM yield (see also Becker et al., Reference Becker, Isselstein, Jürschik, Benke and Kayser2020). DM yields of mixtures were on average over three years largest for FeAr with 13 810 kg/ha, followed by LoPe with 11 301 kg/ha and smallest for PhPr with 10 366 kg/ha (P < 0.05). DM yields were on average lower in the simulated grazing system (11 209 kg/ha) than in the mixed system and the cutting-only system (12 029 and 12 238 kg/ha, respectively; P < 0.05), Yields were on average significantly higher in 2016 (12 628 kg/ha) than in 2014 and 2015 (11 074 and 11 774 kg/ha, respectively; P < 0.05).
After three years, persistence of the main species differed significantly (P < 0.05) among the three mixtures: in the last year, yield proportions of the main species amounted to 91% for FeAr, 80% for LoPe and 52% for PhPr. On the sand and clay site the main species accounted on average for 84% of the total yield. On the peat soil the main species accounted for only 54% of the total yield, which is significantly less (P < 0.05) than on the sand and clay site. On peat, all three main species were displaced mainly by Holcus lanatus (HoLa). The highest proportion of HoLa (49%, P < 0.05) occurred in the mixtures with PhPr as the main species. On sand and clay, PhPr was partly displaced by PoPr (sown with 3 kg/ha in all mixtures) which accounted for 30% yield proportion on the clay and 18% on the sand site. The development of yield and persistence of the main species during the experiment are presented in more detail in Becker et al. (Reference Becker, Isselstein, Jürschik, Benke and Kayser2020).
Content of net energy and crude protein
The three grass mixtures differed significantly in their net energy content (P < 0.001) and CP content (P < 0.001). The factors year, management and soil type had significant effects on the content of net energy (year: P < 0.001; management: P < 0.001; soil: P = 0.0042) and CP content (year: P < 0.001; management: P < 0.001; soil: P = 0.0003). We found significant interactions of the factor mixture with year (P < 0.001) and soil type (P < 0.001) but not with the factor management for the net energy content, and significant interactions of the factor mixture with management (P = 0.0071), year (P < 0.001), and soil type (P < 0.001) for the CP content (Table 3–5).
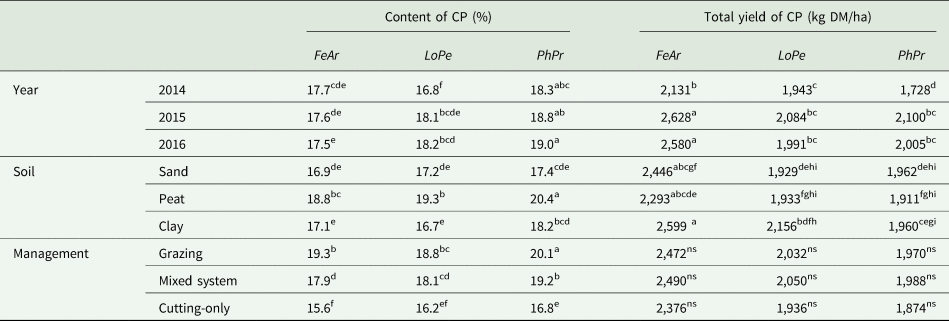
Table 3. Lsmeans of the content of net energy, the total yield of net energy per ha, lsmeans of the crude protein content (CP) and total yield of CP in dry matter for the factors mixture, management and site and year*
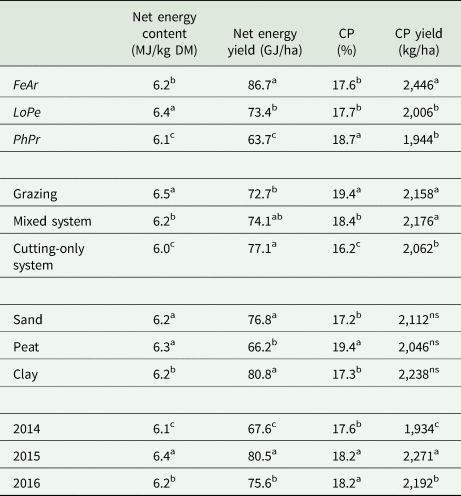
* Different letters indicate significant differences (P < 0.05) in the respective columns for the main species, the managements, the soil types and the years. Grazing: Simulated grazing. FeAr: Festuca arundinacea, LoPe: Lolium perenne, PhPr: Phleum pratense.
Table 4. Lsmeans of the content of net energy and of the total yield of net energy. Two way interactions of the species with the factors management, soil and year*
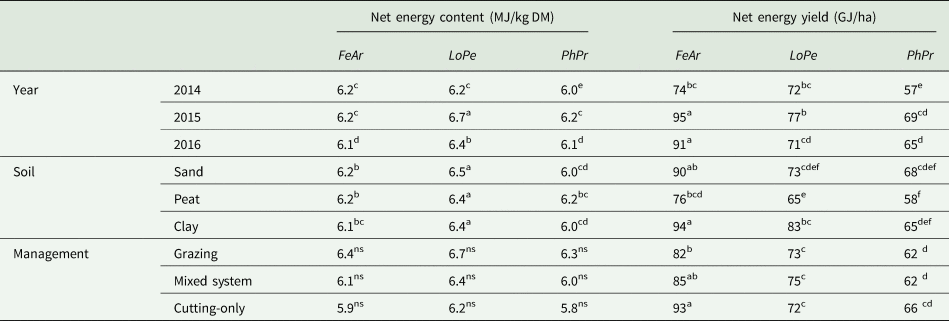
* Different letters indicate significant differences (P < 0.05) within each two-way interaction. Grazing: Simulated grazing. FeAr: Festuca arundinacea, LoPe: Lolium perenne, PhPr: Phleum pratense.
Table 5. Lsmeans of crude protein content (CP) and of the total yield of CP. Two-way interactions of the species with the factors management, soil and year*
* Different letters indicate significant differences (P < 0.05) within each two-way interaction. Grazing: Simulated grazing. FeAr: Festuca arundinacea, LoPe: Lolium perenne, PhPr: Phleum pratense.
Content of net energy was significantly higher for mixtures of LoPe (6.4 MJ/kg DM) than for those of FeAr (6.2 MJ/kg DM) and PhPr (6.1 MJ/kg DM). Mixtures with PhPr had the significantly highest content of CP (18.7%); the content of CP for LoPe (17.7%) and FeAr (17.6%) did not differ significantly.
Under conditions of simulated grazing, content of net energy (6.5 MJ/kg DM) and CP (19.4%) were significantly higher than in the mixed system (6.2 MJ/kg DM, 18.4% CP), while in the cutting-only system, net energy and CP content were significantly lowest (6.0 MJ/kg DM and 16.2% CP; Table 3).
LoPe mixtures in the simulated grazing system had on average the significantly highest net energy content (6.7 MJ/kg DM) while PhPr mixtures in the cutting-only system had the lowest net energy content (5.8 MJ/kg DM). Mixtures with PhPr under simulated grazing management had the highest content of CP (20.1%) while the lowest content of CP was found for FeAr (15.6%) and LoPe (16.2%) in the cutting-only system.
The energy content of the three sown grass mixtures did not differ among the three soils, but the content of CP was usually higher on peat soil (Table 4 and 5). Averaged over the three mixtures and the three management regimes, CP on peat soil (19.5%) was significantly higher than on sand (17.2%) and clay (17.3%) – the highest content of CP was found for PhPr on peat soil (20.4%; Table 5).
The content of net energy and CP when averaged over soils and managements was different in the three experimental years for the three mixtures (Table 4 and 5). In 2014, the content of net energy (6.1 MJ/kg DM) and CP (17.6%) was lowest while the highest net energy content was found in 2015 (6.4 MJ/kg DM). In 2016 the net energy content (6.2 MJ/kg DM) was significantly higher than in 2014 and significantly lower than in 2015. The net energy content was highest for LoPe in 2015 and 2016 (6.7 and 6.4 MJ/kg DM, respectively), but did not differ from that of FeAr in 2014 (6.2 MJ/kg DM; Table 5).
During the three experimental years, the content of CP increased on the peat soil which corresponds with the increasing proportion of the protein-rich HoLa in the plots.
Total yield of net energy and crude protein
All main factors (year, management, mixtures, soils) had a significant effect on the total yield of net energy per ha (GJ/ha). The interactions of the factor mixture with year, soil and management for total yield of net energy (GJ/ha) were significant at P < 0,001, P < 0.001 and P = 0.0073, respectively. Total yields of net energy of mixtures of FeAr were higher (86.7 GJ/ha; P < 0.05) than those of LoPe (73.4 GJ/ha) and PhPr (63.7 GJ/ha) when averaged over years, management systems and soils. In the cutting-only system (77.1 GJ/ha) the total yield of net energy was significantly higher than in the simulated grazing system (72.7 GJ/ha) while energy yields in the mixed system (74.1 GJ/ha) ranged in-between cutting-only and grazing (Table 3). Yields of total net energy, when averaged over years and mixtures, were significantly smaller on peat soil (66.2 GJ/ha) than on clay (80.8 GJ/ha) and on sand (76.8 GJ/ha; Table 3).
While total net energy yields increased by about 5 GJ/ha for LoPe mixtures from the first to the second year, the increase was as high as 21 GJ/ha for FeAr and 12.4 GJ/ha for PhPr mixtures (Table 4). Total net energy yields for LoPe and FeAr were largest on clay while the effect of the factor soil on PhPr mixtures was negligible.
FeAr mixtures had the highest total yields of net energy in the cutting-only system which was 11 GJ/ha more than in the simulated grazing system, a difference that is statistically significant (Table 4). For LoPe and PhPr mixtures the total yield of net energy did not differ significantly among the three management systems. For all mixtures, total net energy yields were highest in 2015; however, for FeAr and PhPr total net energy yields did not differ significantly between 2015 and 2016.
The total yields of CP per ha were significantly influenced by the factors mixture, management and year; but total yields of CP did not differ among the soil types (Table 3). The interactions of the factor mixtures with year and soil type were significant at P < 0.0001 and P = 0.0093, respectively, while the interaction of the factors mixture and management regime was not significant. When averaged over management, soil type and year, total yields of CP were largest for mixtures of FeAr (2446 kg/ha); while values for LoPe (2006 kg/ha) and PhPr (1944 kg/ha) did not differ significantly from each other (Table 3). In addition, total yields of CP of the respective mixtures did not differ significantly among the soil types (Table 5). FeAr and PhPr had significantly larger yields of CP in 2015 and 2016 than in 2014 (Table 5). Total yields of CP were significantly higher in the simulated grazing system (2158 kg/ha) and in the mixed system (2176 kg/ha) than in the cutting-only system (2062 kg/ha). The total yields of CP also differed among the years.
Discussion
The effects of the tested factors and interactions on DM yields are discussed in detail in Becker et al. (Reference Becker, Isselstein, Jürschik, Benke and Kayser2020). Total yields of net energy and CP are calculated from DM yields and the respective content of net energy and CP. This means also that a very high DM yield combined with a lower content of net energy or CP can still lead to high total yields of net energy and CP. For example, a low net energy and CP content in the cutting-only system was balanced by high DM yields; a low content of net energy and CP but large DM yields in FeAr mixtures resulted in high total yields of net energy and protein. It should also be considered that the N input with fertilization of 320 kg N/ha for all three management and mixtures was relatively high ensuring potentially good yields and contributing to the CP contents.
Effects of competition of species on net energy content and crude protein
The feed quality of the mixtures in our experiment was determined for every cut. Sward composition changed during the course of the experimental years and this change needs to be considered when values of feed quality are interpreted (also see Becker et al., Reference Becker, Isselstein, Jürschik, Benke and Kayser2020). The minor mixture partner T. repens is not discussed as the proportions in the sward were negligible. On peat soil all three mixtures were strongly affected by the invasion of H. lanatus (HoLa), with the sown mixture of PhPr being most affected. The proportion of HoLa in the third year on peat was 49% for PhPr and 26% for LoPe. Holcus lanatus is regarded as having a low palatability and is usually avoided by grazing animals. This can be explained by the hairy texture of HoLa and a high proportion of inflorescences and dead leaves (Cameron, Reference Cameron1979). However, an improved grazing management can be an effective means to overcome the negative characteristics of HoLa. Swards with higher proportions of this grass should ideally be defoliated at least six times per year starting with an early first defoliation in April.
The PhPr mixtures on sand and clay were influenced by increasing proportions of PoPr (18% on the sandy site and 30% on clay in the third year). Because of the change in species composition over time, the results of the simple mixtures in our experiments might not be fully comparable to the results obtained in experiments with single species. Though the amount of LoPe in the mixtures was more reduced than in FeAr (persistence in the third year was 90%), the average net energy content of the LoPe mixtures (6.4 MJ/kg DM) was always higher than in FeAr mixtures (6.2 MJ/kg DM; Figure 1a). This is most likely caused by the higher content of net energy in the leaves of LoPe; but also suggests that invading HoLa did not affect energy contents negatively. Watkin and Robinson (Reference Watkin and Robinson1974) found that the performance of sheep fed with HoLa was only slightly less than that with LoPe. These findings are similar to those of other studies. Cougnon et al. (Reference Cougnon, Baert, Van Waes and Reheul2014) compared pure swards of LoPe and FeAr and found an in-vitro digestibility of 79% for LoPe and only 71% for FeAr; this corresponds to a content of metabolizable energy (ME) of 12.6 MJ/kg DM for LoPe and 11.4 MJ/kg DM for FeAr (calculated following a formula suggested by Givens et al. (Reference Givens, Everington and Adamson1989)). In the same experiment, mixtures of LoPe and FeAr had a feed quality which fell intermediate between that of single species swards. Davies and Morgan (Reference Davies and Morgan1982) compared FeAr, LoPe and PhPr and found the highest in-vitro digestibility of 70% for LoPe (11.2 MJ ME/kg DM) but only 62% in-vitro digestibility and 9.9 MJ ME/kg DM for FeAr. Lee et al. (Reference Lee, Clark, Clark, Waugh, Roach, Minneé, Glassey, Woodward, Woodfield and Chapman2018) in a three-year field trial found that LoPe had a significantly higher content of metabolizable energy (ME) (12.1 MJ/kg DM) than FeAr (11.8 MJ/kg DM). Kalzendorf and Hinrichsen (Reference Kalzendorf and Hinrichsen2017) found for pure swards of LoPe in the first, second and third cut a content of net energy of always more than 6.3 MJ/kg DM while the net energy content of FeAr at each cut was below 6.0 MJ/kg DM. In our experiments, the net energy content was always lowest for PhPr mixtures (Fig. 1a). This is different from the results of Davies and Morgan (Reference Davies and Morgan1982) with pure swards of PhPr that had an in-vitro digestibility of 66.3% (10.6 MJ ME/kg DM), which is similar to LoPe and higher than that of FeAr. The relatively low energy content of PhPr on sand and clay in our experiments is most likely caused by the high proportions of the sown PoPr in the sward. On peat, the invading species HoLa could have had, at least indirectly by preventing higher proportions of PoPr, a positive effect on the feed quality of PhPr swards and contributed to an increased DM digestibility (Frame, Reference Frame1991). Watt (Reference Watt1987) reported an organic matter digestibility for two commercial varieties of HoLa of 73.1% and 74.3% at a low and high N fertilization, respectively; digestibility was at the same level as that for LoPe.
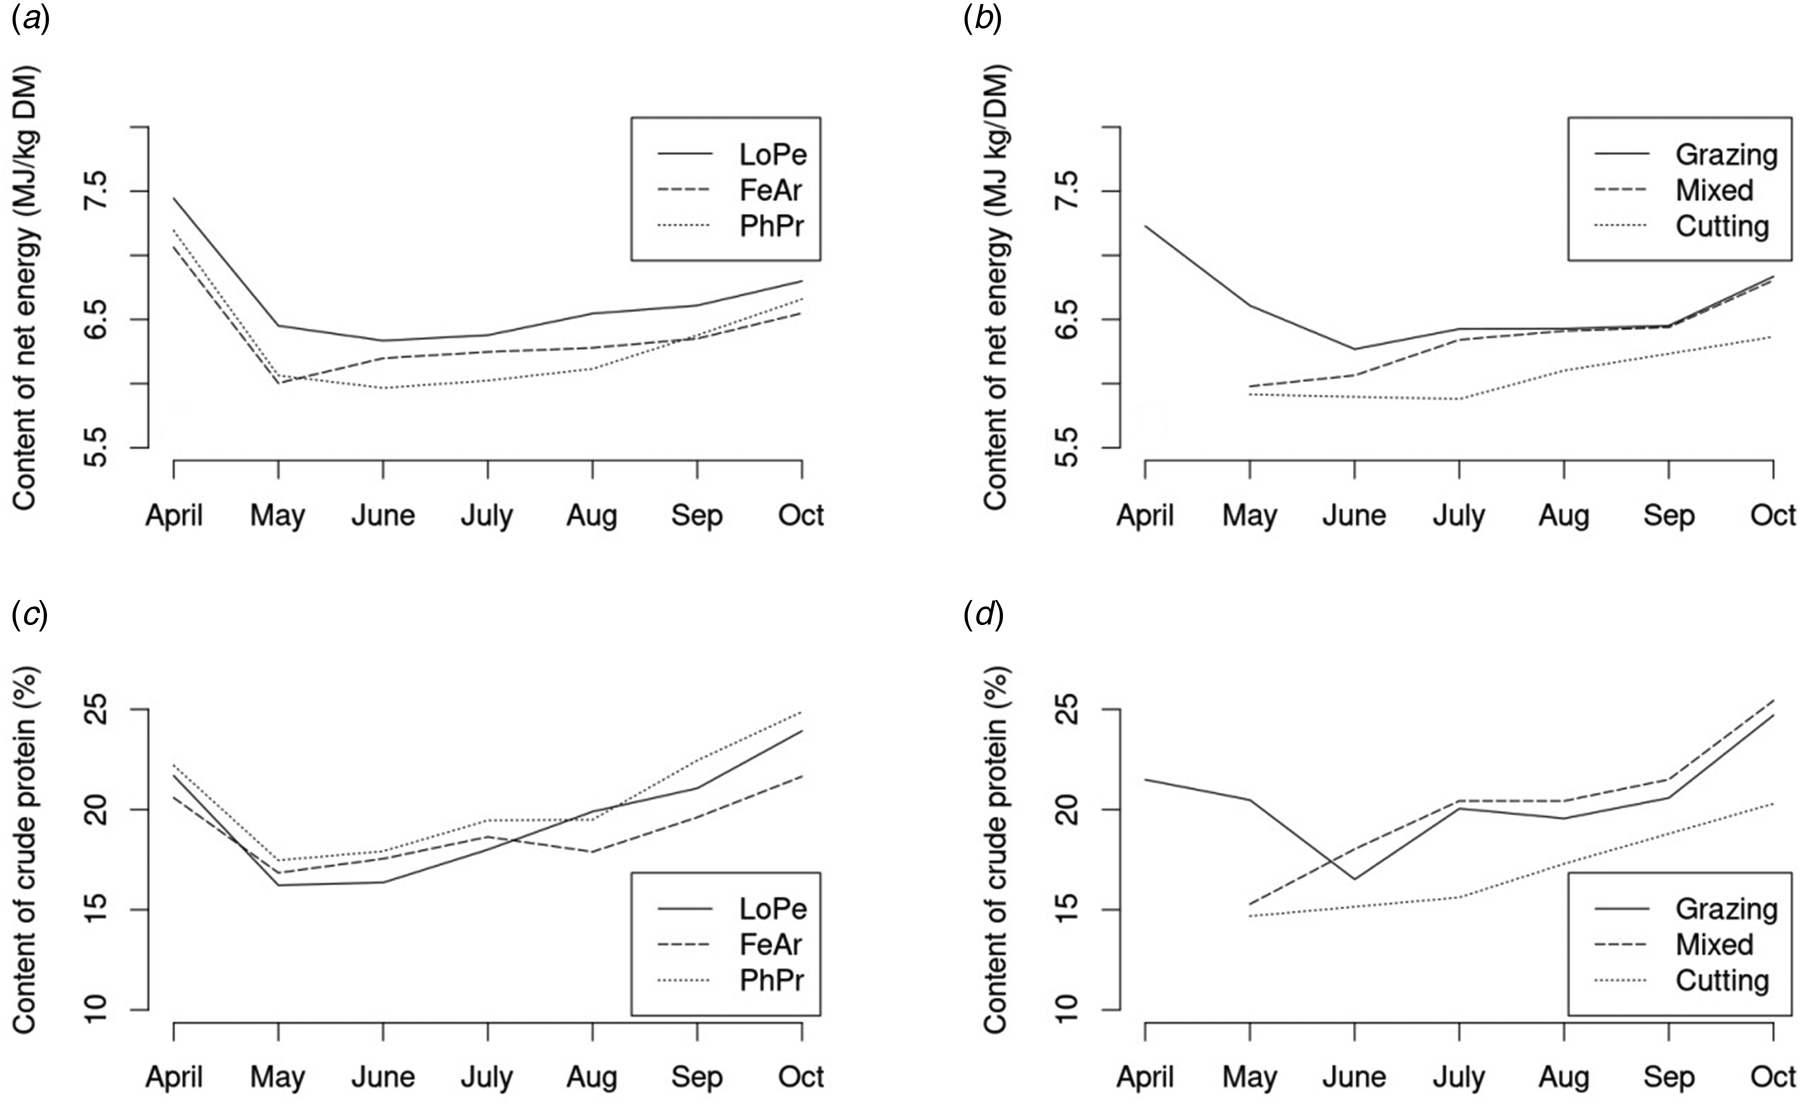
Figure 1. Changes of the content of net energy and crude protein content (CP) during the growing season. Left side, A, B: FeAr: Festuca arundinacea, LoPe: Lolium perenne and PhPr: Phleum pratense; averaged over years, sites and management. Right side, C, D: simulated grazing system (seven cuts), mixed system (six cuts) and cutting-only system (four cuts); averaged over years, sites and mixtures.
CP content did not differ between LoPe (17.7%) and FeAr (17.6%) (Table 3; Figure 1b). Although the content of CP for LoPe and FeAr vary in the literature, reports agree that generally differences in CP between LoPe and FeAr are small. Cougnon et al. (Reference Cougnon, Baert, Van Waes and Reheul2014) found a CP content of 12.7% and 12.5% for LoPe and FeAr, respectively. Lee et al. (Reference Lee, Clark, Clark, Waugh, Roach, Minneé, Glassey, Woodward, Woodfield and Chapman2018) report somewhat higher values of 23% for LoPe and 24% for FeAr, while the values found by Davies and Morgan (Reference Davies and Morgan1982) with 18.4% for LoPe and 18.3% for FeAr are very similar to the values in our study.
In our study we found the highest CP contents (18.7%) with the main species PhPr in mixture with PoPr and T. repens on the peat site. This is likely the combined effect of a higher level of CP in PhPr with a great proportion (49%) of invading and protein-rich HoLa. This finding is in line with studies of pure swards where PhPr also had the highest content of CP: Davies and Morgan (Reference Davies and Morgan1982) found 19% CP for PhPr; and Frame (Reference Frame1991) reported somewhat higher values of 23% CP for LoPe and of 29% for PhPr. We found the highest content of CP on the peat site in the swards where PhPr (20.4% CP) was sown as the main species. These are also the plots where HoLa as an invading species reached a mass proportion of 49% in the third year. It has been reported that the CP content of HoLa is higher than that of LoPe. Suckling (Reference Suckling1960) found a protein content of 18.8% for LoPe and 19.5% for HoLa. With a fertilization regime similar to our trial, Frame (Reference Frame1991) found for a CP content of 22.7% for LoPe and 25.7% for HoLa; Harrington et al. (Reference Harrington, Thatcher and Kemp2006) found a CP content of 23.2% for LoPe and values as high as 29.5% for HoLa.
Influence of management on net energy content and crude protein
In our experiments, the lowest content of net energy and CP were found in the cutting-only system (5.8–6.2 MJ/kg DM; 15.6–16.8% CP), while the simulated grazing system had the highest content of net energy (6.3–6.7 MJ/kg DM) and of CP (18.8–20.1%) (Fig. 1c, 1d; Table 4, Table 5).
Generally, frequent defoliations lead to a better feed quality but can also result in smaller DM yields (Frame and Hunt, Reference Frame and Hunt1971, Chestnutt et al., Reference Chestnutt, Murdoch, Harrington and Binnie1977; Pontes et al., Reference Pontes, Carrère, Andueza, Louault and Soussana2007; Donaghy et al., Reference Donaghy, Turner and Adamczewski2008). With more frequent defoliations, young plants which have a high digestibility and a high content of water-soluble constituents and of CP are utilized (Terry and Tilley, Reference Terry and Tilley1964; Minson et al., Reference Minson, Harris, Raymond and Milford1964). This would be an important consideration when thinking of FeAr as an alternative to LoPe. In the cutting-only system in our experiments only the mixtures based on LoPe had a content of net energy higher than 6.0 MJ/kg DM, which is considered necessary for the nutrition of dairy cows (Spiekers, Reference Spiekers2004). This is why LoPe remains so important not only for grazed pastures but also for grass silage. When cut only four times per year, the net energy of FeAr of on average 5.9 MJ/kg DM is below the value required for dairy cows (Fig. 2a). However, in the mixed system with five defoliations (6.1 MJ/kg DM) and in the grazing system with seven defoliations (6.4 MJ/kg DM) the net energy of FeAr can be considered high enough for the requirements of dairy cows. In addition, FeAr produced by far the largest total yields of net energy (82–93 GJ/ha), not only under grazing and the mixed system but also in the cutting-only system (Table 4). When using FeAr for nutrition of dairy cows, at least five defoliations would be recommended to ensure sufficiently high energy content. In our experiments, an early first defoliation in April led to a net energy content of >7 MJ/kg DM for all mixtures (Fig. 1a) with an acceptable CP content of 20%. This could be important for the utilization of FeAr in dairy farming (Pontes et al., Reference Pontes, Carrère, Andueza, Louault and Soussana2007). We found for the simulated grazing management scheme that, after an early defoliation in April, the net energy content of FeAr stayed at >6.3 MJ/kg DM for the whole growing season (Fig. 2a). During summer the number of defoliations could be reduced without a drop in energy content as shown by the mixed system in our experiments where net energy content was >6.3 MJ/kg DM from July onwards (Fig. 2a). The protein content of FeAr was lowest for the cutting-only system. The mixed system led to a strong increase of >5% in CP content of FeAr from the first defoliation in May to July and stayed as high as in the simulated grazing system for the whole growing season (Fig. 2b).

Figure 2. Changes of the content of net energy a) and crude protein content (CP) (b) of Festuca arundinacea during the growing season averaged over years and sites in the simulated grazing system (seven cuts), mixed system (six cuts) and the cutting-only system (four cuts).
Phleum pratense (PhPr) as the main species in our mixtures proved to be less persistent and mixtures had lower yields than those of LoPe and FeAr. The partial replacement of PhPr on peat soil by H. lanatus and on sand by P. pratensis needs to be considered when net energy content and CP for PhPr mixtures are assessed.
Influence of precipitation/climatic conditions
The spring and early summer of 2015 were characterized by mainly dry conditions (precipitation in that period was 30% less than the long-term average; Table 1). DM yields of LoPe mixtures were lowest in 2015 (10 858 kg/ha) but the difference to the DM yields in 2014 and 2016 was not significant. DM yields for FeAr mixtures were significantly larger in 2015 (13 826 kg/ha) than in 2014 (12 203 kg/ha), but smaller than in 2016 (15 401 kg/ha).
While periods of drought can have a negative effect on DM yields of productive grassland with high proportions of LoPe (Norris, Reference Norris1982; Cougnon et al., Reference Cougnon, Baert, Van Waes and Reheul2014), the effect on feed quality can generally be positive provided that the drought does not last too long. (Dumont et al., Reference Dumont, Andueza, Niderkorn, Lüscher, Porqueddu and Picon-Cochard2014). Accordingly, we found a higher net energy content for LoPe (6.7 MJ/kg DM) and PhPr (6.2 MJ/kg DM) in 2015. This is in accordance with other trials which also found a better feed quality under moderate water stress (Sheaffer et al., Reference Sheaffer, Peterson, Hall and Stordahl1992, Hoffstätter-Müncheberg et al., Reference Hoffstätter-Müncheberg, Merten, Kayser, Wrage-Mönnig and Isselstein2013, Küchenmeister et al., Reference Küchenmeister, Küchenmeister, Kayser, Wrage-Mönnig and Isselstein2013), as the stems, which are higher in crude fibre content, will grow more slowly (Buxton, Reference Buxton1996). However, FeAr responded differently with a decreasing quality under moderate water stress. In spring, FeAr shows a faster and earlier reproductive growth and this might have been accelerated by high temperatures that often come along with drier spells.
During late summer and autumn, when the precipitation was on average lower than in spring and early summer, FeAr still showed high growth rates, while the growth rates of LoPe and PhPr declined (Becker et al., Reference Becker, Isselstein, Jürschik, Benke and Kayser2020). However, on sites with a high water holding capacity like clay and under conditions of high precipitation or irrigation, LoPe will continue to be the most important species in grassland for dairy farming. LoPe has a high turnover of tillers throughout the year and thus the amount of young plant parts with a high feed quality is higher than in other species (Duchini et al., Reference Duchini, Guzatti, Echeverria, Américo and Sbrissia2018). Currently, in practice, F. arundinacea would only be used when the risk of using L. perenne proves to be too high, especially under more frequent drought periods. These are the conditions under which F. arundinacea needs to be tested and evaluated and not under the optimal conditions for L. perenne.
Conclusions
We found that in grassland systems with at least six defoliations and/or an early utilization, F. arundinacea represented an acceptable compromise between feed quality, persistence and DM yield. However, for dairy production based on intensive cutting-only systems the net energy content and CP concentration of F. arundinacea were not sufficient.
On peat land, where the pressure of invading H. lanatus is high, the introduction of more competitive species like F. arundinacea might be an alternative. However, we found that under conditions of frequent defoliations, H. lanatus-rich swards had comparatively good yields and a forage quality that would be acceptable for dairy cows. In fact, on peat land allowing for a certain amount of H. lanatus in combination with the use of competitive species might be an alternative to frequent sward renovations.
We conclude that there is potential to adapt the choice of grasses and mixtures in different production systems to the challenges of degraded swards on peat land and climate change.
Author's contributions
TB: Investigation, project administration, data analysis, writing – draft & editing. MK: Conceptualization, project administration, supervision, writing – review & editing. JI: Supervision, writing – review and editing.
Funding statement
The study was supported by the Ministry for Science and Culture of Lower Saxony (MWK) within the collaborative research project SAM, Analysis of Dairy Production: Grazing v. Indoor Housing of Dairy Cows, Support Code: ZN 2864.
We acknowledge support by the Open Access Publication Funds of the Göttingen University
Competing interests
None
Ethical standards
Not applicable.
Acknowledgements
We would like to acknowledge Barbara Hohlmann from the University of Göttingen for the laboratory work and Robert Klippert and Christian Thomsen from the Chamber of Agriculture in Lower Saxony for their assistance in the field.


 Open access