


Introduction
With an expanding world human population, the global demand for beef is expected to increase (FAO, 2021). Despite this, the beef industry in Europe and elsewhere faces many challenges. These include producing beef with enhanced nutritional value (Godfray et al., Reference Godfray, Aveyard, Garnett, Hall, Key, Lorimer, Pierrehumbert, Scarborough, Springmann and Jebb2018; Rivero et al., Reference Rivero, Evans, Berndt, Cartmill, Dowsey, Farruggia, Mignolet, Enriquez-Hidalgo, Chadwick, McCracken, Busch, Pereyra, Martin, Sanford, Sheridan, Wright, Brunet, Eisler, Lopez-Villalobos, Rovira, Harris, Murphy, Williams, Jackson, Machado, Suraj, Puech, Boland, Ayala and Lee2021), making a positive contribution to food security (Wilkinson, Reference Wilkinson2011; Mosnier et al., Reference Mosnier, Jarousse, Madrange, Balouzat, Guillier, Pirlo, Mertens, O'Riordan, Pahmeyer, Hennart, Legein, Crosson, Kearney, Dimon, Bertozzi, Reding, Iacurto, Breen, Carè and Veysset2021), optimizing efficiency in land use (Mosnier et al., Reference Mosnier, Jarousse, Madrange, Balouzat, Guillier, Pirlo, Mertens, O'Riordan, Pahmeyer, Hennart, Legein, Crosson, Kearney, Dimon, Bertozzi, Reding, Iacurto, Breen, Carè and Veysset2021), maximizing financial returns for the farmer (Taylor et al., Reference Taylor, McGee, Kelly, Grant and Crosson2018; Mosnier et al., Reference Mosnier, Jarousse, Madrange, Balouzat, Guillier, Pirlo, Mertens, O'Riordan, Pahmeyer, Hennart, Legein, Crosson, Kearney, Dimon, Bertozzi, Reding, Iacurto, Breen, Carè and Veysset2021), minimizing adverse environmental impacts and operating to the highest animal welfare standards (De Vries et al., Reference De Vries, Van Middelaar and De Boer2015; Rivero et al., Reference Rivero, Evans, Berndt, Cartmill, Dowsey, Farruggia, Mignolet, Enriquez-Hidalgo, Chadwick, McCracken, Busch, Pereyra, Martin, Sanford, Sheridan, Wright, Brunet, Eisler, Lopez-Villalobos, Rovira, Harris, Murphy, Williams, Jackson, Machado, Suraj, Puech, Boland, Ayala and Lee2021). Recently published farming-related environmental policies such as the ‘European Green Deal’ (EC, 2019) have increased the focus on these issues.
The aforementioned challenges are influenced by the beef production system operated by the farmer. The choice of beef production system is primarily determined by the availability and utilization of local feed resources. Globally, beef ‘cow–calf’ systems remain predominantly forage-based, as grass-forage, in most cases, is the cheapest feed resource (Greenwood, Reference Greenwood2021). However, post-weaning there is more significant variation in the type of feed resource offered (Greenwood, Reference Greenwood2021), with ‘growing-finishing’ diets ranging from high-concentrate to forage plus concentrate to forage-only (Thomas et al., Reference Thomas, Beletse, Dominik and Lehnert2021; Klopatek et al., Reference Klopatek, Marvinney, Duarte, Kendall, Yang and Oltjen2022; McGee et al., Reference McGee, Lenehan, Crosson, O'Riordan, Kelly, Moran and Moloney2022). In most countries, beef cattle in forage-based systems do receive concentrate supplementation during the ‘finishing phase’ (Greenwood, Reference Greenwood2021; Mosnier et al., Reference Mosnier, Jarousse, Madrange, Balouzat, Guillier, Pirlo, Mertens, O'Riordan, Pahmeyer, Hennart, Legein, Crosson, Kearney, Dimon, Bertozzi, Reding, Iacurto, Breen, Carè and Veysset2021). For example, in temperate climatic regions such as Ireland, recommended grass-based production systems focus on producing spring-born suckler-bred steers at 24 months of age with moderate concentrate supplementation levels (ca. 0.4–0.5 dietary dry matter intake) offered with grass silage during the indoor finishing phase (Drennan and McGee, Reference Drennan and McGee2009a; Teagasc, 2020a). However, compared to concentrate-fed beef, forage-only beef has received increasing attention (Rivero et al., Reference Rivero, Evans, Berndt, Cartmill, Dowsey, Farruggia, Mignolet, Enriquez-Hidalgo, Chadwick, McCracken, Busch, Pereyra, Martin, Sanford, Sheridan, Wright, Brunet, Eisler, Lopez-Villalobos, Rovira, Harris, Murphy, Williams, Jackson, Machado, Suraj, Puech, Boland, Ayala and Lee2021), as it is perceived by the consumer to be more environmentally sustainable, healthier and more animal welfare friendly (Stampa et al., Reference Stampa, Schipmann-Schwarze and Hamm2020). Removing concentrates from the animal's diet of such systems reduces dietary energy intake, carcass gain and carcass fat deposition (Doyle et al., Reference Doyle, McGee, Moloney, Kelly and O'Riordan2021, Reference Doyle, McGee, Moloney, Kelly and O'Riordan2022), and results in ‘forage-only’ systems having a comparatively longer production cycle (four months older at slaughter – 28 months) to achieve a similar carcass weight and fat score (Regan et al., Reference Regan, McGee, Moloney, Kelly and O'Riordan2018).
A multifaceted, holistic approach is required to evaluate forage-only and concentrate-beef production systems encompassing animal production, consumer product ‘quality’ characteristics, food security, land-use and financial and environmental sustainability metrics; however, solutions to these often-conflicting challenges are complex, and trade-offs between different metrics are likely when comparing diverse beef systems and this requires quantification (Kearney et al., Reference Kearney, O'Riordan, McGee, Breen and Crosson2022; McGee et al., Reference McGee, Lenehan, Crosson, O'Riordan, Kelly, Moran and Moloney2022). Additionally, the ‘outcomes’ are likely regional-specific (Rivero et al., Reference Rivero, Evans, Berndt, Cartmill, Dowsey, Farruggia, Mignolet, Enriquez-Hidalgo, Chadwick, McCracken, Busch, Pereyra, Martin, Sanford, Sheridan, Wright, Brunet, Eisler, Lopez-Villalobos, Rovira, Harris, Murphy, Williams, Jackson, Machado, Suraj, Puech, Boland, Ayala and Lee2021). Most studies to date have not calculated greenhouse gas (GHG) emissions from different beef production systems in relation to the nutritional value of meat produced, i.e. protein, amino acid, fatty acid and mineral plus vitamin concentrations (McAuliffe et al., Reference McAuliffe, Takahashi and Lee2018), especially based on actual ‘measured’ nutrient composition. This is a critical endpoint that may influence outcomes, as consumers become increasingly aware of sourcing food that is both ‘nutritionally rich’ with low adverse effects on the environment. Furthermore, the effect of forage or concentrate beef systems on altering the quality of protein produced in the meat (i.e. essential amino acids) has not being evaluated in previous studies and requires investigation.
It is reported that beef systems can contribute more to food security by reducing the quantity of human edible feed (i.e. concentrates) fed to beef cattle (Thomas et al., Reference Thomas, Beletse, Dominik and Lehnert2021; McGee et al., Reference McGee, Lenehan, Crosson, O'Riordan, Kelly, Moran and Moloney2022). Expressing GHG emissions per kg of meat weight gain is an important environmental metric, but it only considers GHG emissions relative to gross human edible food produced and does not consider the ‘net production’ of human edible food, i.e. food–feed competition. Expressing GHG emissions per kg of net human edible food produced can help to identify beef production systems that improve food security whilst simultaneously addressing environmental impacts.
Within this context, the objective of this multifaceted study was to evaluate the effect of three weanling-to-beef steer production systems on contrasting diets (high-concentrate, grass silage plus concentrates and grass-forage-only) in terms of animal performance, carcass traits, meat nutritional value (concentrations of amino acids, fatty acids and minerals plus vitamins), food–feed competition, pasture land-use, farm-level economics and GHG emissions.
Materials and methods
This study was conducted at Teagasc, Grange Research Centre, Ireland (longitude 6°40'W; latitude 53°30’N; elevation 92 m above sea level). All animal procedures were approved by the Teagasc Animal Ethics Committee and were conducted in accordance with the European Communities Regulation 2002 and 2005, project authorization number AE19132/P096.
Animals and experimental design
Fifty-four spring-born, late-maturing crossbred (Limousin and Charolais sired) recently weaned bulls (333 ± 36.7 kg) from late-maturing suckler crossbred dams were sourced from commercial farms in Ireland and transferred to Grange Research Centre in mid-October at 8 months of age. Two weeks post-arrival, animals were castrated by a veterinarian using a ‘burdizzo’. Prior to housing for the ‘first’ indoor winter period (21 November), steers were weighed on two consecutive days and within sire breed were blocked by individual live-weight, resulting in 18 blocks (12 blocks of Limousin and 6 blocks of Charolais steers) of three animals. Within block, steers were randomly assigned to one of three production systems (Fig. 1): (1) grass silage + 1.2 kg concentrate DM (148 days), followed by pasture (123 days) and finished on ad libitum concentrates (120 days) – slaughter age, 21 months (GRAIN); (2) grass silage + 1.2 kg concentrate DM (148 days), followed by pasture (196 days) and finished on grass silage ad libitum + 3.5 kg concentrate DM (124 days) – slaughter age, 24 months (SIL + GRAIN); and (3) grass silage-only (148 days), pasture (196 days), grass silage-only (140 days) and finished on pasture (97 days) – slaughter age, 28 months (FORAGE). The target mean carcass weight for each production system was 390 kg. Slaughter date was based on the mean production system live-weight and an assumed kill-out proportion to achieve the target carcass weight. Kill-out proportions were estimated to be 590, 580 and 570 g/kg for GRAIN, SIL + GRAIN and FORAGE, respectively, based on previous studies with animals of similar breed, age, sex and diet (Regan et al., Reference Regan, McGee, Moloney, Kelly and O'Riordan2018; Doyle et al., Reference Doyle, McGee, Moloney, Kelly and O'Riordan2021, Reference Doyle, McGee, Moloney, Kelly and O'Riordan2022).

Figure 1. The effect of suckler weanling-to-beef production systems (![]() grain;
grain; ![]() silage + grain and
silage + grain and ![]() forage) on the growth pattern (live-weight, kg) of steers, where green = pasture, black = silage-only, orange = silage + concentrates, red = concentrates ad libitum.
forage) on the growth pattern (live-weight, kg) of steers, where green = pasture, black = silage-only, orange = silage + concentrates, red = concentrates ad libitum.
Animal management and feeding
During the indoor periods, steers were accommodated in a concrete slatted floor shed and penned in three replicated groups of six per production system (2.2 and 2.7 m2 per animal during the ‘first’ and ‘second’ indoor feeding period, respectively). Grass silage was offered ad libitum (proportionately 0.1 in excess of daily intake) on a pen basis during the first indoor winter (weanlings), and on an individual animal basis (Calan gates; American Calan Inc., Northwood, NH, USA) during the second indoor period, and intakes measured as described by Doyle et al. (Reference Doyle, McGee, Moloney, Kelly and O'Riordan2021). The concentrate (coarse mixture – 862 g/kg fresh weight rolled barley, 60 g/kg soyabean meal, 50 g/kg molasses and 28 g/kg minerals and vitamins) supplement, where fed, was offered once each morning and the amount offered was progressively increased until the desired allocation was achieved (10 and 21 days for SIL + GRAIN and GRAIN, respectively). Concentrate refusals were recorded daily for animals offered ad libitum concentrates, and they were assumed to be fully consumed by those offered <4 kg concentrate/day; SIL + GRAIN. Concentrate feeding levels of 1.2 and 3.5 kg DM/animal/day for the first and second indoor winter, respectively, were calculated based on silage quality and predicted silage DM intake, to achieve recommended steer average daily gains (ADGs) of 0.5 and 1.0 kg/day, respectively. Animals on silage-only received 30 and 107 g/day of general-purpose mineral-vitamin supplement (calcium 25.0%, sodium 12.4%, vitamin A 500 000 IU/kg, D3 100 000 IU/kg, E 1500 mg/kg, B12 750 mg/kg and B1 250 mg/kg) on top of the silage (equivalent quantity to that offered in the concentrates) over the first and second indoor feeding period, respectively. The grass silage offered was from a predominantly perennial ryegrass (Lolium perenne) sward, cut using a rotary mower, wilted for 24 h, precision-chopped and ensiled without an additive in a bunker silo.
At pasture, steers rotationally grazed perennial ryegrass swards in three replicate groups of six animals per production system. Pre-grazing herbage mass and post-grazing sward height were measured as described by Doyle et al. (Reference Doyle, McGee, Moloney, Kelly and O'Riordan2021). Pre-grazing herbage mass and post-grazing sward height were 2083 kg DM/ha and 4.3 cm, respectively, during the ‘second’ grazing season (days 149–272 for GRAIN and days 149–344 for SIL + GRAIN and FORAGE) and 2088 kg DM/ha and 5.1 cm, respectively, during the ‘third’ grazing season (days 484–581 for FORAGE).
Animal live-weight and ADG were measured as described by Doyle et al. (Reference Doyle, McGee, Moloney, Kelly and O'Riordan2021). Animals were ultrasonically scanned at turnout to pasture, housing and pre-slaughter using an automatic real-time scanner (model – ECM ExaGo Veterinary scanner, with a 3.5 MHz linear transducer, IMV imaging, Meath, Ireland) to determine M. longissimus and back fat depth (Doyle et al., Reference Doyle, McGee, Moloney, Kelly and O'Riordan2021).
Post-slaughter carcass measurements and sampling
On the morning of slaughter, animals were weighed, transported approximately 30 km to a commercial abattoir (Kepak, Clonee, Co. Meath, Ireland) and slaughtered immediately by captive bolt stunning. Carcasses were graded mechanically for conformation and fat score on a 15-point scale according to the EU beef carcass classification system as described by Conroy et al. (Reference Conroy, Drennan, McGee, Keane, Kenny and Berry2010). Cold carcass weight was assumed to be 0.98 of hot carcass weight. Kill-out proportion was calculated as cold carcass weight expressed as a proportion of pre-slaughter live-weight. Approximately 45 min after slaughter, carcasses were placed in a chill set at 8 °C and gradually reduced to 0 °C over approximately 12 h.
At 48 h post-mortem, subcutaneous fat colour was recorded (Mezgebo et al., Reference Mezgebo, Monahan, McGee, O'Riordan, Marren, Listrat, Picard, Richardson and Moloney2019). The M. Longissimus lumborum muscle was excised from the 10th/11th rib interface and deboned. The muscle was vacuum-packed, transported to Teagasc Food Research Centre (Ashtown, Dublin), and stored at 2 °C. After an additional 19 days, external fat was removed, and the muscle was cut into individual steaks (thickness 25 mm). The first steak was used for meat colour determination (Mezgebo et al., Reference Mezgebo, Monahan, McGee, O'Riordan, Marren, Listrat, Picard, Richardson and Moloney2019) after blooming at room temperature for 1 h. Reflectance spectra were recorded and used to estimate haem pigment proportions according to Krzywicki (Reference Krzywicki1979). The remaining steaks were vacuum packed and stored at −20 °C.
Chemical analysis and proximate composition of feeds and meat
Representative samples of feeds (grazed herbage during the ‘second’ and ‘third’ grazing season, and grass silage and concentrates during the first and second indoor feeding periods) were obtained, dried, ground and composited every month and chemically analysed as reported by Doyle et al. (Reference Doyle, McGee, Moloney, Kelly and O'Riordan2021). The concentration of minerals in dried feedstuffs and dried (100 °C) Longissimus lumborum muscle (calcium, copper, lead, manganese, cobalt and molybdenum) were determined by inductively coupled plasma-optical emission spectrometer and inductively coupled plasma mass spectrometry (ICP-MS) in a commercial laboratory (Southern Scientific Ireland, Farranfore, Kerry, Ireland) following acid digestion (Kalra, Reference Kalra1998). The remaining mineral concentrations (phosphorus, potassium, magnesium, sodium, iron, zinc and selenium) in the Longissimus lumborum were analysed in duplicate using an Agilent 7900 ICP-MS (Agilent technologies, Santa Clara, CA, USA). The vitamin E (α-tocopherol) concentration in the feedstuffs and thawed Longissimus lumborum muscle was determined in duplicate in a commercial laboratory by high-performance liquid chromatography with fluorescence detection (ALSolutions, Prague 9, Vysocany, Czech Republic).
For the remainder of the chemical analysis, steaks were thawed and homogenized using a Robot coupe blender (R301 Ultra, Robot Coupe SA, Vincennes, France). The fatty acid analysis was carried out in duplicate using gas chromatography at a split ratio of 100:1, as described by Moloney et al. (Reference Moloney, O'Riordan, McGee, Carberry, Moran, McMenamin and Monahan2021). The atherogenicity and thrombogenic index were calculated as described by Ulbricht and Southgate (Reference Ulbricht and Southgate1991). The fatty acid composition of the composited milled feedstuffs was determined using the same approach as above, except a 5:1 split ratio was used during injection. Cholesterol extraction and analysis of the muscle was carried out in duplicate as described by Grasso et al. (Reference Grasso, Brunton, Monahan and Harrison2016), except an Agilent 7890B Series gas chromatograph (Agilent Technologies) was used with an injection volume of 0.2 μl. The amino acid concentration of the muscle was analysed as described by McDermott et al. (Reference McDermott, Visentin, De Marchi, Berry, Fenelon, O'Connor, Kenny and McParland2016). The meat was hydrolysed with 6 nitrogen hydrochloric acid at 110 °C for 23 h using a Glas-Col combo mantle (Glas-Col, Terre Haute, USA) for the determination of all amino acids except sulphur amino acids and tryptophan. Methionine and cysteine were oxidized with performic acid to methionine sulphone and cysteic acid, respectively, and then hydrolysed with hydrochloric acid. The resulting hydrolysates were then diluted one in two with the internal standard norleucine to give a final concentration of 125 nm/ml and analysed on an amino acid analyser, as described in McDermott et al. (Reference McDermott, Visentin, De Marchi, Berry, Fenelon, O'Connor, Kenny and McParland2016). Muscle crude protein concentration was determined in duplicate using a LECO FP328 (LECO Corporation, Joseph, MI, USA) protein analyser as described in Mezgebo et al. (Reference Mezgebo, Moloney, O'Riordan, McGee, Richardson and Monahan2017).
Meat nutrient index
There are different types of nutrient indices to evaluate food groups (Saarinen et al., Reference Saarinen, Fogelholm, Tahvonen and Kurppa2017). A nutrient index provides a single value to summarize the nutritional value of the food product against the recommended daily intake (RDI) of those nutrients. The nutrient indices used in this study were calculated based on a 100 g serving of raw meat (typical serving size), whereby the quantity of a specific nutrient in a 100 g serving is expressed relative to the RDI ([nutrient content in a 100 g beef serving/RDI] × 100). RDI is based on data from FSAI (2020), EFSA (2010) and McAuliffe et al. (Reference McAuliffe, Takahashi and Lee2018). The UKNIprot7-2 index used in this paper was initially developed by Saarinen et al. (Reference Saarinen, Fogelholm, Tahvonen and Kurppa2017) for protein-rich food and modified by McAuliffe et al. (Reference McAuliffe, Takahashi and Lee2018) to compare the nutrient value of beef from different beef production systems. The UKNIprot7-2 index includes seven beneficial nutrients (protein, mono-unsaturated fatty acids, eicosapentaenoic acid [EPA] + docosahexaenoic acid [DHA], calcium, iron, riboflavin and folate) minus the two harmful (saturated fatty acids and sodium) nutrients. The UKNIprot10-2 index is the same equation but includes three further beneficial nutrients (vitamin B12, selenium and zinc). No measured data were available for riboflavin, folate and vitamin B12, so reference values for average beef cuts from McCance and Widdowson (Reference McCance and Widdowson2014) was used, and the nutrient content was assumed to be similar across all production systems.
The UKNIprot10-2 and 7-2 indices do not consider many minerals, thus, separately, mineral concentrations in a 100 g meat serving were expressed against mineral RDI (FSAI, 2020) to evaluate the contribution of meat from different production systems to meet human nutrient mineral requirements.
Modelled farm systems economic, food–feed competition and GHG emissions analysis
Farm systems economics and GHG emissions analysis were modelled using the Grange Beef Systems Model (Crosson et al., Reference Crosson, O'Kiely, O'Mara and Wallace2006) in a similar manner to that described by McGee et al. (Reference McGee, Lenehan, Crosson, O'Riordan, Kelly, Moran and Moloney2022). The model was parameterized using the biological and animal production data from the current production systems experiment, which included live-weight and ADG, silage and concentrate intake, carcass performance, days at pasture or indoors, feed ingredient and chemical composition of the concentrate offered, and meat crude protein concentration. Daily pasture intake was predicted based on energy demand for maintenance, activity and live-weight performance according to the Grange Beef Systems Model (Taylor et al., Reference Taylor, McGee, Kelly and Crosson2020). Prediction equations generated by Conroy et al. (Reference Conroy, Drennan, McGee, Keane, Kenny and Berry2010), based on carcass conformation and fat score, were used to estimate carcass meat yield.
The production system modelled was a weanling-to-beef system and in each scenario the production system began with the purchase of 200 weanlings (9 months old) on 1 December and this was assumed to be the start of the ‘first’ winter, and the scenario ended when the animals were slaughtered. The model did not consider the suckler cow–calf phase of the system. Given the differences in herbage demand associated with the three production systems, total pasture land area and stocking rate (defined as livestock units per pasture hectare farmed) varied between scenarios. Beef steers aged between 0 and 12 months of age were classified as 0.3 livestock units, steers aged between 12 and 23 months of age were classified as 0.7 livestock units and steers aged between 24 and 35 months of age were classified as 1.0 livestock unit. The farm area owned was assumed to be 36.7 ha of pasture, which is the average farm size for cattle finishing enterprises in Ireland (Dillon et al., Reference Dillon, Donnellan, Moran and Lennon2022) and a land charge was applied as appropriate to any additional land required. Concentrates were assumed to be purchased and thus no land area was assigned for the concentrates fed. Inorganic fertilizer nitrogen (calcium ammonium nitrate) application to the whole pasture area was 178 kg N/ha, and corresponding pasture herbage utilized was assumed to be 9.9 tonnes DM/ha. First-harvest silage was assumed to be harvested on 27 May, with second-harvest silage harvested on 15 July. Financial performance data such as livestock revenues, variable (fertilizer, lime, reseeding, silage production, concentrates, machinery hire, veterinary and medicines, and land rental) and fixed (machinery operation, depreciation, car, telephone, electricity and interest) costs of production, and farm net margin, were based on market prices prevailing at the time of the analysis (November 2022, footnote Table 6). Beef carcass price was adjusted according to the carcass conformation score for each respective production system. The model assumes that the farm is family owned and thus labour is assumed to be freely available. European Union farm support payments were not included. A sensitivity analysis was conducted to account for the volatility associated with changes in concentrate, fertilizer and beef carcass price.
To evaluate the contribution of each production system to food protein and energy security, i.e. human food fed to the animals v. human food produced by the animals, the approach described by Mosnier et al. (Reference Mosnier, Jarousse, Madrange, Balouzat, Guillier, Pirlo, Mertens, O'Riordan, Pahmeyer, Hennart, Legein, Crosson, Kearney, Dimon, Bertozzi, Reding, Iacurto, Breen, Carè and Veysset2021) was used. Again this was evaluated within a ‘weanling-to-beef system’ context. From the analysis of Mosnier et al. (Reference Mosnier, Jarousse, Madrange, Balouzat, Guillier, Pirlo, Mertens, O'Riordan, Pahmeyer, Hennart, Legein, Crosson, Kearney, Dimon, Bertozzi, Reding, Iacurto, Breen, Carè and Veysset2021), 1 kg of bovine carcass was assumed to comprise 10.9 mega joules (MJ) of gross energy. The crude protein content in 1 kg of bovine carcass was calculated to be 160 g in this study, and was similar to the concentration assumed in Mosnier et al. (Reference Mosnier, Jarousse, Madrange, Balouzat, Guillier, Pirlo, Mertens, O'Riordan, Pahmeyer, Hennart, Legein, Crosson, Kearney, Dimon, Bertozzi, Reding, Iacurto, Breen, Carè and Veysset2021) (158 g crude protein/kg carcass). This calculation was based on measured crude protein content in the meat (238, 229 and 237 g/kg for GRAIN, SIL + GRAIN and FORAGE, respectively) in the current study, and adjusted for carcass weight using the equation outlined in Conroy et al. (Reference Conroy, Drennan, McGee, Keane, Kenny and Berry2010) (meat proportion [g/kg carcass weight] = 698 + 11.82 [carcass conformation score, scale 1–15] – 9.56 [carcass fat score, scale 1–15]). The share of human edible food protein and energy for each of the ingredients in the concentrate fed to the animals was calculated (Mosnier et al., Reference Mosnier, Jarousse, Madrange, Balouzat, Guillier, Pirlo, Mertens, O'Riordan, Pahmeyer, Hennart, Legein, Crosson, Kearney, Dimon, Bertozzi, Reding, Iacurto, Breen, Carè and Veysset2021). The ratio of human edible food protein and energy produced (i.e. meat) to human edible food protein and energy fed to the animals (i.e. concentrate) was quantified. An efficiency greater than one meant that the system produced more human edible food protein or energy, than consumed. Conversely, an efficiency between zero and one meant that the system produced less human edible food protein or energy, than consumed.
The BEEF systems Greenhouse gas Emissions Model (BEEFGEM) (Foley et al., Reference Foley, Crosson, Lovett, Boland, O'Mara and Kenny2011) was used to estimate GHG emissions based on emission factors obtained from studies in the scientific literature where the conditions were closest to those that prevail for Irish beef production systems or, where such information was not available, from the Intergovernmental Panel on Climate Change (IPCC, Reference Calvo, Tanabe, Kranjc, Baasansuren, Fukuda, Ngarize, Osako, Pyrozhenko, Shermanau and Federici2019) (details on emission factors used and sources are provided in Supplementary Table 1). On-farm emissions included enteric fermentation, inorganic fertilizer application, deposition of excreta at pasture from grazing animals, on-farm fuel use and animal slurry and silage effluent storage and application. Emissions generated off-farm from the manufacture of purchased concentrate feed, inorganic fertilizer, diesel and electricity, in addition to nitrous oxide emissions resulting from nitrate leaching and ammonia volatilization, were also included. Emissions of GHG produced after cattle left the farm for slaughter (e.g. associated with transport to and during slaughter at the abattoir, distribution, marketing and retail) and those associated with the construction and use of farm buildings and machinery were omitted from the analysis as the study presumed that there were no differences between these across production system. As the evaluated production systems represented a distinct purchased weanling-to-beef system, the cow–calf phase was excluded from the analysis (McGee et al., Reference McGee, Lenehan, Crosson, O'Riordan, Kelly, Moran and Moloney2022). Land use for all scenarios was assumed to be permanent pasture, and therefore no changes in soil carbon were assumed. One hundred-year global warming potential CO2 equivalents (CO2eq) were calculated from GHG emissions. The global warming potential values used for methane and nitrous oxide were 28 and 265 CO2eq, respectively (Myhre et al., Reference Myhre, Shindell, Bréon, Collins, Fuglestvedt, Huang, Koch, Lamarque, Lee, Mendoza, Nakajima, Robock, Stephens, Takemura, Zhang, Stocker, Qin, Plattner, Tignor, Allen, Boschung, Nauels, Xia, Bex and Midgley2013) as these are the most recent values recommended by the IPCC. GHG emissions were expressed per animal, per kg live-, carcass-, meat-, gross edible protein- and essential amino acids-weight gain, and per net production of human edible food protein, per meat nutrient index (UKNIprot 7-2) (GHG emissions associated with achieving 100% recommended daily nutrient intake) and per hectare of pasture land area. GHG emissions per essential amino acids weight gain was calculated by (GHG emissions per meat weight gain ÷ meat essential amino acid concentration [kg]). GHG emissions per gross edible protein gain was calculated by (GHG emissions per meat weight gain ÷ meat crude protein concentration [kg]), and thus does not consider the quantity of human edible protein offered to animals via concentrates. Lastly, GHG emissions per meat nutrient index UKNIprot7-2 (meat nutritional value) was obtained by calculating the amount of meat (kg) required to achieve 100% RDI (UKNIprot7-2 nutrient index value ÷ 10) and this value was used in the following equation (GHG per meat weight gain ÷ meat required to achieve 100% RDI).
Statistical analysis
Analysis of variance using the MIXED procedure of statistical analysis software was used to compare animal production, carcass and ‘meat quality’ data across production systems, where individual animal was considered the experimental unit. The model contained production system and block as fixed effects and differences between means were tested for significance using the PDIFF statement. Data were considered statistically significant when P < 0.05 and considered a tendency towards statistical significance when P < 0.10.
Results
Feed composition
The chemical composition including fatty acids, mineral and vitamin concentration and in vitro digestibility of the feedstuffs used is outlined in Table 1. Grass silage DMD was 0.739 and 0.757 during the first and second indoor feeding period, respectively. Compared to grazed pasture and grass silage, concentrates had a higher proportion of saturated, mono-unsaturated and omega-6 (n-6) poly-unsaturated fatty acid and a lower proportion of total poly-unsaturated and omega-3 (n-3) poly-unsaturated fatty acids. The major fatty acid in concentrates was C 18:2 n-6 (linoleic acid) (n-6 pre-cursor) and in forage was C 18:3 n-3 (α-linolenic acid) (n-3 pre-cursor).
Table 1. Chemical composition (mean [standard deviation]) of the experimental feedstuffs

NCGD, neutral cellulase gammanase digestibility; NDF, neutral detergent fibre; ADF, acid detergent fibre; oil B, acid hydrolysis ether extract; EPA, eicosapentaenoic acid; DHA, docosahexaenoic acid; SFA, saturated fatty acids; MUFA, mono-unsaturated fatty acids; PUFA, poly-unsaturated fatty acids.
a Feedstuff collected during the first and second indoor period (same concentrate and similar grass silage quality for both periods).
b Grazed grass during the ‘second’ and ‘third’ grazing season.
Intake, growth and carcass traits
Measured grass silage intake during the first feeding period was 4.4, 4.6 and 4.8 kg DM/head/day for GRAIN, SIL + GRAIN and FORAGE, respectively. Estimated daily pasture intake during the second grazing season was 7.7, 8.0 and 8.0 kg DM/head, respectively. Corresponding measured grass silage intake during the second indoor feeding period was 1.7, 6.4 and 7.8 kg DM/head/day. The estimated daily pasture intake for FORAGE during the third grazing season was 9.3 kg DM/head. Measured concentrate intake offered ad libitum for GRAIN was 8.7 kg DM/head/day. Measured lifetime concentrate intake was 1187, 606 and 0 kg DM/head for GRAIN, SIL + GRAIN and FORAGE, respectively.
The growth pattern of the steers in each system is illustrated in Fig. 1. At the end of the first indoor feeding period, SIL + GRAIN and GRAIN were heavier than FORAGE (+33 kg; P = 0.0491), and these live-weight differences were retained at pasture until the GRAIN group were housed in August (P = 0.018). At the end of the grazing season for SIL + GRAIN and FORAGE in October, live-weight was heaviest (P < 0.001) for GRAIN (617 kg), and SIL + GRAIN (558 kg) tended to be heavier (P = 0.091) than FORAGE (532 kg). At the end of the second indoor feeding period, SIL + GRAIN (675 kg) was heavier (P < 0.001) than FORAGE (598 kg) (GRAIN having been slaughtered by this stage). By design, carcass weight did not differ between production systems (Table 2). Estimated kill-out proportions were similar to actual kill-out proportion (within 10 g/kg).
Table 2. Average daily gain (ADG), carcass traits, adipose tissue colour and muscle colour of suckler bred steers on different weanling-to-beef production systems (grain = finished on ad libitum concentrates at 21 months of age; silage + grain = finished on grass silage plus 3.5 kg concentrate dry matter at 24 months of age; and forage = finished at pasture [forage-only] at 28 months of age)

S.E.M., standard error of the mean.
a Measured from the start of the first indoor feeding period to slaughter.
b Ultrasonic measurement pre-slaughter.
Average daily gain from the start of the first indoor feeding period to slaughter was greater for GRAIN than SIL + GRAIN, which in turn was greater than FORAGE (Table 2; P < 0.001). Consequently, age at slaughter was lower for GRAIN than SIL + GRAIN, which in turn was lower than FORAGE (P < 0.001). The duration of the final ‘finishing’ phase was 120, 124 and 97 days, having started in mid-August, early November and late March for GRAIN, SIL + GRAIN and FORAGE, respectively. Carcass conformation score was greater for GRAIN than both SIL + GRAIN and FORAGE, which did not differ (P = 0.018). Carcass fat score did not differ between systems. Ultrasonic fat depth at the point of slaughter was greater (P < 0.001) for GRAIN than both SIL + GRAIN and FORAGE, which did not differ (Supplementary Fig. 1). SIL + GRAIN and FORAGE had greater fat yellowness (b*) than GRAIN (P < 0.001), and muscle redness (a*) was greatest for SIL + GRAIN than both GRAIN and FORAGE, which did not differ (P = 0.004). Oxymyoglobin and myoglobin proportion was greater (P < 0.001) and lower (P < 0.001), respectively, for SIL + GRAIN than both GRAIN and FORAGE (Supplementary Table 2).
Meat nutrient composition and nutrient index
The main meat fatty acid concentrations are outlined in Table 3 and the remaining individual meat fatty acid concentrations are outlined in Supplementary Table 3. Total fatty acid concentrations did not differ between production systems (Table 3). FORAGE had greater concentrations of conjugated linoleic acid (CLA; C 18:2 c9, t11 [main isomer]) (P = 0.020) than GRAIN, but similar to SIL + GRAIN, and had greater concentrations of C 18:3 n-3 (P < 0.001), EPA (P < 0.001), DHA (P < 0.001), n-3 poly-unsaturated fatty acids (P < 0.001) and poly-unsaturated fatty acid: saturated fatty acid (P = 0.009) than both GRAIN and SIL + GRAIN. The concentrations of C 18:2 n-6 (P = 0.002), n-6 poly-unsaturated fatty acid (P = 0.014) and n-6: n-3 poly-unsaturated fatty acid (P < 0.001) were lower for FORAGE than GRAIN. The concentration of cholesterol was greater for FORAGE than SIL + GRAIN, but similar to GRAIN (Table 3).
Table 3. Fatty acid, cholesterol (g/kg meat), vitamin and mineral (mg/kg meat) concentration of the longissimus lumborum muscle from suckler bred steers on different production systems (grain = finished on ad libitum concentrates at 21 months of age; silage + grain = finished on grass silage plus 3.5 kg concentrate dry matter at 24 months of age; and forage = finished at pasture [forage-only] at 28 months of age)

CLA, conjugated linoleic acid; EPA, eicosapentaenoic acid; DHA, docosahexaenoic acid; SFA, saturated fatty acids; MUFA, mono-unsaturated fatty acids; PUFA, poly-unsaturated fatty acids; S.E.M., standard error of the mean.
a Individual fatty acid concentrations are outlined in Supplementary Table 3.
b Nutrient index is detailed in Supplementary Table 5.
Calcium, potassium, iron, zinc and lead meat concentrations did not differ between GRAIN and FORAGE (Table 3). Compared to GRAIN, FORAGE had a lower phosphorus (P < 0.001), magnesium (P = 0.006), sodium (P = 0.007), manganese (P < 0.001) and copper (P < 0.001) but greater vitamin E (P = 0.007) and selenium (P < 0.001) concentrations.
Molybdenum and cobalt concentrations were below the level of detection (<0.125 mg/kg). When mineral concentration in a 100 g meat serving is expressed against mineral RDI, treatments did not differ between production systems, with the exception of selenium which was greater for FORAGE (Supplementary Table 4).
Meat crude protein concentration was lower (P = 0.004) for SIL + GRAIN than both FORAGE and GRAIN which did not differ. Individual meat amino acid concentration did not differ between production systems (Table 4).
Table 4. Crude protein and amino acid concentration (g/kg meat) of the longissimus lumborum muscle from suckler bred steers on different production systems (grain = finished on ad libitum concentrates at 21 months of age; silage + grain = finished on grass silage plus 3.5 kg concentrate dry matter at 24 months of age; and forage = finished at pasture [forage-only] at 28 months of age)

S.E.M., standard error of the mean.
When selenium was excluded (UKNIprot7-2), the nutrient index value differences between production systems was small, but when selenium was included (UKNIprot10-2) the nutrient index value was greater for FORAGE than SIL + GRAIN, which in turn was greater than GRAIN (Supplementary Table 5). The UKNIprot 7-2 score of 10.6 for FORGAE indicates that 10.6% of an adult's RDI would be achieved by consuming 100 g of FORAGE beef (based on the nutrients in that index).
Modelled feed consumption, land-use and food–feed competition
The proportion of herbage DM (grazed pasture + grass silage) in the total diet was 0.61, 0.84 and 1.0 for the GRAIN, SIL + GRAIN and FORAGE systems, respectively. Land used for herbage production was greater for FORAGE than SIL + GRAIN, which in turn was greater than GRAIN, due to greater herbage inclusion in the diet. This resulted in a lower stocking rate and carcass weight gain/ha for FORAGE, than SIL + GRAIN, which in turn was lower than GRAIN (Table 5).
Table 5. Feed consumed, land used, beef output and food–feed competition of suckler weanling-to-beef production systems (grain = finished on ad libitum concentrates at 21 months of age; silage + grain = finished on grass silage plus 3.5 kg concentrate dry matter at 24 months of age; and forage = finished at pasture [forage-only] at 28 months of age) as modelled using the Grange Beef Systems Model (Crosson et al., Reference Crosson, O'Kiely, O'Mara and Wallace2006) parameterized using production data from the present study
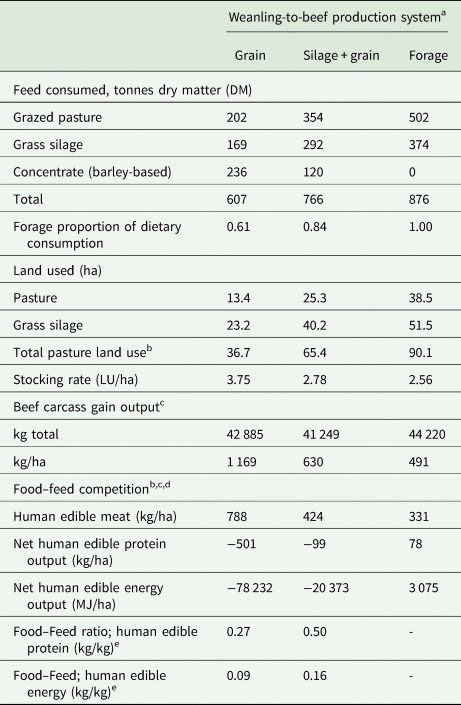
LU, livestock unit; MJ, mega joule; FW, fresh-weight.
a Feed consumption, land-use and carcass gain were measured from the point of purchase (9 month weanling) through to slaughter, corresponding to a duration of 382, 459 and 572 days for grain, silage + grain and forage, respectively (assumes 200 animals per production system).
b Accounts for the pasture area only and does not account for the area of arable land required to produce the purchased concentrates.
c Carcass gain while on the farm (i.e. final carcass weight minus estimated initial carcass weight).
d Accounts for human edible meat in the carcass only and does not account for human edible products in non-carcass components (e.g. offal) (Mullen et al., Reference Mullen, Álvarez, Zeugolis, Henchion, O'Neill and Drummond2017).
e There is no numeric value for forage as there was 0 kg DM of human edible food offered in the diet.
Due to their concentrate intake, GRAIN and SIL + GRAIN were net consumers of human edible food energy and protein/ha, whereas FORAGE was a net producer of human edible food energy and protein/ha, despite the lower carcass output/ha (Table 5). A human edible food protein efficiency ratio of 0.27 and 0.50 for GRAIN and SIL + GRAIN, respectively, indicates that every kg of human edible meat protein produced required 3.7 and 2.0 kg of human edible food to be fed to the animals, respectively. A human edible energy efficiency ratio of 0.09 and 0.16 for GRAIN and SIL + GRAIN, respectively, indicates that every kg of human edible meat energy produced would require 11.1 and 6.3 kg of human edible food to be fed to the animals, respectively.
Modelled farm-level economics
Beef price obtained (€/kg carcass weight) was lower for both SIL + GRAIN and FORAGE than GRAIN, reflecting the lower carcass conformation score. Variable costs were lower for FORAGE than SIL + GRAIN which in turn were lower than GRAIN, of which indoor feed accounted for 72, 84 and 91% of total variable costs, respectively. Fixed costs increased for SIL + GRAIN and FORAGE compared to GRAIN reflecting greater overhead costs associated with the longer duration of time that animals spent on the farm. Net margin including a land charge expense was greater for FORAGE than both SIL + GRAIN and GRAIN (Table 6). Sensitivity analysis showed that a change in beef carcass price had a similar impact on profitability for all systems, whereas a change in concentrate and fertilizer price had the largest impact on GRAIN and FORAGE profitability, respectively.
Table 6. Farm-level economic appraisal (€) of suckler weanling-to-beef production systems (grain = finished on ad libitum concentrates at 21 months of age; silage + grain = finished on grass silage plus 3.5 kg concentrate dry matter at 24 months of age; and forage = finished at pasture [forage-only] at 28 months of age) as modelled using the Grange Beef Systems Model (Crosson et al., Reference Crosson, O'Kiely, O'Mara and Wallace2006) parameterized using production data from the present study

a Farm-level economic appraisal was measured from the point of purchase (9 month weanling) through to slaughter, corresponding to a duration of 382, 459 and 572 days for grain, silage + grain and forage, respectively (assumes 200 animals per production system).
b Gross output = total carcass sales at slaughter – live-weight purchases at weaning. Beef carcass price was €4.70/kg (+€0.06/kg for grain), weanling purchasing price was €2.70/kg live-weight.
c Key input price assumptions; finishing concentrate price was €400/t fresh-weight (FW), calcium ammonium nitrate fertilizer price was €850/t.
d Land charge expense of €450/ha for each additional ha required above 36.7 ha (average beef finishing farm size in Ireland).
e Accounts for the pasture area only and does not account for the area of arable land required to produce the purchased concentrates.
Modelled greenhouse gas emissions
GRAIN produced the lowest GHG emissions (kg CO2eq) per individual animal from weanling-to-slaughter, live-weight gain, carcass weight gain, meat weight gain, gross edible protein gain, essential amino acids weight gain and per meat nutrient index (UKNIprot7-2) (Table 7). FORAGE produced lower GHG emissions than SIL + GRAIN per kg meat weight gain, gross edible protein gain and essential amino acids weight gain. GHG emissions per ha of pasture land area and per animal per day were lowest for FORAGE than both SIL + GRAIN and GRAIN. Across all production systems, methane was the dominant GHG accounting for 62, 66 and 69% of total emissions for GRAIN, SIL + GRAIN and FORAGE, respectively (Supplementary Table 6).
Table 7. Greenhouse gas (GHG) emissions (kg CO2eq) of suckler weanling-to-beef production systems modelled (grain = finished on ad libitum concentrates at 21 months of age; silage + grain = finished on grass silage plus 3.5 kg concentrate dry matter at 24 months of age; and forage = finished at pasture (forage-only) at 28 months of age)

a Total GHG emissions outlined above were measured from the point of purchase (9 month weanling) through to slaughter, corresponding to a duration of 382, 459 and 572 days for grain, silage + grain and forage, respectively (assumes 200 animals per production system).
b GHG emissions (kg CO2eq) to achieve 100% of recommended daily intake on beef, based on the nutrient index UKNIprot 7-2.
The largest category sources of GHG emissions per kg carcass weight gain were enteric fermentation (59%), followed by other (19%), agricultural soils (fertilizer application and excreta at pasture) (14%) and manure management (8%) (Fig. 2). Enteric fermentation emissions were greater for FORAGE and SIL + GRAIN than GRAIN. Emissions associated with manure management did not differ between systems. Emissions associated with agricultural soils were greater for FORAGE than SIL + GRAIN, which in turn was greater than GRAIN, reflecting the greater quantity of total fertilizer application and urine excretion at pasture for FORAGE. Regarding other emissions, the production of concentrate ration had a greater contribution to the production of GHG emissions than the production of inorganic fertilizer, and thus ‘other emissions’ were greater for GRAIN than SIL + GRAIN, which in turn was greater than FORAGE.

Figure 2. Contribution analysis for total greenhouse gas (GHG) emissions per kg of carcass weight gain of three suckler weanling-to-beef production systems (grain, silage + grain and forage), where manure management = slurry and farmyard manure storage; agricultural soils = fertilizer, slurry and farmyard manure application and excreta at pasture; and other = diesel use + nitrate leaching + ammonia volatilization + production of fertilizer, feed, electricity and diesel.
Discussion
Production systems context
This study aimed to quantify key sustainability aspects (carcass traits, meat nutritional value, food security, land-use and economic and environmental sustainability) in contrasting weanling-to-beef steer production systems utilizing data from a controlled animal experiment.
This study was designed to achieve a 390 kg carcass in each system, which corresponds with Ireland's national average carcass weight for suckler beef systems (Teagasc, 2020a). Interest in reducing input costs, whilst improving meat nutritional value and lowering the quantities of human edible food used in beef systems has stimulated interest in omitting concentrates from beef cattle diets. The performance of the FORAGE system in this study (396 kg carcass weight at 28 months of age) is in line with previous forage-only studies with similar genotypes in Ireland (Regan et al., Reference Regan, McGee, Moloney, Kelly and O'Riordan2018; 397 kg carcass weight at 28 months of age). However, there is lower growth performance in forage-only systems globally, due to variation in forage nutritive quality and supply in beef-producing regions (Heflin et al., Reference Heflin, Parker, Marek, Auvermann and Marek2019; Thomas et al., Reference Thomas, Beletse, Dominik and Lehnert2021; Klopatek et al., Reference Klopatek, Marvinney, Duarte, Kendall, Yang and Oltjen2022). The SIL + GRAIN system represents the research benchmark system in Ireland (24 months). The performance of the SIL + GRAIN system (386 kg carcass; 23.7 months of age; 606 kg concentrate DM input per animal) is in line with previous blueprints (396 kg carcass; 23.8 months of age; 616 kg concentrate DM input per animal) (Drennan and McGee, Reference Drennan and McGee2009b). A minority of late-maturing suckler-bred steers are slaughtered at <24 months of age in Ireland (Teagasc, 2020a). A high-concentrate system (GRAIN) was developed to accelerate carcass gain and reduce age at slaughter (<24 months) while maximizing carcass output/ha. The GRAIN system employed in this study has similar principles and design to a ‘pasture background + feedlot system’ practiced in other countries (Heflin et al., Reference Heflin, Parker, Marek, Auvermann and Marek2019; Klopatek et al., Reference Klopatek, Marvinney, Duarte, Kendall, Yang and Oltjen2022). The production systems evaluated in this study are in line with the inputs and carcass outputs of previous system studies and blueprints as outlined above (FORAGE and SIL + GRAIN), and thus, are considered to be representative of expected practice under a high level of technical management.
In Ireland, carcasses are valued on the basis of weight, conformation and fat score, and financially penalized if fat score is inadequate (<6.0) (Conroy et al., Reference Conroy, Drennan, Kenny and McGee2009; Kenny et al., Reference Kenny, Murphy, Sleator, Judge, Evans and Berry2020). Therefore, the most appropriate way to compare production systems is at a similar carcass weight and fat score.
Carcass traits
In the current study, all production systems produced a carcass fat score ≥6.0, which meets the minimum carcass specification. The greater carcass conformation score for the GRAIN compared to the FORAGE system resulted in an increased carcass price/kg (+€0.06) (Conroy et al., Reference Conroy, Drennan, Kenny and McGee2009). A greater carcass conformation score for cattle offered ad libitum concentrates than those offered pasture-only was also seen by Moloney et al. (Reference Moloney, O'Riordan, Monahan and Richardson2022) but not by French et al. (Reference French, O'Riordan, Monahan, Caffrey, Vidal, Mooney, Troy and Moloney2000), who reported no difference.
Many consumers prefer to purchase beef with whiter fat and bright red meat (Troy and Kerry, Reference Troy and Kerry2010); thus, the greater carcass fat yellowness for FORAGE may be negatively regarded in these markets. However, evidence suggests the fat yellowness is associated with a healthier fatty acid profile and a higher anti-oxidant content (see below) and thus, should not be negatively regarded (Dunne et al., Reference Dunne, Monahan, O'Mara and Moloney2009). The colour of meat from forage-cattle is often darker than concentrate-cattle (Moran et al., Reference Moran, Wilson, McElhinney, Monahan, McGee, O'Sullivan, O'Riordan, Kerry and Moloney2019), but this was not observed in this study.
Meat nutrient composition
Consumers are increasingly interested in purchasing beef with enhanced nutritional value (Troy and Kerry, Reference Troy and Kerry2010; Bronkema et al., Reference Bronkema, Rowntree, Jain, Schweihofer, Bitler and Fenton2019; Stampa et al., Reference Stampa, Schipmann-Schwarze and Hamm2020). The similar total fatty acid and saturated fatty acid concentrations in the meat between the three production systems concur with the review by Daley et al. (Reference Daley, Abbott, Doyle, Nader and Larson2010). Despite the statistically significant lower cholesterol concentration in the meat for SIL + GRAIN, the absolute differences were small (4 mg/100 g) and unlikely to affect human plasma cholesterol levels as reported by Garcia et al. (Reference Garcia, Pensel, Sancho, Latimori, Kloster, Amigone and Casal2008). The findings that FORAGE beef had 1.9 times greater CLA, 2.0 times greater n-3 poly-unsaturated fatty acids and 1.8 times greater EPA + DHA fatty acid concentrations than GRAIN beef is consistent with other studies (Garcia et al., Reference Garcia, Pensel, Sancho, Latimori, Kloster, Amigone and Casal2008; Daley et al., Reference Daley, Abbott, Doyle, Nader and Larson2010). Due to the more favourable fatty acid profile, Lenighan et al. (Reference Lenighan, Nugent, Moloney, Monahan, Walton, Flynn, Roche and McNulty2020) reported that habitual consumption of FORAGE beef compared to GRAIN beef may have potential as a public health strategy to improve dietary fat quality. However, mirroring findings in the literature (Garcia et al., Reference Garcia, Pensel, Sancho, Latimori, Kloster, Amigone and Casal2008; Warren et al., Reference Warren, Scollan, Enser, Hughes, Richardson and Wood2008; Moran et al., Reference Moran, Wilson, McElhinney, Monahan, McGee, O'Sullivan, O'Riordan, Kerry and Moloney2019), the C 18:3 n-3 concentration (25 mg/100 g) and EPA + DHA concentration (21 mg/100 g) in FORAGE beef is insufficient to allow this beef to be labelled a source of n-3 fatty acids (300 mg C 18:3 n-3/100 g or 40 mg EPA + DHA/100 g are required [EC, 2012]).
Beef in this study can be considered an important ‘source’ of zinc, selenium, phosphorus and potassium (FSAI, (2021)). The meat mineral content detected in this study is in line with expected values in this geographical region (McCance and Widdowson, Reference McCance and Widdowson2014). Despite the significant differences detected in meat mineral concentration between production systems, the absolute mineral intake differences between treatments were small, when the mineral concentration in a daily meat portion size (100 g) is expressed against the RDI (see Supplementary Table 4) (FSAI, 2020). Therefore, these findings indicate that the production systems considered are unlikely to alter the mineral content of beef to a level that may significantly change human mineral intake. Selenium was the only mineral that varied considerably between meat from different production systems due to a high soil selenium level in the geographical area where the experiment was conducted, compared to national levels (Rodgers and Gately, Reference Rodgers and Gately2000). In contrast to the current study, previous studies reported forage-fed beef to have a greater concentration of calcium, magnesium, potassium, zinc, iron and phosphorus than grain-fed beef (Williams et al., Reference Williams, Wagner, Walters, Horn, Waller, Sims and Guenther1983; Duckett et al., Reference Duckett, Neel, Fontenot and Clapham2009), but the relative differences reported were also small. It is recognized that mineral concentration from different production systems can vary across studies as it is largely determined by the level in the soil where the herbage is grown and the level of minerals included in the finishing ration (Bronkema et al., Reference Bronkema, Rowntree, Jain, Schweihofer, Bitler and Fenton2019). Vitamin E (α-tocopherol) was 1.7 times greater for FORAGE than GRAIN beef, which is reported to offer human health benefits and increased beef colour display life as outlined in Daley et al. (Reference Daley, Abbott, Doyle, Nader and Larson2010).
In this study, meat crude protein and amino acid concentrations were similar to that reported in Lawrie and Ledward (Reference Lawrie and Ledward2014). Humans are more dependent on a specific amount of essential amino acids rather than a specific amount of crude protein (Patel et al., Reference Patel, Sonesson and Hessle2017). Meat essential amino acids did not differ between beef production systems and is an important finding as, to our knowledge, no previous study compared amino acid concentrations between forage-only and concentrate-fed beef. Protein quality may also be assessed using digestible indigestible amino acid scores (DIAAS) (amino acid composition and associated bioavailability) (Ertl et al., Reference Ertl, Knaus and Zollitsch2016) and the data here indicates that there would be no difference in DIAAS between meat from different production systems due to the similar amino acid concentration. Previous studies comparing the quality of protein output (DIAAS) from contrasting beef production systems (Patel et al., Reference Patel, Sonesson and Hessle2017; Thomas et al., Reference Thomas, Beletse, Dominik and Lehnert2021) have assumed essential amino acid concentration in the meat to be similar across production systems and this study confirms this assumption.
Nutrient index
Nutrient indices rank foods on their nutrient content and indicate the extent to which different foods contribute to dietary recommendations (Saarinen et al., Reference Saarinen, Fogelholm, Tahvonen and Kurppa2017; McAuliffe et al., Reference McAuliffe, Takahashi and Lee2018). Despite the statistically significant differences detected for particular fatty acids and mineral concentrations in the meat between different production systems, the UKNIprot7-2 nutrient index score differences were small between treatments when selenium was not considered (see Supplementary Table 5), and this finding is similar to that found by McAuliffe et al. (Reference McAuliffe, Takahashi and Lee2018). Thus, forage-only systems improve meat fatty acid profile but have a limited impact on the overall meat nutritional profile, based on the aforementioned index. It is acknowledged that results may vary depending on the nutrient index used. The UKNIprot10-2 index accounts for selenium, and was greater for FORAGE beef, but this resulted from the greater than average selenium levels in the geographical area, as discussed above. Although the type of protein was not considered in the nutrient index, essential amino acid concentration in the meat did not differ between FORAGE and GRAIN beef and if included would not change the ranking of production systems.
Modelled food–feed competition and land-use
From a food sustainability/security perspective, the use of human edible food in livestock feed should be reduced. The FORAGE system produced more human edible food than it consumed, in contrast to systems that offer concentrates to beef animals (SIL + GRAIN and GRAIN) where the opposite was found, i.e. they consumed more human edible food than they produced. This agrees with previous international studies (Patel et al., Reference Patel, Sonesson and Hessle2017; Thomas et al., Reference Thomas, Beletse, Dominik and Lehnert2021). It is acknowledged that the use of food by-products rather than whole-cereal grains can help to improve human edible food protein and energy ratios of SIL + GRAIN and GRAIN systems, to the point that all systems could become net producers of human edible food protein and energy if all barley and soyabean meal in the concentrate ration was replaced by by-products (Mosnier et al., Reference Mosnier, Jarousse, Madrange, Balouzat, Guillier, Pirlo, Mertens, O'Riordan, Pahmeyer, Hennart, Legein, Crosson, Kearney, Dimon, Bertozzi, Reding, Iacurto, Breen, Carè and Veysset2021; McGee et al., Reference McGee, Lenehan, Crosson, O'Riordan, Kelly, Moran and Moloney2022).
Protein quality (DIAAS, amino acid composition and bioavailability) (Ertl et al., Reference Ertl, Knaus and Zollitsch2016) is not considered in the Mosnier et al. (Reference Mosnier, Jarousse, Madrange, Balouzat, Guillier, Pirlo, Mertens, O'Riordan, Pahmeyer, Hennart, Legein, Crosson, Kearney, Dimon, Bertozzi, Reding, Iacurto, Breen, Carè and Veysset2021) assessment used in this study, and DIAAS is 2.4 times greater in beef than in the concentrate feed used in this study. Accordingly, after adjusting for DIAAS, SIL + GRAIN was marginally a net producer of human edible food protein (1.2 food–feed protein), whilst GRAIN remained a net consumer (0.6 food–feed protein). Accounting for protein quality (DIAAS) in the current study did not change the ranking of results (as meat essential amino acid concentration did not differ), but improved the food–feed ratios for all beef production systems.
Although FORAGE and SIL + GRAIN systems utilized less human edible food, they produced less meat per ha of agricultural land than GRAIN system and this result is consistent throughout the international literature (Capper, Reference Capper2012; De Vries et al., Reference De Vries, Van Middelaar and De Boer2015; McGee et al., Reference McGee, Lenehan, Crosson, O'Riordan, Kelly, Moran and Moloney2022). Hence, GRAIN–beef production systems are more favourable than FORAGE for meeting global beef demand from a fixed area of land. The land area required to produce the concentrate ration was not considered in this analysis. However, if the tillable land area was considered, the GRAIN system would still require the least amount of land based on the assumption that the average yield of spring and winter barley is 6.6 and 8.8 t/ha, respectively, in Ireland (Teagasc, 2020b).
In summary, there are trade-offs between food–feed competition and land-use in this study. From a food security and optimal land-use perspective, compared to GRAIN and SIL + GRAIN systems which utilize human edible food, FORAGE has an important role to play in positively producing human edible food on land that is unsuitable for cropping (Broom, Reference Broom2021; Hennessy et al., Reference Hennessy, Shalloo, Van Zanten, Schop and De Boer2021). It is acknowledged that a land use efficiency analysis (van Zanten et al., Reference van Zanten, Mollenhorst, Klootwijk, van Middelaar and de Boer2016; Hennessy et al., Reference Hennessy, Shalloo, Van Zanten, Schop and De Boer2021) should be undertaken, but this is beyond the scope of the current study.
Modelled farm-level economics
A profitable beef system is critical for beef farmers. Despite the longer production cycle and lower carcass output/ha, the greatest net margin for the FORAGE system largely reflects the relative cost of grazed grass compared to purchased concentrates in temperate oceanic climates (Finneran et al., Reference Finneran, Crosson, O'Kiely, Shalloo, Forristal and Wallace2012). Previous Irish studies (Keane and Allen, Reference Keane and Allen1998; Kearney et al., Reference Kearney, O'Riordan, McGee, Breen and Crosson2022; McGee et al., Reference McGee, Lenehan, Crosson, O'Riordan, Kelly, Moran and Moloney2022) have reported the importance of reducing the quantity of concentrates fed to animals to lower cost of production, while still achieving high animal performance from forage. Across the international literature, animal performance can significantly vary in grass-based systems depending upon the region, resources and forage availability and quality (Cruz et al., Reference Cruz, Acetoze and Rossow2013; Duckett et al., Reference Duckett, Neel, Lewis, Fontenot and Clapham2013; Heflin et al., Reference Heflin, Parker, Marek, Auvermann and Marek2019; Klopatek et al., Reference Klopatek, Marvinney, Duarte, Kendall, Yang and Oltjen2022) and thus can alter profitability. Reflecting these constraints, studies in the USA and Canada have reported forage-finishing systems to achieve a lower (Klopatek et al., Reference Klopatek, Marvinney, Duarte, Kendall, Yang and Oltjen2022), similar (Cruz et al., Reference Cruz, Acetoze and Rossow2013) or greater (Berthiaume et al., Reference Berthiaume, Mandell, Faucitano and Lafreniere2006) farm-level profit than grain–beef production systems. In many regions, beef farming enterprises are prone to poor profitability and, specifically in Ireland, are heavily dependent on European Union farm support payments (Dillon et al., Reference Dillon, Donnellan, Moran and Lennon2022). Therefore, forage-only systems have a role to play to improve farm-level profitability and retain a viable lifestyle for beef farmers.
Modelled greenhouse gas emissions
Consumers are becoming increasingly interested in purchasing food with a low environmental footprint (Stampa et al., Reference Stampa, Schipmann-Schwarze and Hamm2020) and consequently production systems need to evolve to meet these needs. The 18% lower GHG emissions produced per kg carcass weight gain for GRAIN than other treatments is primarily due to their earlier slaughter age, which agrees with the international literature (Pelletier et al., Reference Pelletier, Pirog and Rasmussen2010; Heflin et al., Reference Heflin, Parker, Marek, Auvermann and Marek2019; Thomas et al., Reference Thomas, Beletse, Dominik and Lehnert2021). The 4% lower GHG emissions per kg carcass weight gain for FORAGE than SIL + GRAIN systems was primarily due to the greater GHG emissions associated with the production of the concentrate ration (SIL + GRAIN) offsetting the greater GHG emissions associated with excretion of urine and faeces at pasture for the FORAGE system, which supports other studies with similar systems (Herron et al., Reference Herron, Curran, Moloney, McGee, O'Riordan and O'Brien2021).
The aforementioned environmental metrics are important, but to our knowledge, no study has expressed GHG emissions against meat gross edible protein and essential amino acid gain. GRAIN still produced lower GHG emissions per meat gross edible protein and essential amino acid gain compared to SIL + GRAIN and FORAGE. However, this does not account for human edible food protein consumed in the concentrate feed offered to beef cattle (food–feed competition). Consequently, when GHG emissions are expressed against the net production of human edible food protein (food–feed competition) FORAGE had a more favourable outcome as it was a net producer of human edible protein/ha and indicated that 118 kg CO2eq was required to produce 1 kg of net human edible food protein (FORAGE). In contrast, GRAIN and SIL + GRAIN were net consumers of human edible food protein/ha and thus, are unfavourable when GHG emissions are expressed against the net production of human edible food protein. This is a novel and important consideration in the context of not just analysing GHG emissions per carcass weight gain or gross edible protein gain, but taking account of the net human edible food produced (food–feed competition) and should be strongly considered by policy makers from the point of view of simultaneously improving food security and decreasing GHG emissions.
Implications
The concept of sustainability in beef production systems encompasses multiple and competing dimensions, with inevitable trade-offs and regional-specific solutions. Scientifically based scoring systems that comprehensively evaluate a wide range of sustainability metrics across beef production systems such as that developed in Broom (Reference Broom2021) need to be considered. However, the relative importance of each sustainability metric (including meat nutritional value, food–feed competition, land-use, economics and environment) will vary in different regions across the globe. Generally, compared to forage-only systems, intensive grain–beef production systems offer the clear advantage of reducing land area needed to produce a kg of beef, thereby is an important system to produce sufficient beef to meet global demand and to reduce land-use, particularly in regions where land is most limiting. Despite this, grain–beef can be an inefficient converter of human edible feed, thus, in areas of the world where human food availability is limiting, forage-only systems are advantageous as they do not utilize any human edible food.
The lower GHG emissions per animal, kg carcass, gross edible protein and essential amino acid gain for GRAIN are clearly important to reduce global warming and to meet consumer demand for food with a low ‘carbon footprint’. However, when food–feed competition is considered, GHG emissions per kg of net human edible food protein produced are more favourable for the forage-only than grain–beef production system. Therefore, GHG emission ranking between systems differs depending on the metric used. Regardless of GHG emissions, beef farmers are unlikely to operate a production system that is unprofitable and therefore, under comparable conditions to this study, less likely to operate grain–beef production systems (compared to forage-only). Therefore, where high-nutritive value forage can be produced cheaply, it is important to focus on reducing GHG emissions per carcass weight gain from forage-only systems, as detailed in previous studies (Herron et al., Reference Herron, Curran, Moloney, McGee, O'Riordan and O'Brien2021; Klopatek et al., Reference Klopatek, Marvinney, Duarte, Kendall, Yang and Oltjen2022). However, it can be challenging to achieve adequate carcass fat cover (Regan et al., Reference Regan, McGee, Moloney, Kelly and O'Riordan2018) or yield quality and marbling scores (Klopatek et al., Reference Klopatek, Marvinney, Duarte, Kendall, Yang and Oltjen2022) on a forage-only diet at a young age (20 months) (Regan et al., Reference Regan, McGee, Moloney, Kelly and O'Riordan2018; Klopatek et al., Reference Klopatek, Marvinney, Duarte, Kendall, Yang and Oltjen2022) and this merits further investigation. It is acknowledged that forage-only systems are highly dependent on environmental conditions and associated pasture supply. Adverse weather conditions could lead to poor forage growth and result in farmers needing to introduce concentrate supplementation.
Conclusion
It is clear that there are inherent trade-offs between beef production systems. The GHG emission ranking between systems also differs depending on the metric used. The benefits of grain–beef production systems in terms of lower land-use and GHG emissions per animal and product unit are clear. However, where high-nutritive value forage can be produced cheaply, forage-only systems are superior to grain–beef production systems in the context of food–feed ratio and GHG emissions per kg of net human edible food protein produced. Furthermore, although the meat amino acid and mineral concentration did not differ between the systems, the higher omega-3 fatty acid concentrations could make the beef from the forage-only system more attractive to consumers. The greater profitability of the forage-only system is also important for the long-term viability of beef farmers. Nonetheless, the older slaughter age of cattle in the forage-only (and silage + grain system) is a weakness in terms of GHG emission metrics compared to the grain system and merits further research to address this.
Supplementary material
The supplementary material for this article can be found at https://doi.org/10.1017/S0021859623000540.
Acknowledgements
The authors acknowledge Joe Munroe for his technical assistance and Francis Collier, Pat Whelan and Patsy Martin for their care of the experimental animals. Also thanks to the following Teagasc staff for their assistance with laboratory analysis, including Martin Danaher (meat mineral analysis), Ciara Carberry (fatty acid and cholesterol analysis), Anne Marie McAuliffe (meat amino acid analysis), Ann Marley (feed analysis) and Abimbola Ikoyi (feed analysis and meat crude protein analysis). The financial support of Teagasc is gratefully acknowledged.
Author contributions
Conceptualization, methodology, formal analysis and resources, P. R. D., M. M., A. P. M., A. K. K., P. C. and E. G. O.; investigation, P. R. D. and E. G. O.; data curation, P. R. D., P. C. and E. G. O.; writing – original draft preparation, P. R. D.; writing – review and editing, M. M., A. P. M., A. K. K., P. C. and E. G. O.; supervision, E. G. O.; project administration, E. G. O.; funding acquisition, E. G. O.
Funding statement
This work was supported by Teagasc.
Competing interests
None.
Ethical standards
Animal procedures performed in this experiment were approved by the Teagasc Animal Ethics Committee and were conducted in accordance with the European Communities Regulation 2002 and 2005.


 Open access