

In the course of running computational reproducibility checks for Peyton, Huber and Coppock (Reference Peyton, Huber and Coppock2021), the Yale ISPS Data Archive identified mistakes concerning the number of statistically significant differences reported for comparisons made between pre-COVID experiments and our replications. These mistakes arose because of errors in the code used to adjust p-values for multiple comparisons, leading to inconsistent reporting of the number of significant differences before and after adjustment. Correcting these mistakes affects Figures 2-3 and the first paragraph on p. 6 in the published article. All point estimates, standard errors, and substantive conclusions are unchanged.
In Figure 1, we present the original version of Figure 2 from Peyton, Huber and Coppock (Reference Peyton, Huber and Coppock2021) in the top panel (1a) and the correction in the bottom panel (1b). Figure 2 likewise shows the original version of Figure 3 in the top panel (2a) and the correction in the bottom panel (2b). The text on p. 6 of Peyton, Huber and Coppock (Reference Peyton, Huber and Coppock2021) reads:
“Of the 24 correctly signed estimates, 10 were significantly smaller in replication. Of the four incorrectly signed estimates, three were significantly different – the foreign aid misperceptions study and two of six estimates from the atomic aversion study. Figure 3 plots the analogous information for the 41 conjoint estimates and their 41 replications, all of which are signed in the same direction. Of these, 35 of 41 were smaller in replication (6 statistically significant differences) and 6 of 41 were larger in replication (1 of 6 significant differences).”
The text on p. 6 should instead read (corrections in bold):
“Of the 24 correctly signed estimates, 11 were significantly smaller in replication. Of the four incorrectly signed estimates, three were significantly different – the foreign aid misperceptions study and two of six estimates from the atomic aversion study. Figure 3 plots the analogous information for the 41 conjoint estimates and their 41 replications, all of which are signed in the same direction. Of these, 35 of 41 were smaller in replication (11 statistically significant differences) and 6 of 41 were larger in replication (1 of 6 significant differences).”
The replication archive (available at https://doi.org/10.7910/DVN/38UTBF) has been updated so that the code used to generate Figures 2-3 in Peyton, Coppock and Huber (Reference Peyton, Coppock and Huber2021) now produces the correct versions shown here in Figures 1-2. We are grateful to Limor Peer and the team at the ISPS Data Archive for the curation and computational reproducibility report that identified the mistakes necessitating this correction. We regret the error.
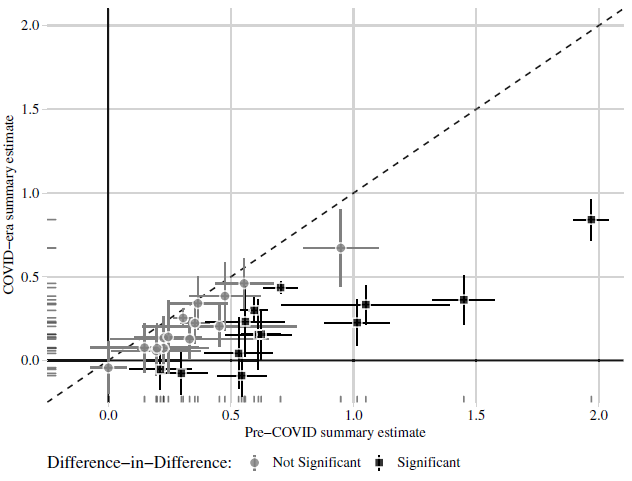
(a) Peyton, Huber and Coppock (2021) Figure 2
Notes: Estimated summary effect sizes and 95% confidence intervals from pre-COVID experiments (horizontal axis) and COVID-era replications (vertical axis). Thirteen of 28 replication estimates were significantly different from their pre-COVID benchmark at p < 0.05.

(b) Correction to Peyton, Huber and Coppock (2021) Figure 2
Figure 1: Comparison of 28 summary effect sizes across 11 studies (conjoint excluded).
Notes: Estimated summary effect sizes and 95% confidence intervals from pre-COVID experiments (horizontal axis) and COVID era replications (vertical axis). 14 of 28 replication estimates were significantly different from their pre-COVID benchmark at p < 0.05, and 13 of these (denoted by square shaped points) remained statistically significant after adjusting for multiple comparisons to control the false discovery rate (Benjamini and Hochberg, Reference Benjamini and Hochberg1995).
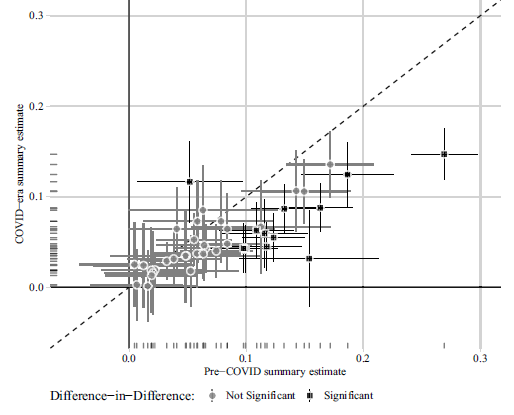
(a) Peyton, Huber and Coppock (2021) Figure 3
Notes: Estimated summary effect sizes and 95% confidence intervals from pre-COVID experiments (horizontal axis) and COVID-era replications (vertical axis). 7 of 41 replication estimates were significantly different from their pre-COVID benchmark at p < 0.05.

(b) Correction to Peyton, Huber and Coppock (2021) Figure 3
Figure 2: Comparison of 41 summary effect sizes in conjoint experiments.
Notes: Estimated summary effect sizes and 95% confidence intervals from pre-COVID experiments (horizontal axis) and COVID-era replications (vertical axis). 12 of 41 replication estimates were significantly different from their pre-COVID benchmark at p < 0.05, and 7 of these (denoted by square shaped points) remained statistically significant after adjusting for multiple comparisons to control the false discovery rate (Benjamini and Hochberg, Reference Benjamini and Hochberg1995).


