


1. INTRODUCTION
Although waxing and waning of terrestrial ice has been the hallmark of Earth's climate system since at least the Pleistocene, recent evidence that almost all terrestrial ice bodies are presently losing mass is a concerning sign of anthropogenic climate change (Kargel, Reference Kargel and Kargel2014). Rates of mass loss are particularly concerning in the tropics (Kaser, Reference Kaser1999), where changes in glacier meltwater fluxes pose serious risks to downstream communities. Peru is home to 70% of Earth's tropical glaciers and meltwater from Peruvian glaciers provides a critical water source for domestic consumption, hydropower generation and agriculture, especially during dry seasons (Vuille and others, Reference Vuille2008). As urban centers grow in the Andes, water resources are being increasingly strained by rising demand for water (Magrin and others, Reference Magrin2014). These compounding factors make the people of Peru particularly vulnerable to long-term water shortages associated with glacier loss.
Changes in volcanic activity can also lead to rapid changes in glacier volume that pose a serious short-term hazard to local communities (Major and Newhall, Reference Major and Newhall1989; Pierson, Reference Pierson1995; Delgado-Granados and others, Reference Delgado-Granados, Haeberli and Whiteman2015; Smellie and Edwards, Reference Smellie and Edwards2016). The 1985 eruption and ensuing volcanic mudflow at Nevado del Ruiz, which killed over 23 000 Colombians, is an iconic example (Pierson, Reference Pierson1995). Even without an eruption, volcanic heat fluxes can cause increased melting and jökulhlaups through ice melting during magma recharge events (Björnsson, Reference Björnsson1988). While these types of events are rare, quantifying upstream ice extent is important for the assessment and mitigation of potential downstream hazards.
Here we focus on El Nevado Coropuna (15°33′S, 72°38′W, 6425 m.a.s.l.) in southern Peru, which is a glacierized volcanic complex with an areal ice cap extent of 44.1 km2 (in 2014; Fig. 1). We focus on Coropuna Ice Cap for several reasons. First, Coropuna represents the largest fresh water reserve for the region of Arequipa, which relies on snow and ice melt to support its population of 1.15 million people (INEI, 2007; Úbeda, Reference Úbeda2011; Silverio and Jaquet, Reference Silverio and Jaquet2012). Second, an eruption from Coropuna has the potential to produce lahars that could affect populations in the Condesuyos, Castilla and Camaná provinces. According to the 2007 Peruvian Census, 57 416 people live in the Condesuyos and Castilla provinces spanned by Coropuna and an additional 53 065 people live in the downstream Camaná province (Instituto Nacional de Estadistica e Informatico (INEI), 2007) (Fig. 1). Although no known volcanic activity has occurred at Coropuna in modern times, the presence of Holocene-age lava flows flanking the ice cap is consistent with a volcanic system that is still active and where future magma recharge and/or eruptions could pose a hazard to local communities. Thus, it should be important that changes in Coropuna's ice extent are well known. Although nine previous studies have quantified the glacierized area of Coropuna (Ames and others, Reference Ames, Evangelista, Valverde and Zúñiga1988; de Silva and Francis, Reference de Silva and Francis1990; Nunez-Juarez and Valenzuela-Ortiz, Reference Nunez-Juarez and Valenzuela-Ortiz2001; Racoviteanu and others, Reference Racoviteanu, Manley, Arnaud and Williams2007; Forget and others, Reference Forget, Thouret, Kuentz and Fontugne2008; Peduzzi and others, Reference Peduzzi, Herold and Silverio2010; Úbeda, Reference Úbeda2011; Silverio and Jaquet, Reference Silverio and Jaquet2012; Veettil and others, Reference Veettil, Bremer, de Souza, Maier and Simões2016), these studies have produced inconsistent results (Fig. 2), leading to uncertainty in the fate of the ice cap as a meltwater source in the coming years to decades.
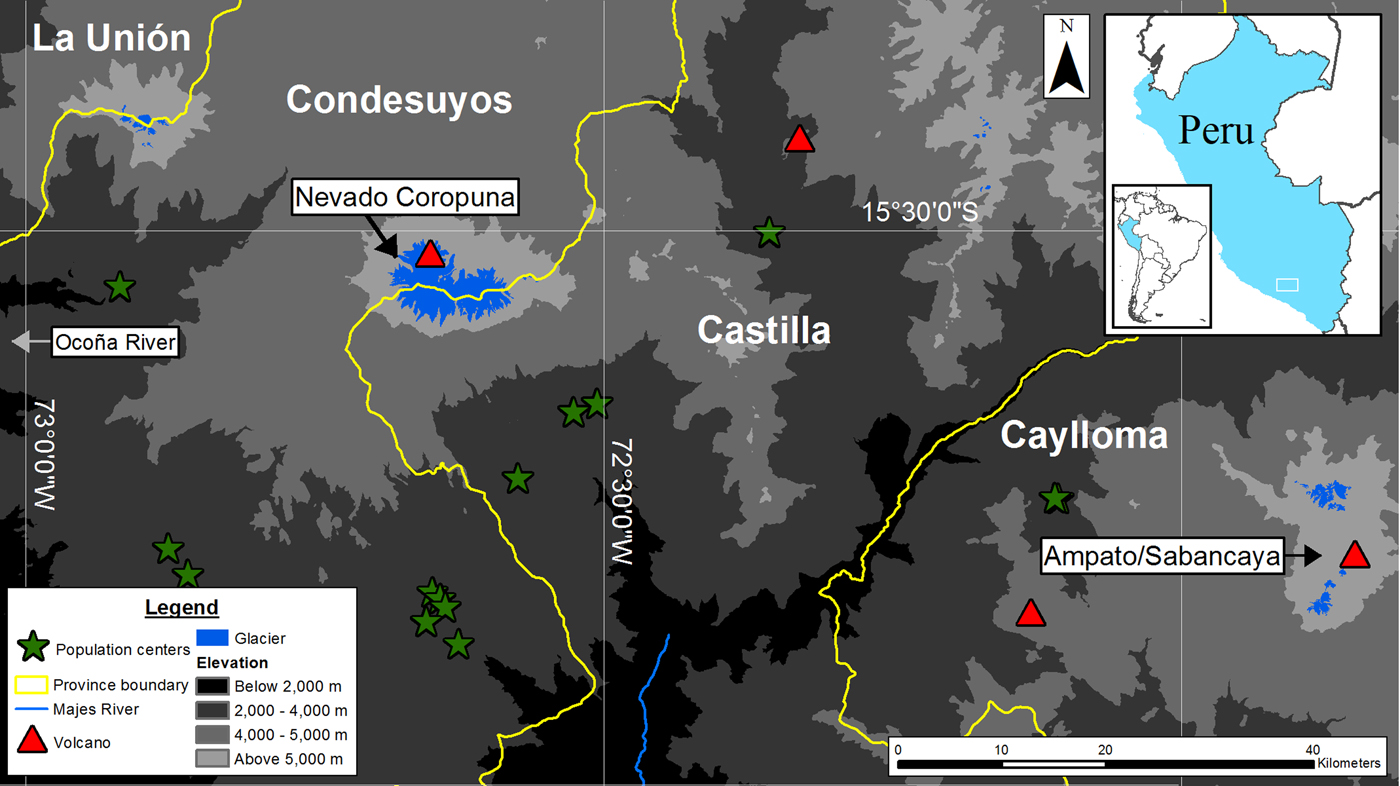
Fig. 1. Location map showing Nevado Coropuna Ice Cap in central Peru with respect to surrounding provincial boundaries. (Elevation data from SRTM through the USGS-EROS, NASA, and NGA. Country outline from DeLorme Publishing Company, Inc.)
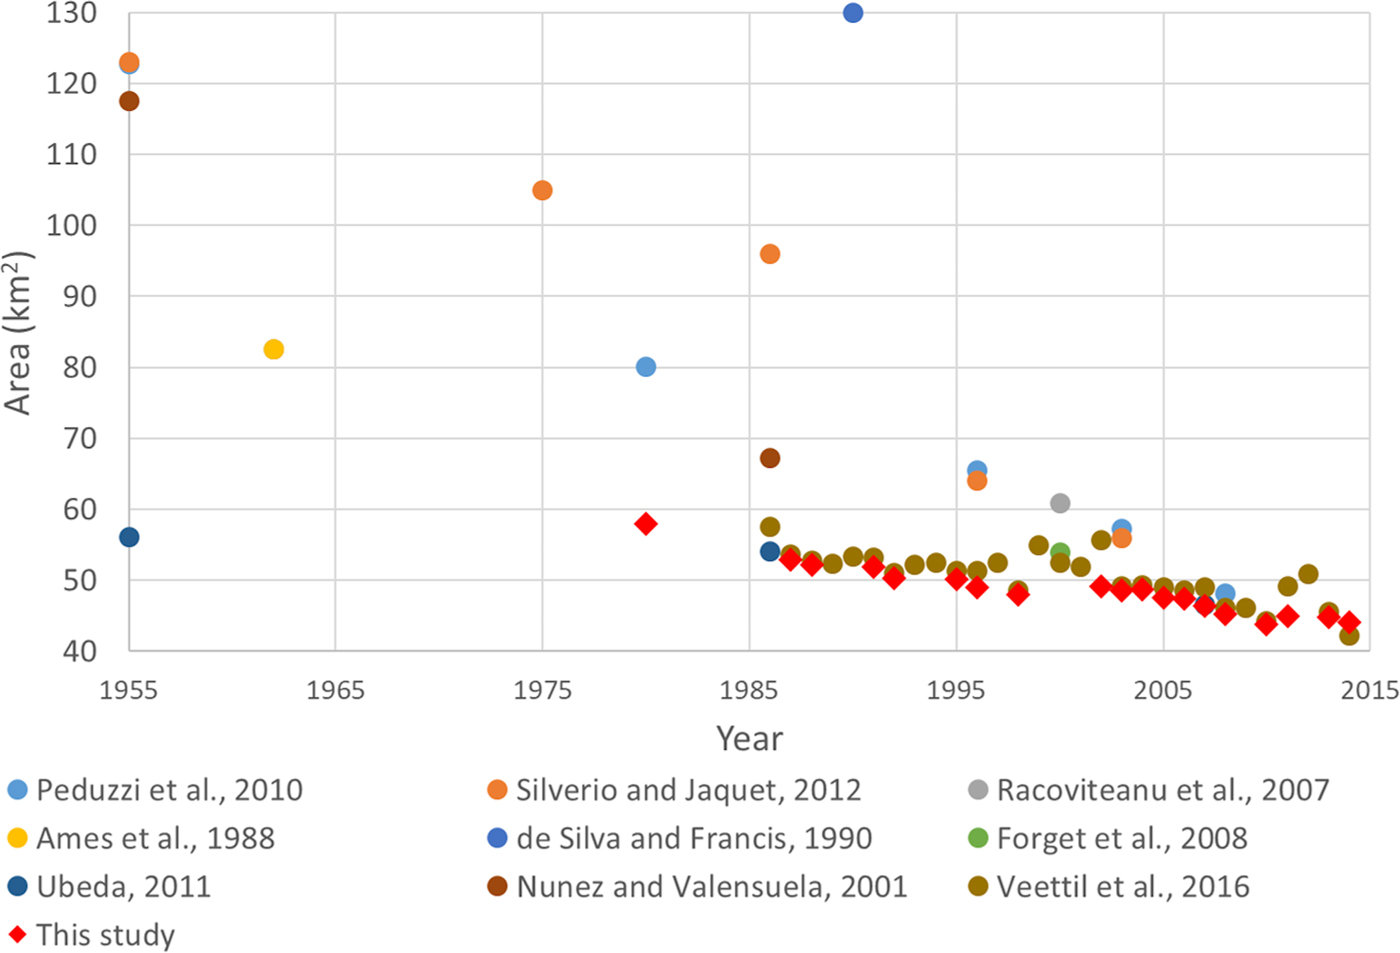
Fig. 2. Summary of estimates of glacierized area of Nevado Coropuna, Peru from nine previous studies. The error estimates of this study are shown in Figure 4.
To address the need for accurate glacier change time series for Nevado Coropuna, we have reconstructed a time series of its ice cap area using 259 Landsat 2, 4, 5 and 7 scenes from 1980 to 2014. The goals of this study are (1) to understand the source of the discrepancies in previous ice area change estimates for Coropuna Ice Cap through a comparative analysis with a more comprehensive, better-constrained and longer dataset and (2) to discuss how the new results may be important for managing water resources.
2. DATA AND METHODS
Given the large areal extent, high elevation and difficult access of Coropuna Ice Cap, we focus on remote sensing observations to construct a multi-decadal time series of areal ice extent. Atmospherically corrected Landsat scenes from 1980 to 2014 were downloaded from the USGS Earth Explorer (https://earthexplorer.usgs.gov/). A total of one Landsat 2, one Landsat 4, 158 Landsat 5 and 99 Landsat 7 scenes with cloud-free conditions over Coropuna were compiled. We constructed a time series of the Coropuna ice area using the Normalized Difference Snow Index (NDSI; Dozier, Reference Dozier1989; Hall and others, Reference Hall, Riggs and Salomonson1995) applied to the Landsat scenes in the ESRI ArcGIS model builder application. The NDSI is calculated as
 $${\rm NDSI = (}R_{\rm G} -R_{{\rm SWIR}} {\rm ) / (}R_{\rm G} + R_{{\rm SWIR}} {\rm ),}$$
where R G and R SWIR are the reflectivity of the green (band 2) and shortwave infrared (band 5) wavelengths, respectively, in Landsat 4, 5 and 7 images. We used the NDSI because it efficiently distinguishes snow and ice from the surrounding terrain (Hall and others, Reference Hall, Riggs and Salomonson1995; Albert, Reference Albert2002), enabling construction of a more consistent and reproducible time series of Coropuna ice area change than possible using a manual approach (Paul and others, Reference Paul, Huggel, Kääb, Kellenberger and Maisch2002, Reference Paul2013; Paul and Andreassen, Reference Paul and Andreassen2009). All 259 images in this study were manually inspected to ensure that clouds did not obscure the ice area and bias our extent estimates.
NDSI values can range from 0.25 to 1.0 (Hall and others, Reference Hall, Riggs and Salomonson1995). While a value of 0.5 is typical for glacier mapping (Albert, Reference Albert2002), variations can exist between sites. To identify the most appropriate NDSI value for Coropuna, we computed the NDSI for all pixels in a 30 m-resolution Landsat 7 ETM scene from 26 November 2013. To crop the NDSI map to the Coropuna ice extent, we first manually mapped the Coropuna ice edge in a nearly contemporaneous high-resolution (1.5 m panchromatic) SPOT image from 23 November 2013. The ice extent mask constructed using the SPOT image was eroded by 42.43 m (the diagonal length of one Landsat 7 pixel) to ensure that mixed pixels spanning the ice cap margin were excluded, then the mask was applied to the Landsat-derived NDSI map to extract NDSI values over just the ice area. Assuming that the spectral characteristics of the ice cap did not change substantially over the Landsat observation period, we used the minimum NDSI value of 0.5567 from the masked map to identify glacierized regions in all 259 Landsat images (i.e. NDSIsnow&ice ⩾ 0.5567). The use of a Coropuna image-derived NDSI threshold increases the accuracy of our automated results relative to those obtained using an arbitrarily derived threshold because it accounts for the site-specific reflectance of the ice cap.
To construct a glacier extent time series, we first applied the NDSI threshold to all NDSI maps constructed using our Landsat 4, 5 and 7 time series (Fig. 3). From this dataset, we chose NDSI maps that contained the minimum snow and ice area for each given year to make 18 glacial areal extent measurements at Coropuna spanning 1987–2014 (Table 1, Fig. 3). We selected the NDSI maps with the minimum snow and ice area to quantify the Coropuna glacier area, rather than maps from an arbitrary date during the dry season, to minimize potential biases in extent estimates from non-glacierized snow-covered regions. Since shortwave infrared energy was not recorded by the Landsat 1–2 satellites, we could not apply the NDSI thresholding approach to images acquired prior to 1987. To extend our time series before the 1987 launch of Landsat 4, we manually delineated the Coropuna ice extent in a cloud- and snow-free Landsat 2 image acquired on 12 December 1980. The final time series contains a total of 19 minimum annual snow and ice extent estimates for Coropuna from 1980 to 2014 (Fig. 3). Uncertainties in our extent time series are presented in the following section.
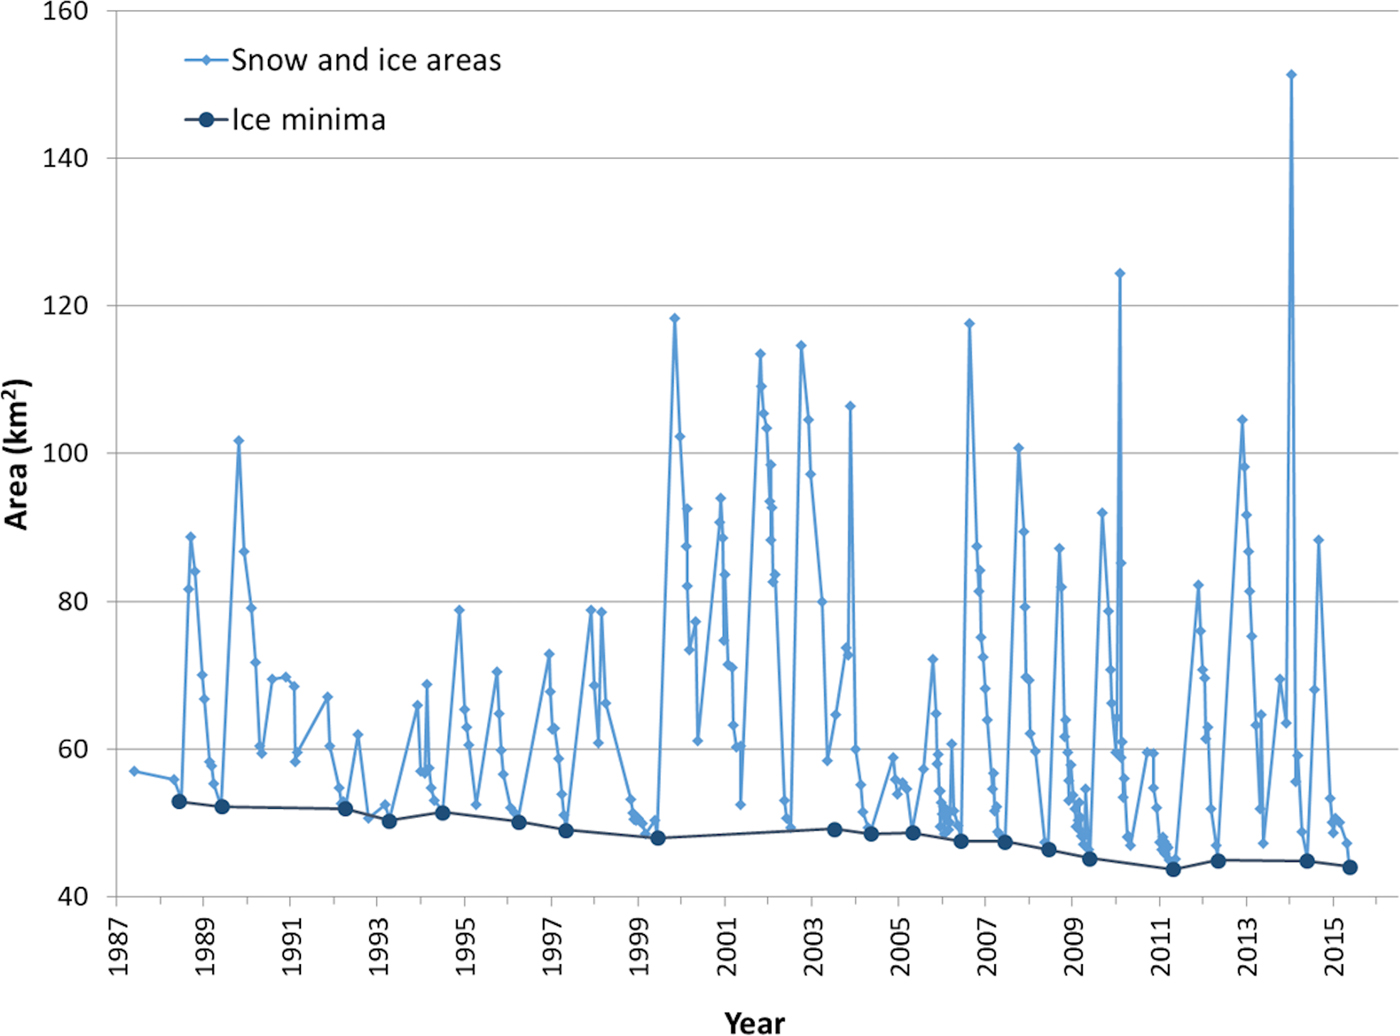
Fig. 3. Snow and ice areas from 259 Landsat scenes. The 19 ice minima used in this study are highlighted.
Table 1. All 19 Landsat scene IDs, dates, areas and maximum uncertainty estimates used to measure the ice minima in this study
Maximum uncertainty estimates are derived using the mixed pixel approach. The Landsat 2 scene area is estimated with manual delineation, while all other area measurements utilize the NDSI. The spatial resolution of the Landsat 4, 5 and 7 images is 30 m, while the Landsat 2 image is 60 m resolution.
3. ERROR ASSESSMENT OF MEASURED GLACIERIZED AREAS
In glacier remote sensing, the four main sources of error are (1) positional errors, (2) processing errors, (3) conceptual errors (e.g. errors in defining glaciers such as transient snow cover) and (4) classification errors (Racoviteanu and others, Reference Racoviteanu, Paul, Raup, Khalsa and Armstrong2009). Here we employed several methods to minimize all of these errors. To reduce positional errors, we manually inspected all acquired Landsat scenes to ensure accurate georeferencing based on ground control points geolocated by the USGS. To reduce processing errors, we used automatic methods of glacier classification, which have been found to be more robust than manual digitization for ice bodies large than 0.2 km2 (Paul and others, Reference Paul2002; Paul and Andreassen, Reference Paul and Andreassen2009). To reduce conceptual errors, we processed and manually inspected all 259 cloud-free observations in the Landsat archive to try to ensure that our glacier area measurements represent the annual snow minima. This leaves classification errors, described below, as the main source of uncertainty in our study.
To quantify uncertainty in our ice area classification measurements, we first compared the manually digitized Coropuna ice area in the SPOT image from 23 November 2013 and the NDSI-based area estimate from the nearly contemporaneous Landsat scene that was used to compute the NDSI threshold. Assuming that negligible area change occurred over the 3 d between image acquisitions, any difference in the area estimates can be attributed to the inability of the NDSI thresholding approach to accurately distinguish glacierized and non-glacierized pixels. A similar approach has been used to quantify the uncertainty in NDSI-derived glacier area estimates in previous studies (Paul, Reference Paul2000, Reference Paul2002; Paul and others, Reference Paul2002). We obtained manually derived and NDSI-based area estimates of 44.95 and 44.85 km2, respectively, which is consistent with an uncertainty in our area estimates of <1%.
Since the SPOT image was used to define the area over which the NDSI threshold was computed, it is possible that this approach underestimates the true uncertainty in our area estimates. We took two additional approaches to estimate area uncertainties. The first assumed that pixel misclassification is the result of uncertainty in the NDSI threshold. We varied the value of the NDSI threshold by 5% to account for the quoted error in the digital number values of the Landsat satellites (NASA, 1998). We estimated that uncertainty in the NDSI threshold value leads to uncertainty in the total glacierized area of 0.58% on average (Fig. 4).
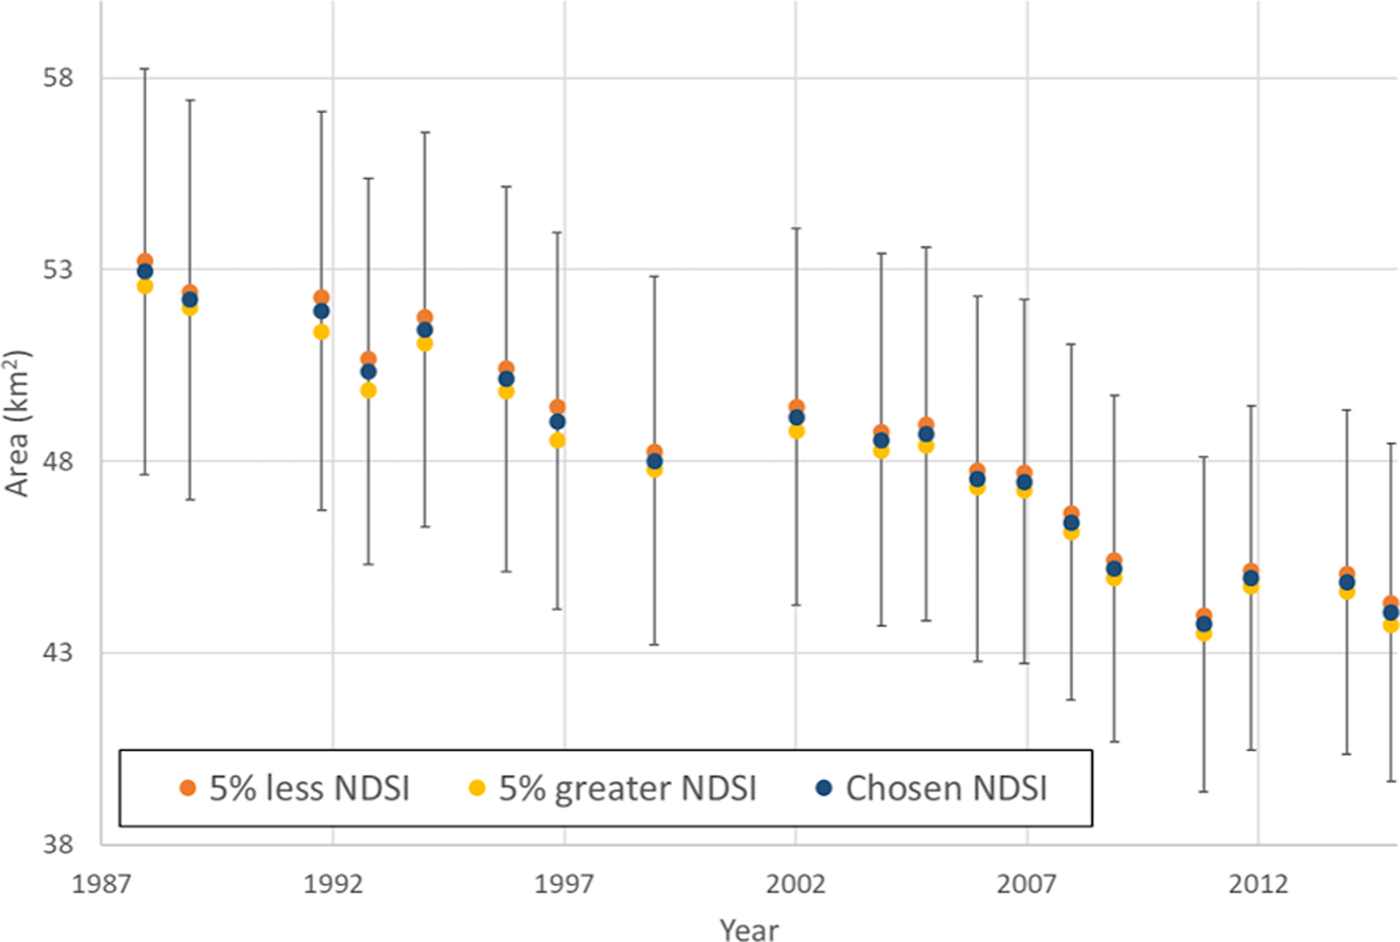
Fig. 4. Error assessment for Normalized Difference Snow Index (NDSI). The measured glacier area is shown (blue points) surrounded by the sensitivity analysis of the NDSI with a 5% variation in values (yellow and orange points). The maximum estimated error due to the mixed pixel effect (10%) is shown as vertical whiskers.
The second alternative approach assumed that pixel misclassification is restricted to the ice cap periphery, where uncertainty in the NDSI threshold will have the biggest impact on pixel classification due to the presence of mixed pixels (i.e. pixels that overlap the glacier and surrounding terrain or contain debris-laden ice). Assuming that all pixels in the perimeter were misclassified, we summed the number of perimeter pixels and multiplied by the pixel area (900 m2) to obtain an estimate of the maximum misclassified ice area. A similar approach was used by Rivera and others (Reference Rivera, Benham, Casassa, Bamber and Dowdeswell2007) and Silverio and Jaquet (Reference Silverio and Jaquet2005), among others, to quantify uncertainties in ice extent. A comparison of the estimated and maximum areas shows that the area uncertainty is ~8.9% on average for Landsat 4, 5 and 7 scenes (Table 1; Fig. 4) and 11% for the Landsat 2 scene.
We do not quantify potential error due to debris cover of Coropuna because we have observed little to no debris covered ice in both the satellite image archive and in the field. Assuming that debris covered ice will be optically distinct from neighboring bare ice and ice-free pixels, due to differences in spectral reflectance and/or surface texture, manual inspection of the 1.5 m resolution SPOT image reveals minimal debris covered ice. Inspection of an air photo taken on 23 December 2014 also suggests little to no debris cover (Fig. 5). It is also worth noting that in the absence of large temporal variations in debris cover, which are unlikely given the absence of debris in the recent SPOT image and air photo, the presence of debris would lead to fairly systematic underestimation of the true ice area and would not influence the area change trend derived from our observations.
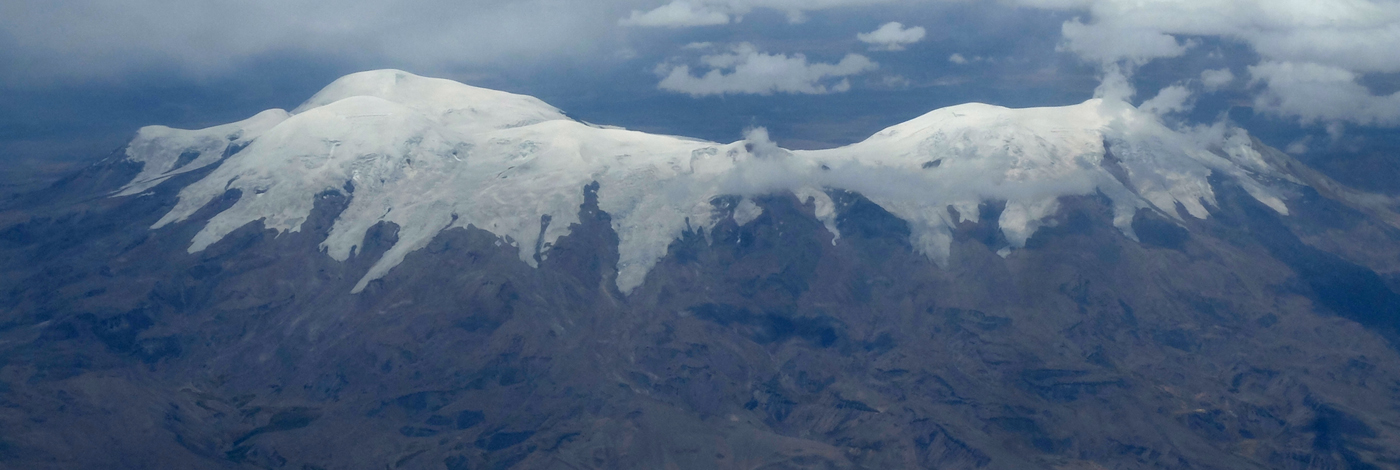
Fig. 5. Air photo of Coropuna. Image taken on 23 December 2014 showing little to no debris cover on the glaciers of Coropuna.
Based on the classification uncertainty estimates presented above, we conservatively assume an uncertainty of 10% for our glacierized area estimates. Paul and others (Reference Paul2013) found that measurements of the area of clean ice, such as the glaciers of Coropuna, typically have ~5% uncertainty. We note that the true uncertainty in our area estimates is likely <10% because it is highly improbable that all pixels around the ice cap margin are misclassified.
4. RESULTS
Our ice area measurements of Coropuna Ice Cap indicate that it is currently ~11 km wide (from east to west) and ~8.5 km long (from north to south) at the widest transects. To parse the ice cap into individual glaciers, we used the ASTER GDEM (available from https://earthexplorer.usgs.gov/) and the 1980 Coropuna ice outline from this study to identify individual glaciers of the ice cap and glacier centerlines following the method of Kienholz and others (Reference Kienholz, Hock and Arendt2013, Reference Kienholz, Rich, Arendt and Hock2014). In 2014, the ice cap comprised 23 glaciers and three ice domes with a maximum elevation of 6414 m. Glaciers on the north side extended to elevations as low as 5500 m, while glaciers on the south side terminated at elevations as low as 5100 m. The longest (5.2 km long) and shortest (1.0 km long) glaciers coincidentally both retreated 400 m during the 35-year study period.
Our data on aerial extent indicate that Coropuna saw a total reduction in glacierized area of 24% from 1980 to 2014, from 58.0 to 44.1 km2 (13.9 km2 lost). This equates to an average loss of 0.409 km2 a−1 (0.71% a−1) (Fig. 6). Although the glacierized area of Coropuna decreased over nearly the entire study period, it appears to have increased slightly between 2010 and 2011 (1.2 km2; +2.7%). However, manual inspection of the glacierized area maps reveals that a portion of glacier 14 (Fig. 7) incorrectly appeared to detach from the ice cap in 2010, resulting in an underestimation of the ice area that year.

Fig. 6. Landsat scenes showing best estimates of ice-surface area change at Coropuna from 1980 to 2014. (a) Image from Landsat 2 taken on 12 December 1980 with an estimated area of 58.0 km2. (b) Image from Landsat 7 taken on 13 November 2014 with an estimated area of 44.1 km2. (c) Schematic map highlighting total net change in ice areal extent (24.0%) from 1980 to 2014.

Fig. 7. Individual glacier change on Coropuna Ice Cap. (a) Individual glaciers are shown for 1980 (red) and 2014 (blue) with 2014 centerlines (black) and symbols used in Figure 8b. (b) The absolute area change of the 23 individual glaciers of Coropuna is shown by year. Glaciers on the west side are shown in black, north side in red, east side in dark blue, south side in light blue. Each glacier is also given a unique symbol.
Our estimates show that Coropuna's ice area has exceeded the area of Quelccaya Ice Cap, which has long been recognized as the largest ice body in the tropics (Thompson and others, Reference Thompson2006; Salzmann and others, Reference Salzmann2013), since at least the 1980s. The 2009 ice extent for Quelccaya was estimated at 42.8 km2 (Salzmann and others, Reference Salzmann2013), while Coropuna had an area of 44.5 ± 0.8 km2 in 2009.
Spatio-temporal variability in glacier recession was assessed by dividing the ice cap into 23 hydrologic catchments and extracting area change estimates for each (Fig. 7). Our data indicate that although glacier retreat is ubiquitous, the magnitude and timing of retreat varies across the ice cap. Of the ice cap's 23 glaciers, 18 glaciers experienced their highest average rate of area loss from 1980 to 1992. However, if we exclude the 1980 data from our analysis because of the greater uncertainty associated with the manually delineated Landsat 2 scene, we find that 11 glaciers had the highest rates of retreat from 1987 to 1996 and another 11 glaciers had the highest rates of retreat during the most recent decade (2005–2014). While some glaciers appear to have occasionally increased in area during the 1980–2014 period (Fig. 7), these apparent increases are within the estimated uncertainty for each glacier, which varies with the length of the glacier margin from 4.3% (glacier 8) to 30.1% (glacier 14).
While every glacier of Coropuna Ice Cap has retreated at least 4.7% in length during the 35-year study period (Fig. 8), the magnitude of retreat varies widely across the ice cap. In order to assess whether topography exerts a strong control over the observed, variable glacier retreat, we compared variations in area and length change over time to differences in the aspect, slope and elevation. Our data show that shorter, steeper, lower and south facing glaciers are retreating the most rapidly. But correlations are weak between the percent decrease in length and the initial centerline length (R 2 = 0.11) and mean slope (R 2 = 0.31) as well as between the magnitude of retreat and mean elevation (R 2 = 0.12; Fig. 8). All other correlations were found to have an R 2 value <0.11.
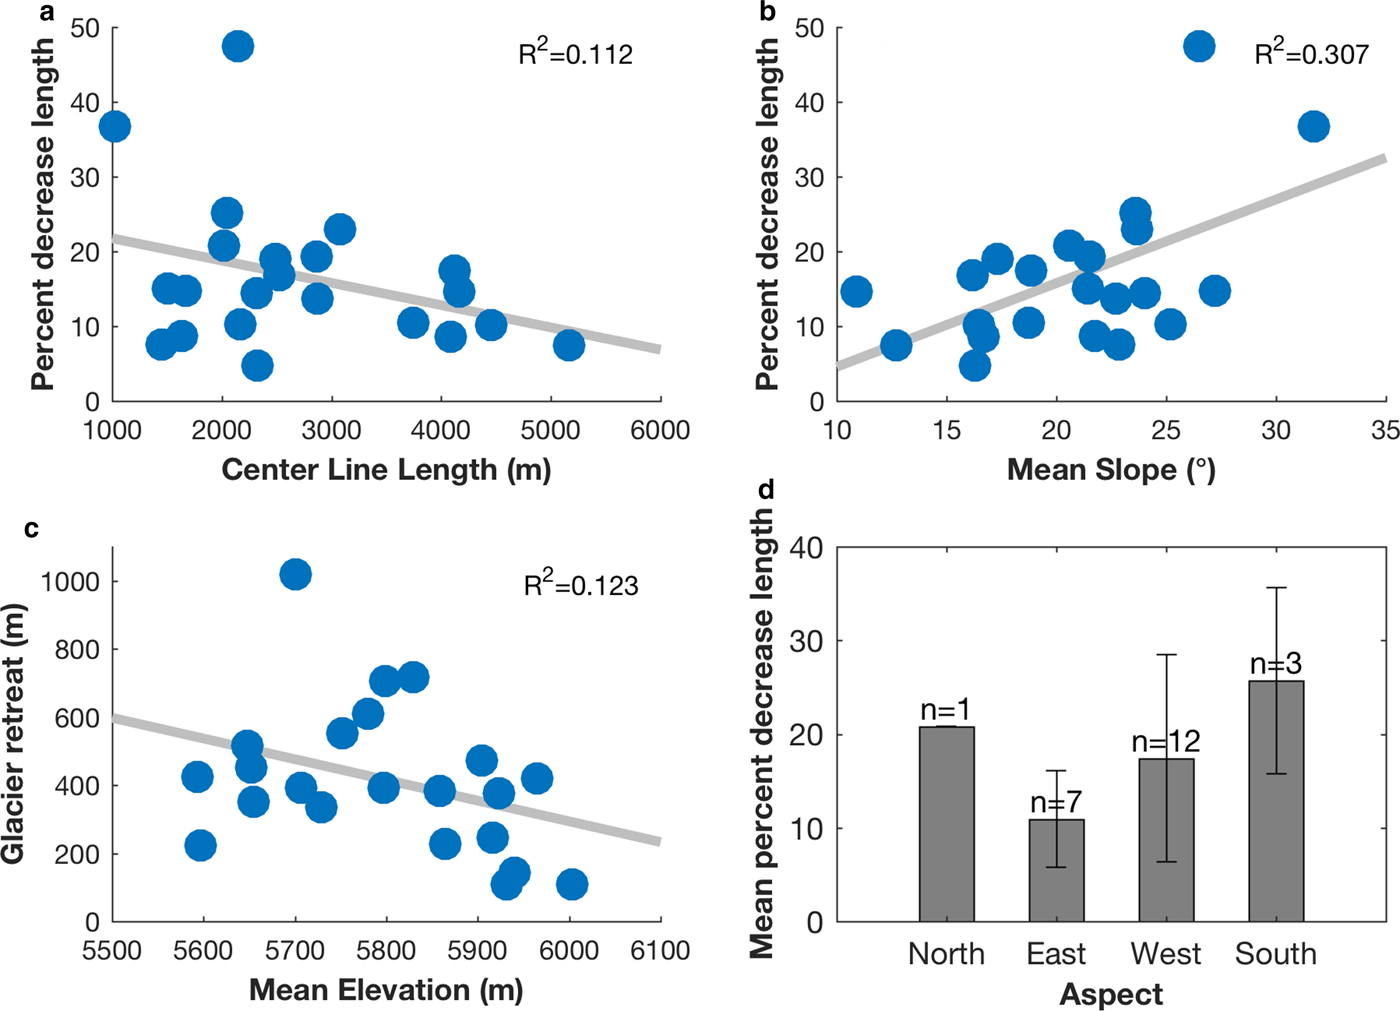
Fig. 8. Retreat characteristics of 22 glaciers. Blue points in each subplot represent individual glaciers. (a) Center line length is plotted against percent decrease in length with a gray line of best fit (R 2 = 0.112). (b) Mean slope is plotted against percent decrease in length with a gray line of best fit (R 2 = 0.307). (c) Mean glacier elevation is plotted against absolute length change with a gray line of best fit (R 2 = 0.112). (d) Glaciers are grouped into bins ranging ± 45° from cardinal direction and plotted against the mean percent decrease in length of the group of glaciers. Whiskers show 1 std dev. One glacier has become disconnected from the eastern flank of the ice cap since 1980, resulting in 0.19 km2 of stranded ice in 2014, which is excluded from these plots.
5. DISCUSSION
5.1. Area change rates
Although nine studies have previously attempted to quantify the glacierized area and rates of ice loss for Coropuna (Ames and others, Reference Ames, Evangelista, Valverde and Zúñiga1988; de Silva and Francis, Reference de Silva and Francis1990; Nunez-Juarez and Valenzuela-Ortiz, Reference Nunez-Juarez and Valenzuela-Ortiz2001; Racoviteanu and others, Reference Racoviteanu, Manley, Arnaud and Williams2007; Forget and others, Reference Forget, Thouret, Kuentz and Fontugne2008; Peduzzi and others, Reference Peduzzi, Herold and Silverio2010; Úbeda, Reference Úbeda2011; Silverio and Jaquet, Reference Silverio and Jaquet2012; Veettil and others, Reference Veettil, Bremer, de Souza, Maier and Simões2016), the results of these studies are inconsistent with each other (Fig. 2) and with what has been found at other tropical glaciers. Inspection of our NDSI-based snow and ice extent estimates for the observation dates included in these previous studies (Fig. 2) reveals that de Silva and Francis (Reference de Silva and Francis1990), Ames and others (Reference Ames, Evangelista, Valverde and Zúñiga1988), Nunez-Juarez and Valenzuela-Ortiz (Reference Nunez-Juarez and Valenzuela-Ortiz2001), Racoviteanu and others (Reference Racoviteanu, Manley, Arnaud and Williams2007), Forget and others (Reference Forget, Thouret, Kuentz and Fontugne2008), Peduzzi and others (Reference Peduzzi, Herold and Silverio2010) and Veettil and others (Reference Veettil, Bremer, de Souza, Maier and Simões2016) overestimated at least one glacierized area measurement in their time series because of the presence of seasonal snow. Silverio and Jaquet (Reference Silverio and Jaquet2012) are the most frequently cited source on Coropuna's glaciers by government agencies, yet our snow and ice covered area time series shows that they overestimate rates of glacier recession by using images blanketed by snow in early years and images with less snow in years closer to the present. For example, comparison of an image from 1 August 1985 used by Silverio and Jaquet (Reference Silverio and Jaquet2012) to an image from 5 December 1987 shows a 45% decrease in the estimation of glacier area (Fig. 9). This is physically untenable. Our analysis shows that the image from 5 December 1987 more accurately represents glacierized area because the glacial margins are not obscured by snow. Úbeda (2011) provides two new area estimates from a 1986 orthophotograph and a 2007 ASTER scene that are consistent with our findings and support our inference that the Silverio and Jaquet (Reference Silverio and Jaquet2012) results overestimate ice area in the 1980s, and thus rates of ice cap recession.

Fig. 9. Comparison of estimated ice area as a function of month. (a) Silverio and Jaquet (Reference Silverio and Jaquet2012) estimated a glacierized area of 96.4 ± 15 km2 on 1 August 1985. (b) Estimated glacierized area of 52.9 km2 on 5 December 1987 (this study). (c) Composite image shows apparent change in ice extent of 45% with December 1987 dashed outline and August 1985 solid outline.
In the most recent of the previous Coropuna studies, Veettil and others (Reference Veettil, Bremer, de Souza, Maier and Simões2016) measured annual snowlines and glaciated areas. They reported large interannual variations in glacierized area, as much as 9%, that seem highly unlikely. These unrealistic variations could be due to their use of different NDSI thresholds for each satellite image, or to the inclusion of satellite images with snow cover. We were unable to verify the inclusion of snow-covered scenes in Veettil and others (Reference Veettil, Bremer, de Souza, Maier and Simões2016) because they did not report Landsat scene identifiers, but find that their estimates of ice extent range from 4.2% greater to 13.4% less than our measurements. While they suggested that the snow minima occur between May and September, our work demonstrates that the majority of ice-minimum measurements occurred in November and December (seven each) over the 34-year (1980–2014) satellite image record. In fact, May observations are annual snow cover area maxima with peak snow cover occurring on 4 May ± 49 d (1 std dev.). We find that the snow covered area minimum is 19 November ± 28 d (1 std dev.). Therefore, it is highly likely that the large variability in Coropuna Ice Cap extent reported by Veettil and others (Reference Veettil, Bremer, de Souza, Maier and Simões2016) is not due to fluctuations in the glacier area but rather the presence of off-ice or ice-marginal snow and a changing NDSI value.
Based on the comparison of our area estimates with those of previous studies, and inspection of the images utilized by these studies, we conclude that the retreat rate of Coropuna Ice Cap has been previously overestimated because of the presence of transient snow cover, leading to anomalously rapid and variable recession rates for the ice cap relative to other high-altitude tropical glaciers. The ability to rapidly analyze the entire Landsat archive allowed us to document times of the year when snow cover was minimal and avoid snow cover errors that likely negatively impacted earlier studies. Our analysis yields rates of Coropuna Ice Cap recession that now align more closely with what we would expect for Peruvian glaciers (Fig. 10). Although the termini of some tropical glaciers are receding at rates of over 2% a−1, including Puncak Jaya (New Guinea; Klein and Kincaid, Reference Klein and Kincaid2006) and Colombian mountain ice bodies (Ceballos and others, Reference Ceballos2006), most Peruvian glaciers have documented retreat rates of ~0.5–1.5% a−1 (Fig. 10). Our area change time series suggests that Coropuna Ice Cap is receding at a rate of 0.71% a−1 on average, which is similar to the Cordillera Blanca (Peru; Fig. 10; Vuille and others, Reference Vuille2008; Baraer and others, Reference Baraer2012). However, we find variable rates of retreat between the 23 glaciers from 0.44 to 2.41% a−1 during the study period. We hypothesize that the similar recession rates for Coropuna and the glaciers of the Cordillera Blanca are due to similarities in climate in the two regions. Though sparse weather records make it impossible to thoroughly test this hypothesis, the similar elevations of glaciers, prevailing wind direction and proximity to moisture sources for the regions (Kaser, Reference Kaser1999; Vuille and others, Reference Vuille2008) make it likely that the glaciers in the Cordillera Blanca and Coropuna experience similar climate.
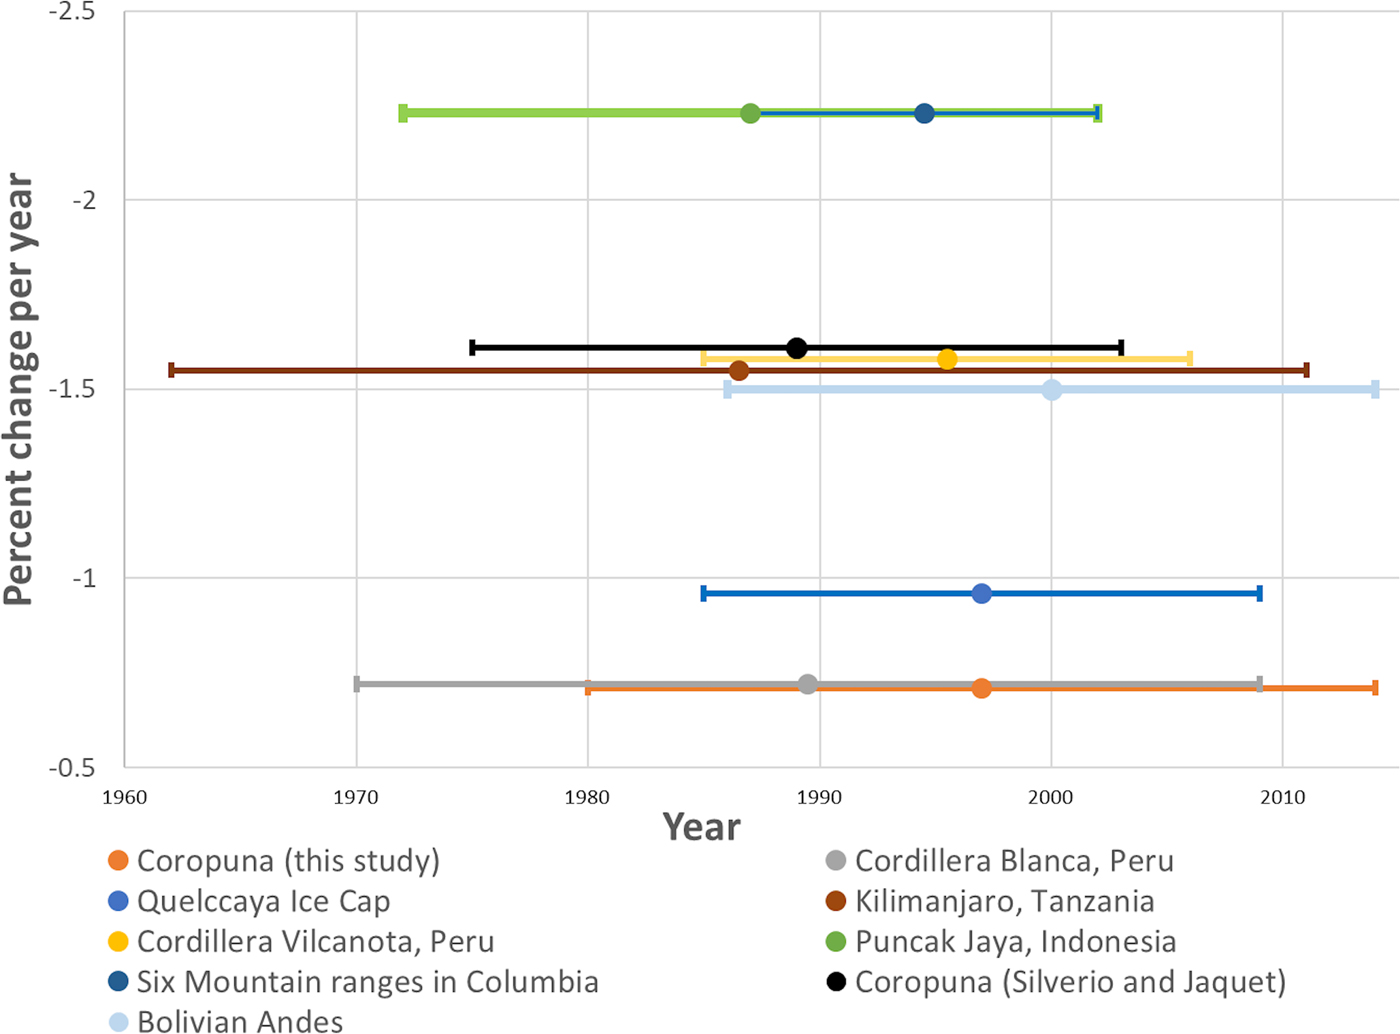
Fig. 10. Normalized shrinking rates of global tropical glaciers. Rates shown for Killimanjaro (Cullen and others, Reference Cullen2013), Puncak Jaya (Klein and Kincaid, Reference Klein and Kincaid2006), Colombian mountain ice bodies (Ceballos and others, Reference Ceballos2006), Cordillera Blanca (Baraer and others, Reference Baraer2012), Cordillera Vilcanota (Salzmann and others, Reference Salzmann2013), Quelccaya (Salzmann and others, Reference Salzmann2013), Bolivian Andes (Cook and others, Reference Cook, Kougkoulos, Edwards, Dortch and Hoffmann2016) and Coropuna (this study and Silverio and Jaquet, Reference Silverio and Jaquet2012).
While few studies have reported similar individual tropical glacier measurements as we do in Figure 8, other studies generally agree with our findings. Salzman and others (Reference Salzmann2013) and Rabatel and others (2013) both found that glaciers in the tropical Andes have higher rates of retreat at lower elevations. Additionally, Salzman and others (Reference Salzmann2013) reported that longer glaciers tend to have lower normalized rates of retreat. Our observations generally support these relationships, albeit weakly. We hypothesize that these relationships are weak because Coropuna hosts glaciers with varying characteristics and retreat rates.
The 23 glaciers that together form Coropuna Ice Cap have experienced vastly different retreat rates through time (Figs 7, 8). Although no spatial groupings of retreat rates among the 23 glaciers are obvious (Fig. 7), our results show that during the late 1990s and early 2000s almost all of the individual glaciers experienced lower rates of retreat than the previous and succeeding periods. This suggests that the ice cap as a whole experienced less melting during the late 1990s and early 2000s; however, we are unable to determine if temperatures were lower during this period due to the lack of weather station data. This spatio-temporal variability in glacier recession emphasizes the need for more detailed studies of the climate on Coropuna in order to better understand their disparate responses to climate change.
6. IMPLICATIONS FOR FUTURE WATER SUPPLY
A report from the Peru Environmental Ministry (Ministerio del Ambiente del Perú, 2010), which has been cited by the United States Agency for International Development (USAID), indicates that the Peruvian government is currently preparing for the ice cap of Coropuna to be a non-contributor to water supply by 2025 (Ministerio del Ambiente del Perú, 2010; Stark and others, Reference Stark, Guillén and Brady2012). If Coropuna meltwater production plummets, it will cause significant economic stress for populations living in this arid region, especially during dry seasons when glacier meltwater is the dominant source of fresh water (Úbeda, Reference Úbeda2011; Silverio and Jaquet, Reference Silverio and Jaquet2012). The implementation of adaptation measures for a decrease in glacial meltwater runoff from Coropuna would exacerbate stress on the developing Peruvian economy in this region (Lasage and others, Reference Lasage2015). Assuming that Coropuna Ice Cap continues to retreat at the same rate of 0.409 km2 a−1 as it has during the last 30 years, glaciers on Coropuna could potentially persist until ~2120. These results suggest that adaptation measures can likely be implemented over a longer timeframe, which may mitigate economic stress.
To derive first-order estimates of the recent contribution of Coropuna meltwater to the local water budget, we use a glaciological approach (Frenierre and Mark, Reference Frenierre and Mark2014) and assume an average ice thickness of 80.8 m (Peduzzi and others, Reference Peduzzi, Herold and Silverio2010). Previous estimates of ice loss at Coropuna (~1.4 km2 a−1) translate into an average output of 1 010 000 L of water per person per year for an estimated local population of ~100 000 people. Using this same method, we estimate that the actual water output is at most 297 000 L per person per year, given an area change rate of 0.409 km2 a−1, not accounting for the high rates of sublimation that occur in the arid tropics (Wagnon and others, Reference Wagnon, Ribstein, Kaser and Berton1999). Rates of mass loss are likely to vary tremendously between catchments due to measured differences in the rate of glacier recession (Figs 7, 8) and ice thickness (Peduzzi and others, Reference Peduzzi, Herold and Silverio2010). The impacts of glacier mass loss on local hydrologic systems and downstream populations should also vary widely with differences in the relative contribution of glacier meltwater to stream discharge and water use practices. In the Cordillera Blanca, glaciers have been estimated to provide up to 30% of annual runoff within some watersheds (Mark and Seltzer, Reference Mark and Seltzer2003). The loss of glaciers from these areas could reduce the discharge of glacially fed streams by as much as 30% during the dry season, limiting their importance as water resources (Baraer and others, Reference Baraer2012). In order to understand the impacts of the observed glacier recession on water resources and to prepare for changes in water availability in the future, we recommend that our regional meltwater runoff estimate be validated and parsed into individual catchments using in situ observations. This highlights the need for more current and precise volume change studies of the Coropuna ice cap. While Peduzzi and others (Reference Peduzzi, Herold and Silverio2010) and Racoviteanu and others (Reference Racoviteanu, Manley, Arnaud and Williams2007) have both previously attempted to estimate Coropuna volume change, their uncertainties are large. Future measurements of volume change will be immensely helpful to decision makers in the region.
7. CONCLUSIONS
From an analysis of 259 Landsat scenes, we found that Coropuna Ice Cap is shrinking at a rate of 0.409 km2 a−1. From 1980 to 2014, the ice cap has decreased from 58.0 to 44.1 km2, a 24% decrease in area. Our average area change rate is in good agreement with recession rates for other high altitude tropical ice bodies, such as the Cordillera Blanca, and suggests that Coropuna's ice cap will persist for decades longer than previous estimates. We attribute the faster and more variable rates of retreat in previous studies to the use of satellite images containing transient snow cover. This underscores the need to select images that capture the annual ice minima when using automated mapping techniques to estimate glacier area change. Although we find the average area change rate is lower than previous estimates, we note that the magnitude of retreat varies widely across Coropuna's 23 glaciers with no clear spatial patterns. Thus, it should be imperative that glacier area and meltwater runoff changes are monitored using in situ observations at the scale of individual or combined glacier catchments in order to devise more accurate predictions of glacier recession and impacts on local water resources in the coming decades.
7.1. Data availability
All Landsat and ASTER GDEM data used in this study can be obtained from the USGS Earth Explorer. ASTER GDEM is a product of METI and NASA. All products of this study have been archived with the GLIMS Glacier Database.
ACKNOWLEDGEMENTS
Kochtitzky and Edwards acknowledge Dan and Betty Churchill, the Dickinson College Research and Development Committee, and Provost Neil Weissman for funding the 2015 field season in Peru. Kochtitzky and Edwards thank the staff of the Observatorio Vulcanológico de INGEMMET for ground support. Kochtitzky and Edwards thank Lonny Thompson for useful discussions about work at Coropuna. Kochtitzky thanks James Ciarrocca at Dickinson College for his GIS advice and guidance and Christian Kienholz for his help in making the glacier outlines and centerlines. We thank Ronald Concha with the GA51 Cryosphere and Climate Change project of INGEMMET for the SPOT image. We would like to thank Simon Cook, Christian Huggel, Graham Cogley, Thomas Mölg and four anonymous reviewers for their comments on previous versions of this manuscript. We also thank the Dickinson College Research and Development Committee for financially supporting the publication of this article. Kochtitzky acknowledges the National Science Foundation Graduate Research Fellowship Program under grant No. DGE-1144205 for supporting the later stages of this project.


 Open access