


Introduction
Maternal dietary intake especially that of the pregnant women may have implications for both mother and child, because it is a key determinant of the nutritional status and depletion of nutrients during pregnancy and poses a risk factor for child malnutrition. Maternal undernutrition, including chronic energy and micronutrient deficiencies, is a leading cause of maternal and child mortality and morbidity especially in low- and middle-income countries(Reference Horton1–Reference Lartey3). It is well documented that adequate nutritional status of women, especially during pregnancy, is crucial for child survival because an undernourished mother is more likely to deliver an infant with low birth weight, significantly increasing its risk of dying(Reference Horton1,Reference Arimond, Wiesmann and Becquey4–Reference Herforth, Nicolò and Veillerette15 ).
Dietary diversity has been defined as the number of different food groups consumed over a given period of time, and the reference period can vary, but it is most often the previous day or week(13,14) . Available scientific empirical evidence suggests that dietary diversity score can be a proxy measure of household food security and/or micronutrient adequacy of diets of women of reproductive age(Reference Herforth, Nicolò and Veillerette15,Reference Herforth and Rzepa16) . So, a diverse diet of a pregnant woman is expected to improve her nutritional profile and, thus, reduce the risk of maternal and child mortality and morbidity. A pregnant woman whose diet lacks diversity is most likely to be deficient in essential nutrients, thereby depriving the foetus of the nutrition it requires to have a healthy growth(Reference Neggers and Goldenberg17,Reference Walka and Pollitt18) .
Though dietary diversity is a recognised indicator of diet quality, there is limited knowledge of how it affects the nutritional status of pregnant women in peri-urban areas of Northern Ghana. Additionally, an understanding of the association between dietary diversity and nutritional status may be confounded by other factors, including malarial infection and household socioeconomic status (SES). The present study, therefore, sought to assess dietary diversity, its determinants and relationship with the nutritional status of pregnant women belonging to different gestational ages, while controlling for potential confounding variables.
Materials and methods
Study setting
The present study was conducted in the Sagnarigu Municipality of the Northern Region of Ghana. The municipality, which is largely peri-urban, covers a total land area of 200⋅4 km2 and has a population of 163 513.
Study design, population and sampling
The present study used a cross-sectional design to collect quantitative data. All women independent of their stage of pregnancy were asked to participate in the study when they attended antenatal care (ANC) in selected health facilities.
The present study was conducted according to the guidelines laid down in the Declaration of Helsinki and all procedures involving human subjects/patients were approved by the Institutional Review Board (IRB) of the Tamale Teaching Hospital, Ghana (Ref no. TTH/10/11/15/01). Written informed consent was obtained from all subjects/patients.
The data were collected in all the three subdistricts (Taha-Kamina, Choggu and Sagnerigu) of the Sagnerigu District. The subdistrict health facilities (Choggu, Bagabaga, Garizeigu Clinic and Kalpohini Health Centres), private health facilities (Fulera maternity home and CSSH) and a CHAC facility (St. Louise) at Kpalsi were used as the data collection points.
A systematic random sampling procedure was used to select the study participants. The attendance list of the women who sought ANC services served as the sampling frame in each facility.
The sample size is determined using the formula for one-point sample estimation:

where n is the required sample size, t is the statistical uncertainty chosen = 1⋅96 at a confidence level of 95 %, p is the estimated proportion of pregnant women using diversified diet (Unknown) = 50⋅0 % and m is the margin of error at 5 % (standard value of 0⋅05). A total required sample size large enough to detect a reliable smallest difference and the relationship between the variables tested in the study was, thus, estimated as 384. Allowing for a 10 % non-response rate (i.e. 39 respondents), the overall sample was adjusted to 423 respondents.
Data collection
The data were collected from the respondents using a structured questionnaire which was administered through face-to-face interviews at the household level. Anthropometric equipment includes mid-upper arm circumference (MUAC) tape and Seca electronic adult scale. Maternal height, haemoglobin concentration (Hb) and gestational age records were retrieved from Maternal Health Record Books (ANC cards).
Maternal height was measured both as continuous and as a categorical variable with the following cut points: less than 145, 145–149⋅9, 150–154⋅9, 155–159⋅9 and at least 160⋅0 cm.
Marital status was classified as married or as unmarried if a woman was divorced, separated, widowed or never married. Maternal occupation was classified according to whether the mother was not working or was working in a manual, non-manual or agricultural profession.
Independent and dependent variables
The primary dependent variable was the nutritional status of pregnant women as measured by MUAC. The independent explanatory variable was dietary quality as measured by individual dietary diversity scores.
The covariate variables included gestational age, maternal age, height, education, occupation, SES, number under-fives in household, parity, birth interval and ANC during the current pregnancy.
Assessment of minimum dietary diversity for women
The minimum dietary diversity for women (MDD-W) was used to assess the overall dietary quality of respondents since it has been shown to indicate adequate nutrient intake(Reference Becquey, Capon and Martin-Prével6,19) and can be used as a proxy indicator for measuring nutrient adequacy among pregnant females(Reference Wen, Flood and Simpson20). The MDD-W indicator is based on a 10-food group women dietary diversity score (WDDS-10). These food groups are starch staples (grains, white roots and tubers, and plantains); vitamin A-rich vegetables and fruits; dark green leafy vegetables; other vegetables; other fruits; flesh foods (meat, fish, poultry and liver/organ meats); eggs; pulses/legumes; nuts and seeds; and dairy products. WDDS, which is based on a 24-h dietary recall period(13), was applied to characterise the average usual dietary intake of pregnant women in the study area. The women were asked to recall all foods consumed from the above food groups on the previous day. Responses were recorded as ‘yes’ or ‘no’. A ‘yes’ response was scored as ‘1’, and a ‘no’ response was scored as ‘0’. The scores were summed up to create the women DD score.
Available evidence suggests that WDDS is a good measure of household macronutrient adequacy and household nutrition insecurity. The dietary scores were classified into low and high diversity based on the MDD-W. Women having a diversity score of less than 5 were classified as having low dietary diversity and scores of 5–10 are classified in the high dietary diversity scores(21).
Additionally, the FAO validated 11-item food groups frequency questionnaire (FFQ) was used to quantify maternal dietary intake based on 7-d dietary diversity score(13). This was derived based on the number of food groups consumed from a 7-d food frequency questionnaire and included 11 food groups. The food group frequency of consumption (past 7 d) was measured for each food group by assigning a score of 0 if not consumed during the previous week, 1 if consumed on 1–3 d and 2 if consumed for at least 4 d. This composite index of dietary diversity which took into account the weekly food frequency varied from a minimum of 0 to a maximum of 22. The eleven food groups were flesh meats (i.e. beef, pork, lamb, goat, poultry, etc.), fish, eggs, milk and milk products, organ meat (e.g. liver, kidney, etc.), legumes, cereals, roots and tubers, dark green leafy vegetables, vitamin A-rich fruits and fats and oils.
Assessment of household food insecurity
Household food access was measured using the food consumption score (FCS), and it was calculated as per the World Food Programme (WFP)(22). The FCS as an index is expected to provide a more accurate measure of the quality of the household diet because it accounts for the nutritional value of food in addition to the number of different types of food consumed. The FCS is a proxy indicator of household caloric availability.
Assessment of the nutritional status of pregnant women
MUAC is often used as a measure of fat-free mass, and in the present study, MUAC was used to assess the nutritional status of pregnant women. MUAC was used as a proxy for body weight, since it is not affected by gestational age(Reference Krasovec and Anderson23). MUAC was also measured using a non-stretchable MUAC tape(Reference Cogill24). MUAC was measured to the nearest 0⋅1 cm, and values below 25⋅0 cm were classified in the analyses as an indicator of low body weight. There is presently no internationally agreed MUAC cut-offs(Reference Ververs, Antierens and Sackl25).
Determination of household economic status
A household wealth index based on household assets and housing quality was used as a proxy indicator for SES of households. Principal component analysis (PCA) was used to determine a household wealth index from information collected on housing quality (floor, walls and roof material), source of drinking water, type of toilet facility, the presence of electricity, type of cooking fuel and ownership of modern household durable goods and livestock (e.g. bicycle, television, radio, motorcycle, sewing machine, telephone, cars, refrigerator, mattress, bed, computer and mobile phone)(Reference Vyas and Kumaranayake26–Reference Howe, Hargreaves and Huttly29).
These facilities or durable goods are often regarded as modern goods that have been shown to reflect household wealth. A household of zero-index score for example means that household had not a single modern good. The scores were, thus, added up to give the proxy household wealth index.
The main aim of creating the index was to categorise households into SES groupings in order that we could compare the difference in the prevalence of maternal thinness between the groups of lowest and highest SES.
Data processing and analysis
Data were analysed using SPSS version 21 (SSPS Inc. Chicago, IL, USA) statistical software. Both (bivariate and multivariable analysis) were performed to identify risk factors of maternal underweight during pregnancy. Only variables that showed significant association (P < 0⋅05) with each dependent variable in the bivariate analysis were selected and adjusted for in the multivariable binary logistic regression analysis. Multicollinearity among the predictor variables was checked before their inclusion in the final regression model. We assessed multicollinearity among independent variables by using the variance inflation factor (VIF), which assesses increment in regression coefficients if the independent variables are correlated. VIF > 5 is an indication that multicollinearity may be present, while VIF > 10 is certainly multicollinearity among the variables. We did not have any VIF exceeding 5, indicating no collinearity. Results were presented as adjusted odds ratio (AOR) with 95 % confidence intervals (CIs) to measure the strength of association.
Results
Socio-demographic characteristics of respondents
Of the 423 respondents studied, the mean age was 26⋅8 ± 5⋅5 years with the minimum and maximum ages of 18 and 42 years, respectively. The results show that 33⋅6 % (142) of the respondents were traders, while 19⋅1 % (81) were civil servants. More than half of the respondents 52⋅7 % (223) had not obtained any formal education at all and 18⋅7 % (79) of them had tertiary level education. Most of the respondents 85⋅1 % (360) were Muslims, the majority of them 74⋅0 % (313) were Dagombas and almost all the respondents 96⋅7 % (409) were married. Most of the households 93⋅1 % (394) were headed by males and 52⋅7 % of the households had more than six members (Table 1).
Table 1. Socio-demographic characteristics of respondents (N 423)

Factors associated with MDD-W
The mean DDS of the study population from ten food groups was 6⋅3 ± 2⋅2 (95 % CI 6⋅1, 6⋅5). Based on the MDD-W, dietary scores were further classified into low and high diversity. Of the 423 women, 79⋅9 % (95 % CI 76⋅1, 83⋅7) met the MDD-W.
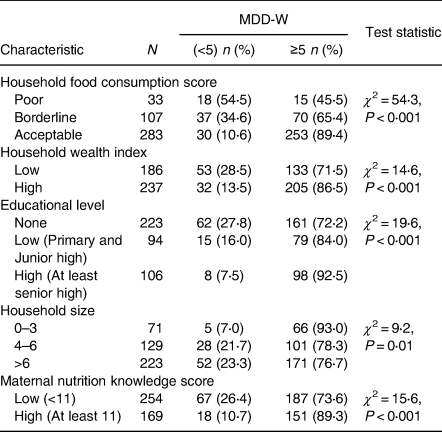
Bivariate analyses were performed to assess the association of socio-demographic and other factors with MDD-W (Table 2). Maternal nutritional knowledge, educational level and household wealth index were positively associated with MDD-W. Analysis of the type of food consumed by pregnant women in the past 24 h prior to the study revealed that there was a strong and significant negative association between household food insecurity and women dietary diversity (χ 2 = 54⋅3; P < 0⋅001). On a scale of 15, women whose nutritional knowledge score (NKS) was high (≥11) were more likely to meet the MDD-W compared with those who had a lower score (<11).
Table 2. Bivariate analyses of factors associated with women minimum dietary diversity (MDD-W)

Regression analysis showed that the low household wealth index and poor to borderline FCS were the determinants of MDD-W (Table 3). Women of low household wealth index were 48 % less likely (AOR 0⋅52, CI 0⋅31, 0⋅88) of meeting the MDD-W, while women from households of poor FCS were 88 % less likely (AOR 0⋅12, CI 0⋅05, 0⋅27) of achieving the MDD-W. However, women of low household size were three times more likely of achieving the MDD-W (AOR 3⋅07, CI 1⋅13, 8⋅39).
Table 3. Factors affecting women minimum dietary diversity (binary logistic regression)

The set of variables accounted for 22⋅2 % (Nagelkerke R 2 0⋅222) of the variability in MDD-W, an indication that other factors contribute to the dependent variable but were not measured in the present study.
Determinants of maternal underweight
The prevalence of maternal underweight (MUAC < 25⋅0 cm) among the pregnant women was 26 %. The relationship between MDD-W and the nutritional status of pregnant women as measured by MUAC was investigated. Food insecurity and not dietary diversity was associated with maternal nutritional status during pregnancy.
Household food security as measured by FCS positively associated positively with MUAC (χ 2 = 7⋅1; P = 0⋅03; Table 4). The risk of maternal underweight which reflects thinness increased as the severity of household food insecurity increased.
Table 4. Association of some variables with the maternal thinness (MUAC) during pregnancy

MUAC, mid-upper arm circumference.
Regression analysis in Table 5 showed that young age, low household wealth index and poor to borderline FCS were risk factors for maternal underweight during pregnancy. A unit increase in maternal age led to 8 % protection from being underweight (AOR 0⋅92, CI 0⋅88, 0⋅96). A unit increase in household wealth index led to 9 % protection from being underweight (AOR 0⋅91, CI 0⋅85, 0⋅97). Women from house households of poor food security were 2⋅5 times more likely (AOR 2⋅46, CI 1⋅10, 5⋅52) of being underweight, compared with their counterparts from food secured households. Compared with women of high educational level, women of low educational level were 2⋅5 times more likely of being underweight (AOR 2⋅47, CI 1⋅16, 5⋅24). The set of variables accounted for 16⋅0 % (Nagelkerke R 2 0⋅16) of the variability in maternal underweight during pregnancy, an indication that other factors contribute to the dependent variable but were not measured in the present study.
Table 5. Determinants of maternal underweight (thinness)

Discussion
The present study investigated the determinants of MDD-W and its association with undernutrition of pregnant women. The main finding was that nearly 80 % of the respondents reported having met the MDD-W. Food security and not dietary diversity positively associated with maternal nutritional status during pregnancy.
Nutritional status and maternal dietary diversity during pregnancy
In the study sample, about 26 % of the women were classified as underweight. In Africa, the proportion of women suffering from chronic energy deficiency (CED) is estimated to be in the range of 20–40 %(Reference Black, Allen and Bhutta8,Reference Black, Victora and Walker30) .
Based on the MDD-W, almost 80 % of respondents were on adequate diets. This prevalence is higher than what was reported in a study carried out in rural areas of three regions of Northern Ghana, where the diet of only 46⋅1 % of the women met the MDD-W (i.e. adequate dietary diversity)(Reference Saaka, Oladele and Larbi31). The present study was conducted in peri-urban setting of Northern Ghana and that may explain the differences.
As reported in a number of studies, the prevalence of MDD-W is generally low among pregnant women in low- and middle-income countries (LMICs), an indication of poor quality diets characterised largely by starchy staples(Reference Custodio, Kayitakire and Thomas32–Reference Ayensu, Annan and Lutterodt34).
Factors associated with MDD-W
The results of the present study showed that, while controlling for potential confounding factors in multivariable analysis, the principal constraints to achieving MDD-W were low household wealth index, household food insecurity as measured by FCS and large household size.
When there is food insecurity, individuals including pregnant women are at risk of employing coping strategies that expose them to vulnerability to dietary compromise including low intake of macro- and micronutrients, lower intake of fruits and vegetables, often leading to lack of diet diversity.
These findings collaborate that of other studies carried out in different settings including Burkina Faso, Mali, Bangladesh and Ecuador where in severely food insecure households, the likelihood of reaching MDD-W was lower(Reference Saaka, Oladele and Larbi35–Reference Custodio, Kayikatire and Fortin40). However, in rural Tanzania, no significant relation was found between the MDD-W and household food insecurity as measured by the HFIAS(Reference Huang, Sudfeld and Ismail41).
In the present study, we used the ownership of household assets as the proxy of SES, and the present results showed that women of low household wealth index were less likely of meeting the MDD-W, compared with their counterparts who were economically better. The possible explanation for this might be due to the fact that women with higher income or increased purchasing power are more likely to have diversified nutrient-dense foods as compared with pregnant women from a lower household income. This finding is in line with a number of studies conducted in many countries which have demonstrated that households of higher SES tend to have higher dietary diversity(Reference Adubra, Savy and Fortin36,Reference Chakona and Shackleton37,Reference Vakili, Abed and Sharifi42–Reference Torheim, Ouattara and Diarra46) .
Determinants of maternal underweight
Significant consistent risk factors contributing to maternal underweight were young maternal age, poor to borderline food insecurity, low socioeconomic standing as measured by household wealth index and low educational level of the mother.
SES of the household was a significant factor affecting the nutrition status of the respondents. There is a greater possibility that, the wealthier the household is, the more likely it is that its members will be well fed. The results of the present study are in agreement with and confirmed that of earlier studies that women of low socioeconomic background are generally likely to be underweight(Reference Amugsi, Dimbuene and Bakibinga47–Reference Nguyen, Avula and Ruel50).
No significant relationship was found between minimum dietary diversity and underweight of the pregnant women in the present study. This could be attributed to the fact that maternal thinness is more an outcome of energy balance than micronutrient status that is influenced by the intake of diverse diets. Diverse diets are expected to be associated more with adequate macro- and micronutrients intakes(Reference Smith, Ruel and Ndiaye51,Reference Steyn, Nel and Nantel52) . In view of the fact that the arm contains both subcutaneous fat and muscle, changes in MUAC can reflect a change in muscle mass, a change in subcutaneous fat, or both. However, in resource-poor settings, changes in MUAC are more likely to reflect changes in muscle mass and can, therefore, be useful as an indicator of protein-energy malnutrition or starvation(Reference Tang, Chung and Dong53,Reference Kumar, Sareen and Agrawal54) but not necessarily micronutrient deficiency which diversity largely reflects.
Though dietary diversity contributes to increased intake of nutrients among adults(Reference Cruz, Azpeitia and Súarez55,Reference Arimond and Ruel56) , this may not necessarily impact muscles development and so little effect on maternal thinness will be realised. This may explain the lack of association between dietary diversity and maternal thinness in the present study. It could also be due to the fact that dietary diversity was assessed over a period of just 24 h and that may not reflect habitual dietary intake. Maternal thinness develops over a longer period of time and thus precedes the measurement of dietary diversity. The relationship can, thus, be investigated in a longitudinal study design and not a cross-sectional study. The findings of our study notwithstanding, micronutrient malnutrition has been reported partly due to the consumption of monotonous, cereal-based diets that lack diversified(Reference Smith, Ruel and Ndiaye51).
The relationship between dietary diversity (DD) and maternal nutrition status remains inconclusive. While some studies conducted in many settings including Burkina Faso have demonstrated positive effects of DD on maternal nutritional status(Reference Savy, Martin-Prével and Sawadogo57–Reference Savy, Martin-Prével and Traissac60), others have found no significant association between DD and women's anthropometric status(Reference Savy, Martin-Prével and Danel61). An earlier cross-country study in Ghana, Namibia and Sao Tome and Principe provided evidence that DD score was significantly and positively associated with maternal BMI (kg/m2) in Ghana but not in Namibia and Sao Tome and Principe(Reference Amugsi, Dimbuene and Bakibinga47), a finding that suggests the relationship may be context-specific. The association in Ghana was observed among women at the 90th quantile of wealth index. In our sample of pregnant women from Northern Ghana, we were unable to find any significant relationship between maternal underweight as measured using MUAC.
Food insecurity was negatively associated with maternal nutritional status during pregnancy. The risk of maternal thinness increased as the severity of household food insecurity increased. There is a great possibility that a woman who lacks dietary diversity may not have problems with energy intake. Therefore, a woman who is food secure may be protected from energy deficiency and consequently not at risk of becoming waste. This perhaps explains why food insecurity was significantly and positively associated with maternal thinness while dietary diversity was not. This relationship is reported by several other studies carried out in different settings including Cambodia(Reference Weigel, Armijos and Racines38,Reference Tsegaye, Tamiru and Belachew62) .
The present study found that low educational level was a significant risk factor for maternal thinness (underweight). This finding that lower education is a risk factor of underweight is in agreement with previous studies carried out in sub-Saharan Africa which have shown clearly the significant positive association of women's education with maternal nutritional status(Reference Amugsi, Dimbuene and Bakibinga47,Reference Woldemariam and Genebo63–Reference Omilola65) . It is expected that women of higher educational level may have better employment opportunities and will therefore be richer, making them less prone to food insecurity. It has also been documented that education may empower women to make independent decisions and to have greater access to household resources that are important to nutritional status(Reference Woldemariam and Genebo63,66) .
Conclusion
The results of the present study showed that food insecurity as measured by FCS and not poor MDD-W, associated with mothers’ underweight during pregnancy in peri-urban setting of Northern Ghana.
Limitations of the study
There are some limitations that are worthy of note. Dietary diversity was assessed based on responses obtained from participants (e.g. 24-h dietary recall) during the pregnancy and this depended on memory and their ability to recall accurately. Recall bias could not be ruled out completely because such data tend to under- or overestimate actual food consumption due to several reasons including forgetfulness(Reference Thompson, Subar, Coulston, Boushey and Ferruzzi67).
Though the 24-h dietary recall used minimises recall bias, it has not got the capacity to measure usual dietary intake. The cross-sectional study design used to collect data also makes it difficult to demonstrate cause-and-effect relationships.
Acknowledgements
We are thankful to the data collection team members for their hard work and commitment. The data could not have been obtained without the cooperation and support of the mothers and caregivers who took time off from their busy schedules to respond to the interviewers. Their involvement and cooperation are highly appreciated.
M. S. conceived of the study, participated in its design, did the analysis and interpretation of data. S. M. developed the questionnaire, data collection and data entry. S. O. M. entered data, analysed data and drafted manuscript. All authors contributed to the data interpretation, critical revision of the manuscript, read and approved the final manuscript.
There are no conflicts of interest.


 Open access