


For the millions of Americans who participate in employer-provided retirement plans, one of the most important economic decisions they make is how to drawdown their pension assets. Distribution options are regulated by federal regulations, and the choices available to retiring workers differ between defined benefit (DB) plans and defined contribution (DC) plans (such as 401(k), 403(b), and 457 plans). Payout options also vary across plans based on how plan sponsors formulate their retirement plans' structure. In general, distribution options tend to differ in terms of whether retirees can take lump sum distributions versus a range of phased withdrawal plans, including, in some cases, lifetime income annuities.
The goal of this paper is to examine the distribution options offered to and chosen by plan participants, drawing on a national survey of Americans age 45–75 in 2020. We are aware that payout options tend to differ between DB and DC plans, and the value of the benefits typically shown to participants can differ between the two types of plans. Accordingly, in our analysis, we explore distribution decisions separately between persons who either plan to receive or have received a distribution from a DB versus a DC plan. Moreover, in some cases, retirees may have both types of plans and select a different payout option from each. The specific questions we address include:
• Do participants leaving DB plans make different distribution choices compared to participants leaving DC plans?
• Do more financially literate individuals tend to select annuities as payouts, more often than do their less sophisticated counterparts?
• Do high-income workers make different distribution choices from those of low/middle-income workers?
• Are there significant differences in pension payout choices by race, sex, and level of impatience?
In what follows, we first review distribution options available to retirees in modern DB and DC plans. We then offer a brief literature review on retirement plan distribution patterns offered to retiring employees. This is followed by a section describing the survey data used in our analysis of the type of pension distributions. We also estimate multivariate regression models describing DB and DC participants' choice of distributions. Finally, we separately examine individuals that had already received a distribution from those who are anticipating a future distribution. Our evidence indicates that participants in DB plans are more likely to elect an annuity, compared to workers in DC plans, on receiving a pension distribution. Moreover, annuities are particularly favored by individuals in DB plans who anticipate future retirement plan distributions. This pattern of distribution choice may be due to different worker preferences for annuities by retirees in the two types of plans, a difference in the framing of the payout choices and the default options in the plans, or workers having selected jobs with their preferred distribution options. Additional key findings include people with higher levels of financial literacy were less likely to be uncertain about the basic facts about their retirement plans. Older individuals were more likely to select an annuity, whereas Nonwhites and Hispanics/Latinos were less likely to choose annuities from DB plans and high-income individuals covered by DB plans were more likely to select annuities compared to those in DC plans.
1. Retirement plan distribution options
During much of the 20th century, DB plans were the dominant type of retirement plan offered by US employers. In such plans, benefits tended to be based on a formula which typically depended on the worker's final average earnings, years of service, a generosity parameter, and the worker's retirement age.Footnote 1 Retirees' monthly retirement benefits were generally paid as single life annuities for live. As a result, workers covered by DB plans traditionally perceived their benefit streams as ‘lifelong paychecks’.Footnote 2 Currently, DB plans must also offer a joint and survivor's (J&S) annuity as the default annuity option, unless the retiree's spouse agrees to the single life annuity.Footnote 3 The J&S monthly benefit is calculated to be worth the same expected present value as the single life annuity.
Over time, DB plans have also increasingly offered lump sum distributions, as an alternative to a life annuity.Footnote 4 While the lump sum benefit payable is often described as equivalent to the expected present value of the single life annuity, employers have some leeway regarding the choice of assumptions used when setting lump sum values.Footnote 5 Additionally, of late, many US corporate DB plans have actively sought to de-risk their balance sheets, partly due to the cost-savings the parent firms then recognize (Bauer, Reference Bauer2019). Indeed, providing retirees with lump sum distributions can save plan sponsors money, by reducing both management and insurance costs. A recent discussion (Saber and Associates, 2019: np) indicated that ‘larger corporate Plans often will not provide a single sum distribution option unless the payout is nominal or the Plan is a Cash Balance Plan. Smaller Defined Benefit Plans, on the other hand, typically allow lump sum distributions for all participants. This is especially true for Cash Balance Plans’. If the single lump sum option is available and elected by participants leaving the plan, the individual may extend their tax deferral period by rolling over the plan distribution to an Individual Retirement Account (IRA). Alternatively, the lump sum payouts may be received and retained by the participant, in which case, income (and possibly excise) taxes will apply.
By contrast, DC plan benefits are based on employer and employee contributions, plus the returns earned on account balances during participants' work lives. Each year, the account balance is reported to the worker, and at retirement, the participant gains access to the account. Most plans offer a single lump sum payment of the entire account balance, which the retiree can withdraw from the plan. Some plans also offer a variety of installment payment options and partial withdrawals, so the retiree may retain some money in the plan to comply with the legal required minimum distribution (RMD) rules (Horneff et al., Reference Horneff, Maurer and Mitchell2021). Specifically, the RMD regulations stipulate that retirees age 72 or older must take a certain percentage of their tax-qualified assets and pay income tax on the withdrawals, if they are to avoid a 50% penalty.Footnote 6
A few plans do offer retirees the option of converting their DC funds to life annuities within the plan.Footnote 7 The method chosen by retirees to access the value in their DC plans will then depend on the distribution options offered by the plan, as well as retirees' preferences. Generally speaking, most studies of pension distribution choices have been unable to disentangle the demand and the supply effects.
Concerning payout options available in DC plans, the US GAO (2016) reported that fewer than one-quarter of DC plans it surveyed offered retirees a within-plan annuity, and only about one-third included some type of a withdrawal option other than a rollover; these included installment payments, systematic withdrawals, and managed payout funds. Over three-quarters of Vanguard DC plans in 2017 required terminated participants to take a distribution of their entire account balances, if they sought any distribution at all (Proctor and Young, Reference Proctor and Young2019). Alight Solutions (2017) reported that among individuals terminating employment between 2008 and 2017, 40% cashed out their entire DC balances, while 26% rolled over their funds to another qualified plan; only 26% retained some of their assets in their plans.Footnote 8 Responding to the COVID-19 pandemic, the US Congress passed the 2020 CARES Act which permitted employees negatively affected by the coronavirus to take early withdrawals of up to $100,000 from their retirement accounts even if they were younger than age 59.5, without paying the previously levied 10% early withdrawal penalty (Paller, Reference Paller2021). Such withdrawals were, however, subject to income tax (over a 3-year period). This provision was terminated for most employees in 2021 (Mitchell, Reference Mitchell2021).
In contrast to retirement plans in the private sector, most public pension plans continue to be of the DB variety, and many public sector retirees tend to elect one of the annuity options made available.Footnote 9 Aubry and Wandrei (Reference Aubry and Wandrei2021) reported that 88% of state and local workers were covered by traditional DB plans. Here, and also in cash balance plans, an annuity was the default payout option. By contrast, those authors reported that among public DC plans, an annuity was never the default distribution; moreover, some DC plans did not even offer an annuity option. Abashidze et al. (Reference Abashidze, Clark, Hammond, Ritter and Vanderweide2021) provide a review of the type of retirement plans offered by states and the benefit options included in these plans.Footnote 10
2. Related literature on pension distributions
Relatively few academic studies have explored how retirees take their benefits given a choice, particularly from DC plans. Roy and Hahn (Reference Roy and Hahn2021) examined an EBRI database on 31,000 people who entered retirement between 2013 and 2018, and they concluded that most younger retirees (80%) did not take distributions prior to the age they were required to under the RMD rules. Moreover, 84% of older retirees withdrew only the amount required by law.Footnote 11 This approach is surely not fail-safe, since retirees following the RMD rule can easily overspend and run out of money, or if they do not withdraw enough, they may under-consume. Data on DB plan distributions are also scarce: Banerjee (Reference Banerjee2013) noted that all corporate DB plans must offer a lifetime income option (annuity), but the majority also provided a lump sum option in his analysis of 84 ERISA plans between 2005 and 2010, and in that dataset of participants age 50–70, ‘somewhere between 53 percent and 70 percent of participants chose to have annuity payments’ (p. 7). Participants with very small accounts (<$5,000) were much less likely to annuitize (6.3%), while participants having accounts with at least $25,000 in assets were more likely to annuitize (97.5%). Younger workers were far less likely to take the annuity option.
A recent Vanguard (2021) study of 4.7 million participants in 1,700 tax-qualified DC plans for which the firm provided recordkeeping services indicated that all plans allowed former employees to defer their withdrawals if their account balances exceeded a specific threshold (usually $1,000; see Figure 112, p. 108).Footnote 12 Over 70% permitted ad hoc partial distributions, and 80% allowed former employees to take installment payments other than RMDs. Only 14% offered an annuity from the plans. Interestingly, those data also indicated that, in 2011, 54% of terminating participants left their assets in the plans upon termination, but by 2020 the proportion had grown to 63%.Footnote 13 Overall, the report found that participants with smaller account balances were more likely to cash out, whereas over 90% of participants preserved their assets if they had accounts worth $100,000 or more. Clark et al. (Reference Clark, Hammond and Vanderweide2019) examine the annuity choices of public sector retirees in North Carolina and found that men were significantly more likely than women to select J&S annuities.
Other research on withdrawal patterns from DC plans has emphasized that how people perceive their plan distributions is powerfully affected by their financial literacy levels. For instance, Brown et al. (Reference Brown, Kapteyn and Mitchell2016) showed that less knowledgeable retirees were particularly susceptible to alternative ways to frame the benefit claiming age, and Brown et al. (Reference Brown, Poterba and Richardson2021a, Reference Brown, Kapteyn, Luttmer, Mitchell and Samek2021b) reported that the less financially literate undervalued annuities. Brown et al. (Reference Brown, Poterba and Richardson2017a, Reference Brown, Kapteyn, Luttmer and Mitchell2017b) also documented that more cognitively-adept people did a better job of understanding the value of annuities, as they were willing to pay for a small annuity at about the same price as they could sell the identical annuity. Persons with less education, weaker numerical ability, and less financial literacy were less consistent in their decision making. In sum, for both DB and DC plans, plan-specific design features as well as participant characteristics shape how people take pension withdrawals. The evidence indicates that retirees are more likely to request annuities when they are more educated. In addition, older retirees and more highly paid individuals are more likely to prefer annuities to lump sum distributions. Our analysis builds on these earlier studies by focusing on these personal characteristics, along with examining differences by race and gender.
3. Data used in the analysis
To address how a current group of older Americans behaves with regard to real-world retirement plan withdrawals, we designed and fielded a survey of individuals age 45–75 in May/June 2021 in conjunction with the Understanding America Study (UAS). The UAS is a nationally representative online longitudinal study fielded by the University of Southern California.Footnote 14 Our survey module was sent to the 2,903 individuals who had agreed to be part of the UAS panel, and 2,510 individuals responded to this survey for a response rate of 86.1%. The UAS also contains considerable information on the economic and demographic characteristics of the respondent's household, which we merged in from other UAS waves. All analyses use weights provided by UAS.
To meet our objectives, we developed a series of questions focusing on whether the person had received or expected to receive a pension distribution, whether this distribution was from a DB or a DC plan, and the type of distribution received. First, we asked respondents ‘Have you ever received a distribution or payout from an employer retirement account such as a pension plan (defined benefit plan) or a retirement saving account (such as 401(k), 403(b), 457 plan)?’. Table 1 (panel A) shows that 867 of the 2,470 individuals answering this question indicated that they had already received a distribution from an employer retirement plan.Footnote 15 Persons who had not yet received a distribution or responded that they ‘did not know’ were then asked ‘Do you expect to receive any money or payments from an employer-provided pension plan or retirement account in the future?’. Panel B documents that 633 of those individuals stated that they expected to receive a future distribution. Since some respondents are covered by both DB and DC plans, taking this dual coverage into account,Footnote 16 we found that 1,500 respondents (or 60.7%) had received or expected to receive a distribution from an employer retirement plan.
Table 1. Pension distributions in UAS survey

Naturally, there are major differences between DB and DC plan payout options, as are the ways in which the value of pension benefits is presented to retirees. Accordingly, we separately examine the choice of distribution for individuals covered by each type of plan. Panel C shows the proportion of our sample that had received or expected to receive a distribution for DB and DC plans, along with the proportion that had already received or expect to receive a distribution from both types of plans. As expected, based on the long-term shift toward DC plans, we observe that a larger percentage of pension participants had received or expected to receive a distribution from a DC plan compared to a DB plan, and the difference was much larger among individuals expecting to receive a future distribution, compared to past recipients.Footnote 17
We next examine the distribution choices of those who had already received a plan benefit and then compare these choices to the responses of those who expected to receive a future distribution. Table 2 (panel A) shows that over two-thirds of those who had received a benefit from a DB plan selected a single life or a J&S annuity, with a majority of these choosing the former. On average, the DB monthly benefit for those taking a single life annuity was $2,224, and it was higher ($3,158) for those taking a J&S annuity. This indicates that individuals with larger account balances are more likely to select a J&S annuity. About one-quarter of these DB beneficiaries selected some type of lump sum distribution, and on average, participants reported that their lump sum distribution totaled $133,394.
Table 2. Distributions received

By contrast, among DC plan beneficiaries, most had withdrawn some (25.6%) or all (44.1%) of their retirement funds (see panel B). Those electing to take all their retirement assets as a lump sum had an average payout of $108,674, while those taking only a partial distribution received an average payment of $64,559. Only 13% of the DC participants purchased annuities with their payouts, with 9% electing a single life annuity averaging $998 per month, and 4% buying a J&S with an average monthly benefit of $1,099. Interestingly, 17% of those receiving a DC distribution indicated that they did not know what type of distribution they had elected.Footnote 18
Turning to those who expected to receive a pension benefit in the future, results are similar. Almost three-quarters of those expecting a DB plan distribution anticipated an annuity benefit, paid either as a single life (53%) or a J&S (20%). Only 4% expected to receive a lump sum distribution of their entire accounts (Table 3, panel A). More complex distribution processes applied to DC plan participants. Almost one-half (46.1%) of those expecting a DC distribution indicated that they did not know what type of distribution they would request or receive; see panel B.
Table 3. Pension distributions expected
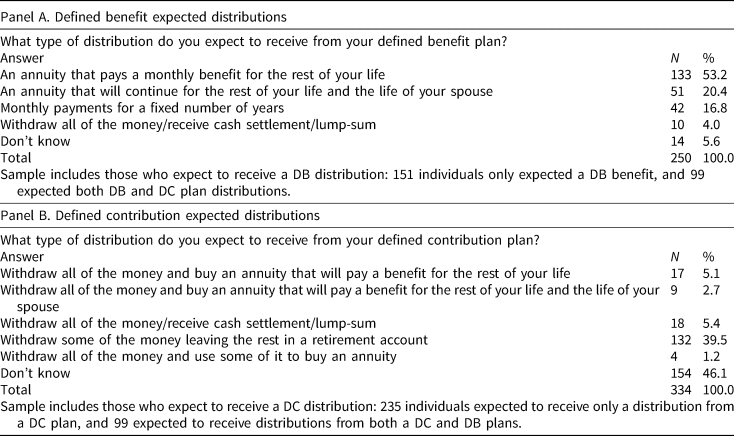
Table 4 summarizes the distribution of respondents based on the type of pension plan reported and the form of distribution received or requested. Consistent with prior studies (e.g., Mitchell, Reference Mitchell1988), the survey confirms that many respondents lack understanding concerning their retirement benefits. One-quarter of the 1,500 individuals who indicated that they were covered by a retirement plan did not know the type of plan in which they participated.Footnote 19 Of the 1,133 respondents who knew their plan type, 19% did not know what type of distribution they had received or were expecting to receive. In the following analysis, we examine the determinants of this lack of knowledge concerning employer pensions.
Table 4. Type of plan and distribution choice: number of respondents by category

Sample includes all respondents who indicated that they had received or expected to receive a distribution from an employer pension plan (a total of 1,500). DK means respondent indicated ‘Don't Know’ to type of distribution from pension plans.
As shown in the earlier tables, DB participants who had received a distribution were much more likely to have received an annuity (70.8%) or to expect an annuity (77.5%), compared to participants in DC plans (12.2% received, 7.7% expected). In addition, participants in DC plans were much more likely to report a lack of knowledge about the type of distribution they had received and were more uncertain about the type of distribution they expect to request in the future. Almost one-fifth of respondents who knew their type of plan reported that they were covered by both a DB and a DC plan. These dually-covered participants were much more likely to have received or expected to receive an annuity from the DB plans (65.4%), compared to the distribution from their DC plans (11.4%).
We examine the factors associated with respondents who did not know the type of plan in which they participated and the type of distribution they have received or expect to receive, since understanding basic pension characteristics is necessary if individuals are to make optimal retirement decisions. Next, we estimate distribution choices by respondents that know the type of plan in which they participate. This sample includes individuals who are covered by only one plan (either DB or DC) as well as those covered by both plan types. Because preferences for specific distributions may differ for those covered by both plans compared to individuals participating in only a single pension, we estimate distribution choices for those who have only a DB or only a DC plan.
4. Respondent demographic and economic differences by pension type
Why are there such large differences observed between retirees in DB and DC pension plans in terms of the payout options elected? One natural explanation is simply that the distribution choices offered to retirees tend to differ between the two plans, so many individuals may merely be electing from among the options offered to them. DC plans typically do not offer within-plan annuities; nevertheless, retirees could take lump sum distributions and then purchase annuities on their own. A related concept is that pension wealth is framed differently between the two plan types: thus, DB plans typically show workers their projected lifetime benefit payments, while DC plans generally show the value of the pension as an account balance.Footnote 20 Accordingly, retirees may simply be accepting the ‘default’ benefit offered by the plan.
Another possibility is that the preferences of employees covered by DB plans could differ compared to those in jobs with DC plans. If such selection were important, the type of pension offered might be a factor prompting workers to select one type of firm over another. For instance, some have argued that intrinsically more stable workers would choose jobs rewarding low mobility, such as DB plans, whereas more mobile employees might choose jobs with DC plans which penalize mobility less (e.g., Allen et al., Reference Allen, Clark and McDermed1993). We should note that, in the United States, relatively few employers give workers a choice about whether they wish to be covered by a DB or a DC plan on the same job.Footnote 21
To examine workers' choices of pension distribution type, we report the results of multivariate regression models examining the types of distributions received and anticipated by our survey respondents.Footnote 22 Control variables include age, race/ethnicity indicators, levels of schooling, female, currently married, income, degree of impatience, and a financial literacy index based on the number of correct answers to three key questions; descriptive statistics appear in Table 5. In comparing the means for those with a pension plan to individuals not covered by a plan, it is clear that whites, males, the higher-income, better-educated, and married respondents were more likely than others to have received or expected to receive a pension benefit, whether from a DB or a DC plan.Footnote 23 In addition, pension participants scored higher on our financial literacy index and had lower levels of impatience. Earlier, we saw that almost one-third of those covered by a pension did not know whether they were covered by a DB or a DC plan. Those who did not know their plan types were more similar to those without a pension, than to those covered by either type of plan, as they scored lower on financial literacy, had lower annual income, were more likely to be female, were more impatient, and were less educated.
Table 5. Means and standard deviation for explanatory variables (weighted data)

Sample includes all individuals in UAS378 who were asked whether they had received or expected to receive a distribution from an employer pension plan (2,837 individuals). Of these, 1,500 reported that they had received or expected to receive a distribution from an employer retirement plan. Appendix Table A1 reports p-scores and levels of significant differences.
We measure financial literacy using an index counting the number of correct answers to ‘Big Three’ questions widely used in numerous recent studies to gauge understanding of compound interest rates, inflation, and compounding (Lusardi and Mitchell, Reference Lusardi and Mitchell2014). Individuals who received or expected to receive a pension payout had a mean number of correct answers of 2.6, compared to the mean score of 2.0 for individuals not covered by a retirement plan. We calculate peoples' impatience using responses to a series of questions concerning choices of different amounts of money that could be received today versus a year from today.Footnote 24 Using the algorithm in Huffman et al. (Reference Huffman, Maurer and Mitchell2019), a respondent's measured degree of impatience could range between 0.03 and 0.93, with higher values indicating a higher personal discount rate. Those with no pension had a far higher level of impatience (0.407) compared to workers covered by a retirement plan (0.28 for those with a DB plan and 0.30 for DC plan participants).
Table 5 also compares these characteristics by whether the individual was covered by a DB only, covered by a DC plan only, covered by both types of plans, or covered by a retirement plan where the respondent did not know what type of plan it was. In general, the means are fairly close between the groups, though some important differences are noteworthy. For example, DC participants were more likely to be nonwhite and female, less educated, and lower income. These differences in demographic and economic characteristics may partially explain why DC participants were less likely to request an annuity at retirement.Footnote 25
5. Factors affecting pension distributions
The choice of distributions from pension plans is a function of the type of plan offered to workers and the preferences of retiring workers. To further examine the plan payout choice, we first estimated the likelihood that individuals knew their type of pension plan using the full sample of individuals expecting to receive a distribution from a retirement plan. Next, we estimated the distributional choices of all individuals who knew their plan type and had received or expected to receive a pension distribution including those uncertain of the type of distribution. Because preferences may differ depending on whether the individual was covered by one or both types of plans, we estimated distribution choices separately for individuals covered by only one plan, either a DB or a DC plan.
5.1 Worker knowledge of pension plan type
As discussed above, respondents in the UAS378 module were asked whether they had received or expected to receive a pension distribution. Those responding yes were then asked about the type of plan providing such a distribution. Of the 1,499 individuals, 367 did not know whether they were covered by a DB or a DC plan. Since knowledge of pension plan is important to this analysis, we estimate a logit model on the likelihood of respondents not knowing the type of pension plan from which they expected a distribution. Marginal effects are reported in Table 6.
Table 6. Marginal effects from probit equations for unknown plan type (weighted data)

Standard errors in parentheses.
Sample includes all respondents that indicated that they had received or expected to receive a distribution from an employer pension plan. The dependent variable is equal to one if the respondent did not know what type of plan covered them; zero otherwise. Reference categories are individuals that received a distribution from a DB plan, white, high school education or less, male, nonmarried, and annual income of $50,000–$99,999.
***p < 0.01, **p < 0.05, *p < 0.10.
The first column of Table 6 underscores the importance of financial literacy on the knowledge about one's retirement plan. Each additional literacy question answered correctly is associated with an 8.4 percentage point lower probability of not knowing the plan type. Measured against the mean of 26% not knowing their plan type, higher levels of financial literacy substantially increase the likelihood that pension participants have some basic knowledge of their retirement plans. As one might expect, individuals with higher income and education were also more aware of the pension plan characteristics. Women were 11 percentage points more likely to be unaware of their type of plan.
The second column of Table 6 reports marginal effects of the key control variables for individuals who had received or expected to receive a pension distribution but who did not know the type of distribution. Older workers are significantly less likely to be unaware of the type of distribution from their pensions, as are individuals with annual incomes in excess of $100,000. Once again, women are more likely to indicate that they do not know the type of distribution they received or expect to receive from their retirement plan.
5.2 Distribution choices of pension covered workers
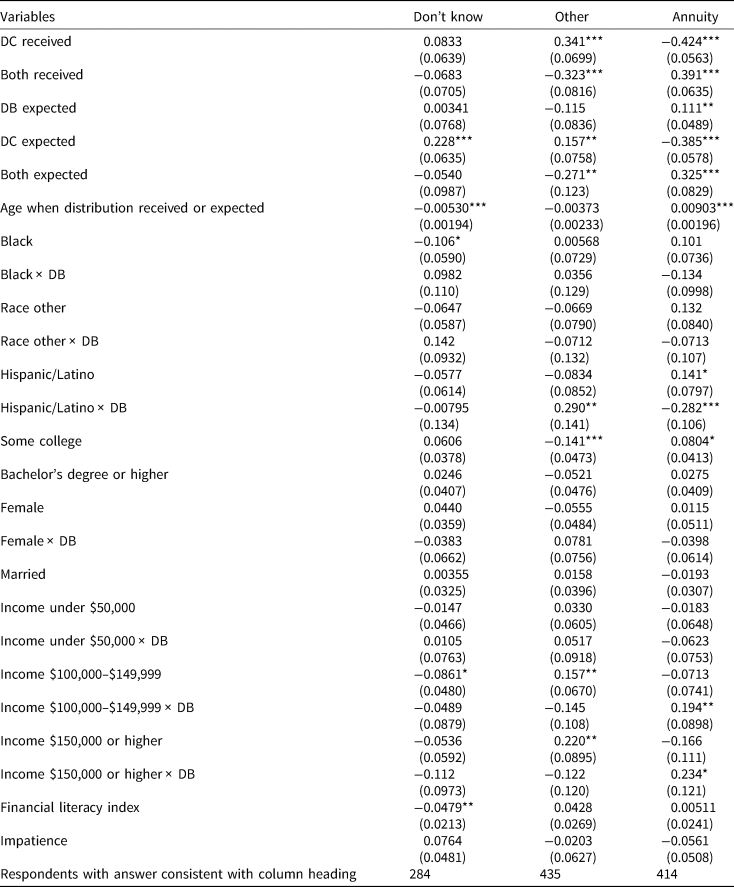
Next, we use a multinomial logit model to estimate the variables associated with pension distribution choices. The sample includes individuals covered by a DB plan only, a DC plan only, and respondents with both plan types. Since we expect the selection of distributions to differ by plan coverage and by whether the distribution had already been paid or was expected, the analysis includes individual dichotomous variables indicating whether the individual was covered by a DB plan only, a DC plan only, or both plans, and whether the benefit had already been received or was anticipated. The reference category is DB received. The dependent variables include received an annuity (either single life or joint life),Footnote 26 any other type of distribution, or the individual did not know the type of distribution received or expected. Again, marginal effects are reported.
The results presented in Table 7 illustrate the importance of being in a DB plan compared to a DC plan. Relative to having already received a distribution from a DB plan, individuals that selected a distribution from a DC plan were 42.4 percentage points less likely to have chosen an annuity. Similarly, those expecting a DC distribution were 38.5 percentage points less likely to anticipate an annuity, while those expecting a DB distribution were 11.1 percentage points more likely to anticipate an annuity, compared to DB participants who had already received a distribution. Individuals covered by both plan types were 32–39 percentage points more likely to select an annuity, compared to those that had already received a distribution from a DB plan alone. The results indicate the substantial differences in distribution choices by plan type while holding personal characteristics constant and allowing the response to these characteristics to vary according to plan type.
Table 7. Marginal effects from multinomial-logit on type of distribution for respondents with a DB plan or a DC plan or both (weighted data)
Standard errors in parentheses.
The sample includes respondents who reported that they were covered by either only a DB plan, only a DC plan, or both plans. Individuals did not know their type of plan are excluded in this analysis. The three dependent variables shown at the top of each column indicate the following: Don't know indicates that the individual did not know the type of distribution they had received or expected to receive, Other means that the respondent took a distribution that was not an annuity, Annuity indicates that the respondent selected either a single life or joint and survivorship annuity.
Total sample size is 1,133. Reference categories are individuals that received a distribution from a DB plan, white, high school education or less, male, nonmarried, and annual income of $50,000–$99,999.
***p < 0.01, **p < 0.05, *p < 0.10.
The model also includes a series of interaction terms reflecting whether respondents were covered by DB plans.Footnote 27 We find that similar individuals made different choices, depending on whether they were covered by DB or DC plans. Individuals with incomes above $100,000 were more likely to accept an annuity from a DB plan and less likely to opt for an annuity if covered by a DC plan. Consistent with prior studies, older individuals were more likely to take annuities; each additional 10 years of age is associated with a one percentage point increase in the probability of choosing an annuity.
5.3 Distributional choices for individuals covered by only one retirement plan
As shown in Table 4, 408 respondents covered only by a DB plan had received or expected to receive a distribution from it, while 514 individuals were covered only by a DC plan. A direct comparison of the choices between participants in DB and DC plans is important to understanding the role of plan offerings vis-a-vis individual preferences. To address this issue, we estimate the choice of a pension distribution using a multinomial logit model. The dependent variables include (1) the respondent did not know the type of distribution, (2) received an annuity, or (3) received some other type of distribution. Estimated marginal effects from the model appear in Table 8. Control variables are similar to those used in prior models.
Table 8. Marginal effects from multinomial logit on type of distribution for respondents covered by DB only or DC only retirement plan (weighted data)

Standard errors in parentheses.
The sample in the analysis includes only respondents who reported that they were covered by only one type of plan, either a DB plan or a DC plan. Individuals covered by both plans and those that did not know their type of plan are excluded in this analysis.
The three dependent variables shown at the top of each column indicate the following: Don't know indicates that the individual did not know the type of distribution they had received or expected to receive, Other means that the respondent took a distribution that was not an annuity, Annuity indicates that the respondent selected either a single life or joint and survivorship annuity.
Sample size is 922. Reference categories are individuals that received a distribution from a DB plan, white, high school education or less, male, nonmarried, and annual income of $50,000–$99,999.
***p < 0.01, **p < 0.05, *p < 0.10.
A first important finding that underscores results presented above is that DB plan payouts are far more likely to be in the form of annuities. The marginal effects indicate that annuity distributions from DC plans (whether received or expected) are about 35–40 percentage points lower than for those individuals in DB plans holding individual characteristics constant. Compared to the mean of 37% of retirees selecting an annuity, this implies a substantially lower incidence of annuities among DC retirees. This is unsurprising given that few DC plans offer annuities, while DB plans tend to default workers into lifetime income streams.Footnote 28 DB participants anticipating a future distribution tend to be about 10 percentage points more likely to expect an annuity, compared to respondents who had already accepted a distribution.
Turning to an examination of the effects of individual characteristics, the results indicate that older individuals are slightly more likely to request annuity distributions: each additional 10 years of age is associated with a 0.9 percentage point greater likelihood of selecting an annuity. This finding is consistent with a greater focus on longevity risk by older individuals. At higher levels of income, DB participants tend to be more likely to elect annuities, while respondents covered by DC plans are less likely to select annuities. Finally, we find some interesting racial/ethnic differences in payout choices. For instance, Blacks and Hispanic/Latinos were significantly less likely to select an annuity from DB plans compared to white respondents. Yet in view of the fact that uncertainty associated with longevity among Blacks is greater than for whites (Milevsky, Reference Milevsky2020), annuities would be thought to be more valuable to Blacks than their white counterparts.
6. Conclusions and discussion
For many American workers, retirement wellbeing depends on how they manage their pension assets when leaving their career jobs, so it is valuable to review some of the most common pension payout options. These include complete or partial withdrawal of one's account balance, some form of life annuity, or other ways to periodically decumulate funds. This paper examines how pension plan participants age 45–75 behave in a recent UAS survey we developed and fielded.
Our most important conclusion is that participants taking DB plan payouts are still more likely to elect annuities, compared to otherwise similar participants in DC plans. This finding reflects the importance of default options and the ways in which account balances and future benefits are presented to pension participants. We also find that Blacks and Hispanic/Latinos are significantly less likely to select annuities if they are in DB plans.Footnote 29 Also, only the most highly-paid respondents in DB plans are more likely to annuitize, whereas the lower-paid indicate they do not prefer annuitization.
Our second conclusion focuses on respondent knowledge about pension characteristics. More financially literate pension participants as well as higher income participants and those with more education are more likely to know their pension plan type, compared to their less sophisticated and lower earning counterparts. This finding illustrates the importance of financial literacy for retirement decisions. Individuals without basic knowledge of plan provisions are unlikely to make optional decisions concerning the distribution of their retirement assets. There is no statistically significant difference between men and women with regard to annuitization.
Since the choice of pension distribution depends both on the payout options offered by the plan and the retiree's preferences, it may be asked whether additional efforts could help older individuals select certain payout options that better protect them from retirement insecurity. Improving financial literacy is one logical avenue by which people could become better informed and make better-reasoned pension payout decisions. Enhancing awareness of longevity risk – particularly for those who underestimate their chances of living a long time in retirement – will also encourage annuitization (Hurwitz et al., Reference Hurwitz, Mitchell and Sade2021). Partial and deferred annuitization could also be helpful. For instance, Horneff et al. (Reference Horneff, Maurer and Mitchell2020) demonstrated that defaulting retirees into deferred annuities amounting to only 10% of their 401(k) accounts could substantially enhance retiree wellbeing, so long as workers' pension assets exceeded $65,000 (smaller accounts would not generate much additional consumption). In the present study, the average DB participant taking a lump sum withdrew around $133,000, and the average DC lump sum was about $108,000. As noted by Horneff et al. (Reference Horneff, Maurer and Mitchell2021), these amounts are well over the minimum deemed necessary for a deferred annuity to substantially enhance old-age consumption.
Appendix
Table A.1. Significance tests for mean differences in pension coverage


 Open access