


INTRODUCTION
Anorexia nervosa (AN) is a serious eating disorder characterized by severe food avoidance and weight loss, an intense fear of gaining weight, and a distorted experience of one’s body (American Psychiatric Association, 2000). It is well known that individuals with AN tend to be cognitively inflexible and have impaired set-shifting, which may contribute to the high rates of chronicity and death (Papadopoulos, Ekbom, Brandt, & Ekselius, Reference Papadopoulos, Ekbom, Brandt and Ekselius2009; Roberts, Tchanturia, Stahl, Southgate, & Treasure, Reference Roberts, Tchanturia, Stahl, Southgate and Treasure2007; Roberts, Tchanturia, & Treasure, Reference Roberts, Tchanturia and Treasure2010; Tchanturia et al., Reference Tchanturia, Davies, Roberts, Harrison, Nakazato, Schmidt and Morris2012; Wu et al., Reference Wu, Brockmeyer, Hartmann, Skunde, Herzog and Friederich2014). Persistent dietary restriction despite negative consequences and evidence of altered reward and punishment sensitivity in AN (Bischoff-Grethe et al., Reference Bischoff-Grethe, McCurdy, Grenesko-Stevens, Irvine, Wagner, Yau and Kaye2013; Glashouwer, Bloot, Veensra, Franken, & de Jong, Reference Glashouwer, Bloot, Veensra, Franken and de Jong2014; Harrison, O’Brien, Lopez, & Treasure, Reference Harrison, O’Brien, Lopez and Treasure2010; Harrison, Treasure, & Smillie, Reference Harrison, Treasure and Smillie2011; Jappe et al., Reference Jappe, Frank, Shott, Rollin, Pryor, Hagman and Davis2011; Matton, Goossens, Braet, & Vervaet, Reference Matton, Goossens, Braet and Vervaet2013) raise the question of whether impaired learning from reward and loss might contribute to repeated engagement in maladaptive behavior and illness maintenance.
Dysfunction of reward processing in AN is well documented, with reduced subjective reward sensitivity and decreased limbic-striatal neural response to rewarding stimuli such as food or money (Brooks, Rask-Andersen, Benedict, & Schioth, Reference Brooks, Rask-Andersen, Benedict and Schioth2012; Fladung, Schulze, Scholl, Bauer, & Gron, Reference Fladung, Schulze, Scholl, Bauer and Gron2013; Jappe et al., Reference Jappe, Frank, Shott, Rollin, Pryor, Hagman and Davis2011; Keating, Tilbrook, Rossell, Enticott, & Fitzgerald, Reference Keating, Tilbrook, Rossell, Enticott and Fitzgerald2012; O’Hara, Schmidt, & Campbell, Reference O’Hara, Schmidt and Campbell2015; Oberndorfer et al., Reference Oberndorfer, Frank, Fudge, Simmons, Paulus, Wagner and Kaye2013; Wierenga et al., Reference Wierenga, Ely, Bischoff-Grethe, Bailer, Simmons and Kaye2014; Wu et al., Reference Wu, Brockmeyer, Hartmann, Skunde, Herzog and Friederich2016). Emerging evidence suggests processing of aversive stimuli may also be disrupted in AN; individuals with AN demonstrate elevated harm avoidance, intolerance of uncertainty, anxiety, and oversensitivity to punishment (Glashouwer et al., Reference Glashouwer, Bloot, Veensra, Franken and de Jong2014; Harrison et al., Reference Harrison, O’Brien, Lopez and Treasure2010; Harrison et al., Reference Harrison, Treasure and Smillie2011; Jappe et al., Reference Jappe, Frank, Shott, Rollin, Pryor, Hagman and Davis2011; Matton et al., Reference Matton, Goossens, Braet and Vervaet2013), which may contribute to an altered response to negative feedback or a bias to avoid outcomes perceived as aversive (Kaye et al., Reference Kaye, Wierenga, Knatz, Liang, Boutelle, Hill and Eisler2015). Neuroimaging studies support a neural dysfunction to loss, with an exaggerated (Bischoff-Grethe et al., Reference Bischoff-Grethe, McCurdy, Grenesko-Stevens, Irvine, Wagner, Yau and Kaye2013) or undifferentiated (Wagner et al., Reference Wagner, Aizenstein, Venkatraman, Fudge, May, Mazurkewicz and Kaye2007) striatal response to monetary losses compared to wins and decreased response to aversive taste (Monteleone et al., Reference Monteleone, Monteleone, Esposito, Prinster, Volpe, Cantone and Maj2017). However, much of the existing work in AN has focused on responsivity to reward and punishment, with less attention to learning from both reward and punishment (Bernardoni et al., Reference Bernardoni, Geisler, King, Javadi, Ritschel, Murr and Ehrlich2018; Foerde & Steinglass, Reference Foerde and Steinglass2017).
The core idea of reinforcement learning is that the rate of learning is driven by violations of expectations, or prediction errors (PEs), which are operationalized as the received outcome minus the expected outcome, and are markers of dopamine activity (Pearce & Hall, Reference Pearce and Hall1980; Rescorla and Wagner Reference Rescorla, Wagner, Black and Prokasy1972; Sutton & Barto, Reference Sutton and Barto2018). Learning from experience occurs through updating expectations about the outcome in proportion to PE, so that the expected outcome converges to the actual outcome. The majority of studies of learning in AN have focused on passive Pavlovian conditioning (Schaefer & Steinglass, Reference Schaefer and Steinglass2021), with evidence of elevated reward PE signals in the ventral striatum and orbitofrontal cortex in ill and remitted AN (GK Frank, Collier, Shott, & O’Reilly, Reference Frank, Collier, Shott and O’Reilly2016; GK Frank et al., Reference Frank, Reynolds, Shott, Jappe, Yang, Tregellas and O’Reilly2012). However, Pavlovian tasks have demonstrated poor behavioral profiles (National Institute of Mental Health, 2016). Given the importance of choice behavior and decision-making in AN, instrumental response-outcome learning may be more relevant to psychopathology. Limited behavioral data (i.e., Acquired Equivalence Task) suggest reduced reward reinforcement learning in AN (Foerde & Steinglass, Reference Foerde and Steinglass2017; Shott et al., Reference Shott, Filoteo, Jappe, Pryor, Maddox, Rollin and Frank2012).
To probe the influence of rewarding and punishing outcomes on instrumental reinforcement learning, we employed a well-studied two-choice feedback-based probabilistic associative learning task (PALT) that relies on the contingency between a participant’s response and outcome (i.e., whether or not they won or lost points) to facilitate learning (i.e., to select the optimal reward-based stimuli and avoid the nonoptimal punishment-based stimuli) (Bodi et al., Reference Bodi, Keri, Nagy, Moustafa, Myers, Daw and Gluck2009; Herzallah et al., Reference Herzallah, Khdour, Taha, Elmashala, Mousa, Taha and Gluck2017; Herzallah et al., Reference Herzallah, Moustafa, Natsheh, Abdellatif, Taha, Tayem and Gluck2013; Mattfeld, Gluck, & Stark, Reference Mattfeld, Gluck and Stark2011; Myers et al., Reference Myers, Moustafa, Sheynin, Vanmeenen, Gilbertson, Orr and Servatius2013). The PALT is sensitive to dopaminergic medication effects on reward and punishment processing in Parkinson’s disease (Bodi et al., Reference Bodi, Keri, Nagy, Moustafa, Myers, Daw and Gluck2009), has been applied to several psychiatric disorders (i.e., substance use, post-traumatic stress, depression (Beylergil et al., Reference Beylergil, Beck, Deserno, Lorenz, Rapp, Schlagenhauf and Obermayer2017; Herzallah et al., Reference Herzallah, Khdour, Taha, Elmashala, Mousa, Taha and Gluck2017; Myers et al., Reference Myers, Moustafa, Sheynin, Vanmeenen, Gilbertson, Orr and Servatius2013), and corresponds to functional specialization within the striatum for reward and punishment PE estimates (Mattfeld et al., Reference Mattfeld, Gluck and Stark2011). Moreover, research over the past two decades has shown that the direction and magnitude of PE may be a marker of altered dopaminergic activity in AN (Glimcher, Reference Glimcher2011; Schultz, Dayan, & Montague, Reference Schultz, Dayan and Montague1997; Schultz, Reference Schultz2016; Steinberg et al., Reference Steinberg, Keiflin, Boivin, Witten, Deisseroth and Janak2013).
Given the link between PE and reinforcement learning, it is tempting to infer group or individual differences in PE from observable reinforcement learning scores. Such an inference would be valid only if the observed scores were unidimensional and reflected PE-based learning. However, if PALT performance involved multiple processes, group or individual differences in the observed scores would be challenging to interpret because the differences might be due to any of the several processes that underlie the task (Sojitra, Lerner, Petok, & Gluck, Reference Sojitra, Lerner, Petok and Gluck2018; Strauss & Smith, Reference Strauss and Smith2009). Before comparing AN and healthy control (HC) participants, we investigated the multidimensionality of data derived from the PALT by comparing the fits of three computational reinforcement learning models.
All of these models assumed that when a stimulus is presented, participants choose between two alternatives based on unobserved choice values that reflect the participant’s expectancy of obtaining a favorable outcome (See Supplement). Once a choice is made, the expectancy value associated with the choice made is updated based on the PE and PE learning rates, represented by the parameter η (Figure 1). In expectancy value-based learning models of this type, the difference between the expectancy values associated with the two-choice alternatives is multiplied by a logistic regression weight, represented by the parameter β, to turn the value difference into a probability of choosing a particular alternative (Gershman, Reference Gershman2016); Supplement – Equation 1; Figure 1). Although the logistic regression weight has been called inverse temperature in some applications (Daw, Reference Daw, Delgado, Phelps and Robins2011), it has been described as an explore-exploit parameter in the psychology literature and reflects how decisively participants make choices based on small differences in the expectancy values (Gershman, Reference Gershman2016; Moustafa, Gluck, Herzallah, & Myers, Reference Moustafa, Gluck, Herzallah and Myers2015).

Fig. 1. (A) Rather than setting all expectancy values, V, to zero on the first trial a stimulus, s
j
, is presented, as in the No Bias model, they are set either to a bias value, bias(s
j
), or to zero in the First Choice Bias model. The bias(s
j
) values are sampled from a normal distribution with mean zero, indicating no bias, and a precision = 10, where precision = 1/variance. If the sampled bias value for stimulus s
j
is positive, the choice that would yield the optimal long-term outcome is favored and its expectancy value for trial 1, V1(cOpt|s
j
), is set to the sampled bias value, bias(s
j
), whereas the expectancy value for the nonoptimal response, V1(cNonOpt|s
j
), is set to zero. If the sampled bias value is negative the nonoptimal choice is favored and the expectancy value for the nonoptimal choice is set to the absolute value of the bias, whereas the expectancy value for the optimal choice is set to zero. For the First Choice Bias (Singlet) model, the bias parameters for each stimulus is set to the same estimated value bias(s.). (B) The expectancy value for trial t + 1 associated with the choice c
i
made to stimulus s
j
on trial t, V
t+1
(c
i
|s
j
), is the expectancy value on trial t updated by the product of a learning rate with the prediction error. Different learning rates, η
p|n
, are estimated for positive or negative prediction errors, PE
p|n
. Learning rates are sampled from a beta distribution using values of the α and β parameters listed in Table 2 (Also see Supplement). A logistic equation maps the differences between the expectancy value of the choice made on trial t, V
t
(c
i
|s
j
), and the value of the choice not made,
 $${{\rm{V}}_{\rm{t}}}({{\rm{\overline c}}_i}|{{\rm{S}}_j})$$
, to the probability P
t
(c
i
|s
j
) of making the chosen response c
i
given that stimulus s
j
was presented on trial t. The logistic regression weight β is sampled from a gamma distribution using values of the shape and rate parameters presented in Table 2 (Also see Supplement).
$${{\rm{V}}_{\rm{t}}}({{\rm{\overline c}}_i}|{{\rm{S}}_j})$$
, to the probability P
t
(c
i
|s
j
) of making the chosen response c
i
given that stimulus s
j
was presented on trial t. The logistic regression weight β is sampled from a gamma distribution using values of the shape and rate parameters presented in Table 2 (Also see Supplement).
As shown by Shultz (Schultz, Reference Schultz2016), positive and negative PEs differentially effect dopaminergic activity. Because differential levels of dopaminergic activity influence amount of PE learning (Steinberg et al., Reference Steinberg, Keiflin, Boivin, Witten, Deisseroth and Janak2013), positive and negative PE might be associated with different PE learning rates. All models discussed in this paper assume that separate learning parameters differentially update expectancy values depending on the positive or negative valence of the PE (Gershman, Reference Gershman2016). In particular, the No Bias model is composed of the explore-exploit parameter, β, and two learning rate parameters, one to update expectancy values when PE is positive, η p , the other when it is negative, η n .
The No Bias model assumes that the first choice made to a stimulus is unbiased. However, global choice biases, the tendency to choose one alternative over another regardless of previous outcomes, and choice inertia bias, the tendency to repeat choices, are commonly reported in the choice literature (Fritsche, Mostert, & de Lange, Reference Fritsche, Mostert and de Lange2017; Garcia-Perez & Alcala-Quintana, Reference Garcia-Perez and Alcala-Quintana2013; Gold & Ding, Reference Gold and Ding2013; Linares, Aguilar-Lleyda, & Lopez-Moliner, Reference Linares, Aguilar-Lleyda and Lopez-Moliner2019; Morgan, Dillenburger, Raphael, & Solomon, Reference Morgan, Dillenburger, Raphael and Solomon2012). It is during experimental conditions leading to uncertainty that choice biases are most likely to be observed (Morgan et al., Reference Morgan, Dillenburger, Raphael and Solomon2012; Urai, Braun, & Donner, Reference Urai, Braun and Donner2017). When a stimulus is first presented on the PALT, participants are doubly uncertain, neither knowing whether the trial is a reward or punishment trial nor knowing which category to choose. Given this uncertainty, initial choice biases might be due to a global choice bias or to a choice history bias – the latter occurring on the initial presentation of subsequent stimuli after the first PALT stimulus is presented. If choice biases occur on the PALT, they would be unobserved processes that would obscure the use of observed scores as markers of PE learning. In the First Choice Bias model, we modeled the impact of choice biases on the expectancy value of a choice when a stimulus is first presented, which is when uncertainty is likely maximal. This model included a separately estimated bias parameter, bias(s j ), for each of the four stimuli, s j , presented on a trial set in addition to the explore-exploit parameter, β, and the two learning rate parameters, η p and η n . The First Choice Bias (Singlet) model constrained estimates of the four bias parameters to be equal to a single estimated value.
Considering the importance of biases in accounting for choice performance, we predicted that the First Choice Bias model would provide a better fit to the data than would the Base model. Once the best fitting model was chosen, we tested the hypothesis that individuals with AN would demonstrate deficient reinforcement learning as evidenced by worse optimal response accuracy on reward and punishment trials and/or poorer learning rates, η p|n , associated with positive and negative PEs compared to HCs. Moreover, within AN, differences between accuracy on reward and punishment trials or positive and negative PEs would indicate differential sensitivity to learning from rewarding or disappointing outcomes. Exploratory analyses examined associations between learning rates, size of PEs and AN symptom severity and clinical outcome.
METHOD
Participants
Forty-two individuals meeting criteria for DSM-5 restricting-type AN (4 also endorsed purging; mean age = 22.8, range = 16–60) were compared to 38 HC volunteers (mean age = 21.6, range = 15–32; Table 1). Individuals with AN were recruited from the University of California, San Diego Eating Disorders Treatment and Research outpatient Partial Hospitalization Program (PHP). The PHP uses a blend of family-based treatment and dialectical behavior therapy adapted for intensive treatment settings. Patients received treatment 6 to 10 h/day, 6 days/week, including individual, family, group, and multi-family therapy, nutritional counseling, psychiatric care, and medical monitoring (Brown et al., Reference Brown, Cusack, Anderson, Trim, Nakamura, Trunko and Kaye2018; Reilly et al., Reference Reilly, Rockwell, Ramirez, Anderson, Brown, Wierenga and Kaye2020). AN diagnosis was determined by semi-structured interview performed by program psychiatrists at treatment admission according to 2010 draft criteria for the DSM-5 (Hebebrand & Bulik, Reference Hebebrand and Bulik2011) and included atypical and partially remitted AN (BMI range: 14.5–23.8 kg/m2). HCs were recruited from the San Diego community and did not have any eating disorder symptomatology or Axis I psychiatric disorder based on a modified version of the Structured Clinical Interview for DSM-IV-TR Module H (First, Spitzer, Gibbon, & Williams, Reference First, Spitzer, Gibbon and Williams2002) and the Mini International Neuropsychiatric Interview (Sheehan et al., Reference Sheehan, Lecrubier, Sheehan, Amorim, Janavs, Weiller and Dunbar1998). See Supplement for additional exclusion criteria.
Table 1. Demographic and clinical characteristics of the sample

Note: Welch’s two sample t-tests were used to assess statistical significance for between-group differences in continuous variables. Cronbach’s alphas for all self-report measures were strong (α = .84−.99). Self-report questionnaires were completed within 16.1 days of the PALT administration.
aTwo AN did not complete this assessment.
bOne AN did not complete this assessment.
cSeventeen AN were prescribed only one class of medication, 6 AN were prescribed two classes, and 2 AN were prescribed 3 classes of medication. All medications with presumed dopaminergic action fell within the atypical antipsychotic classification.
BDI = Beck Depression Inventory-Second Edition (BDI-2) (Beck, Steer, & Brown, Reference Beck, Steer and Brown1996); BIS/BAS = Behavioral Inhibition/Behavioral Activation Scale (Carver & White, Reference Carver and White1994); BMI = body mass index; EDE-Q = Eating Disorder Exam – Questionnaire (Fairburn & Beglin, Reference Fairburn and Beglin1994); SPSRQ = Sensitivity to Punishment Sensitivity to Reward Questionnaire (Torrubia, Avila, Molto, & Caseras, Reference Torrubia, Avila, Molto and Caseras2001); STAI = Spielberger State-Trait Anxiety Inventory (Spielberger, Gorsuch, & Lushene, Reference Spielberger, Gorsuch and Lushene1970); TCI = Temperament and Character Inventory (TCI; (Cloninger, Przybeck, Svrakic, & Wetzel, Reference Cloninger, Przybeck, Svrakic and Wetzel1994).
Procedure
AN participants completed the PALT on average 19.8 days (SD = 19.9) after treatment admission. Weight and height, measured via digital scale and stadiometer, were obtained at admission, within two days of PALT completion, and at discharge for AN, and during the task visit for HC. Self-report questionnaires to assess anxiety, depression and temperament traits common in AN (e.g., reward/punishment sensitivity, inhibition, harm avoidance) that might relate to learning behavior (Table 1) were completed within 16.1 days (SD = 18.9) of the PALT in AN (Harrison, Treasure, & Smillie, Reference Harrison, Treasure and Smillie2011; Jappe et al., Reference Jappe, Frank, Shott, Rollin, Pryor, Hagman and Davis2011; Wagner et al., Reference Wagner, Barbarich-Marsteller, Frank, Bailer, Wonderlich, Crosby and Kaye2006). The study was approved by the Institutional Review Board of the University of California, San Diego, research was completed in accordance with the Helsinki Declaration, and all participants gave written informed consent and received a stipend.
Probabilistic Associative Learning Task
The PALT (Figure 2) involves receiving 25 points when choosing the optimal response on reward trials, but losing 25 points when choosing the nonoptimal response on punishment trials (Bodi et al., Reference Bodi, Keri, Nagy, Moustafa, Myers, Daw and Gluck2009; Mattfeld et al., Reference Mattfeld, Gluck and Stark2011; Myers et al., Reference Myers, Moustafa, Sheynin, Vanmeenen, Gilbertson, Orr and Servatius2013). On each trial, participants saw one of four stimulus images and were prompted to decide whether it was associated with one of two categories “A” or “B”, corresponding to different response keys. Two images were randomly assigned to be “reward” stimuli in that selection of the optimal category typically produced feedback and a gain of 25 points, whereas selection of the nonoptimal category typically produced no gain of points. The remaining two images were “punishment” stimuli in that selection of the nonoptimal category typically produced feedback and a loss of 25 points, whereas selection of the optimal category typically produced no loss of points. Reward-learning trials and punishment learning trials were intermixed within the task with a favorable outcome associated with a gain on reward trials and the avoidance of loss on punishment trials. Unfavorable outcomes led to no change in points on reward trials and a loss of 25 points on punishment trials. The participant’s cumulative point tally was shown at the bottom of the screen on each trial and was initialized to 500 points at the start of the experiment. As done in prior studies (Bodi et al., Reference Bodi, Keri, Nagy, Moustafa, Myers, Daw and Gluck2009; Mattfeld et al., Reference Mattfeld, Gluck and Stark2011), two task sets were administered, each with a different set of pictures to increase the number of trials during which participants were actively learning new associations. The order of stimulus sets was counterbalanced across participants. Each set contained 160 trials, divided into four 40-trial blocks. Within each block, each stimulus appeared 10 times; 8 times the optimal response was associated with the more favorable outcome, whereas two times the nonoptimal response was associated with the more favorable outcome. For each participant, trial order was randomized within a block. Trials lasted until the participant responded and were separated by a 2s interval, during which time the screen was blank. On each trial, the computer recorded whether the participant made the optimal response, regardless of the actual outcome on that trial. The task took about 30 min to complete. The experiment was administered on a MacBook Pro, programmed in MatLab version R2016B.

Fig. 2. Probabilistic associative learning task (copied with permission from (Mattfeld et al., Reference Mattfeld, Gluck and Stark2011)).
Computational Reinforcement Learning Models
Like Confirmatory Factor Analysis, computational models of cognitive processes embody assumptions about a model’s architecture and parameters that determine how observed data are related to latent processes. Whereas the assumptions fix the architecture of a model, varying the model’s parameters can fine-tune the model’s functioning (Farrell & Lewandowsky, Reference Farrell and Lewandowsky2018). Parameters estimated for each of the three models are listed in Table 2 and discussed in more detail in the caption of Figure 1 and in Supplemental Materials. To operationalize PE size, outcome was coded 1 for gains on reward trials, −1 for loss on punishment trials, and 0 for no change in points. Successful learning drives the expectancy values toward gains, coded 1, on reward trials and toward avoidance of loss, coded 0, on punishment trials. The No Bias model allowed positive and negative PE learning rate parameters, η p and η n , and the explore-exploit parameter, β, to vary and set initial expectancy values to zero. The First Choice Bias model (Figure 1) allowed β, η p and η n to vary, but also included four parameters that determined the initial expectancy values of choices made to each of the four stimuli in order to account for choice biases. Given how expectancy values are updated, the impact of these biases propagates to subsequent trials. The First Choice Bias (Singlet) model set the four bias parameters to the same estimated value. The full First Choice Bias model was selected as the best fitting model as assessed by deviance information criterion weights (see Supplement).
Table 2. Parameters estimated for each of the four models and their prior distributions

Note. Parameters η p and η n represent the learning rates for positive and negative prediction errors respectively. Parameter Bias r1 is the bias weight for the first reward stimulus; Bias r2 is the bias weight for the second reward stimulus; Bias p1 the bias weight for the first punishment stimulus; Bias p2 the bias weight for the second punishment stimulus. ∼ signifies “distributed as.” The Gaussian distribution in rjags is parameterized as mean and precision, where precision = 1/variance.
Parameter estimation
We used the R routine rjags to generate Bayesian estimates of model parameters based on fits to trial by trial optimal response data for each stimulus (Plummer, Reference Plummer2017). See Supplement for details and model sensitivity analysis. The predicted block means for reward and punishment trials based on parameter estimates for the best fitting model are presented in Figure 3.
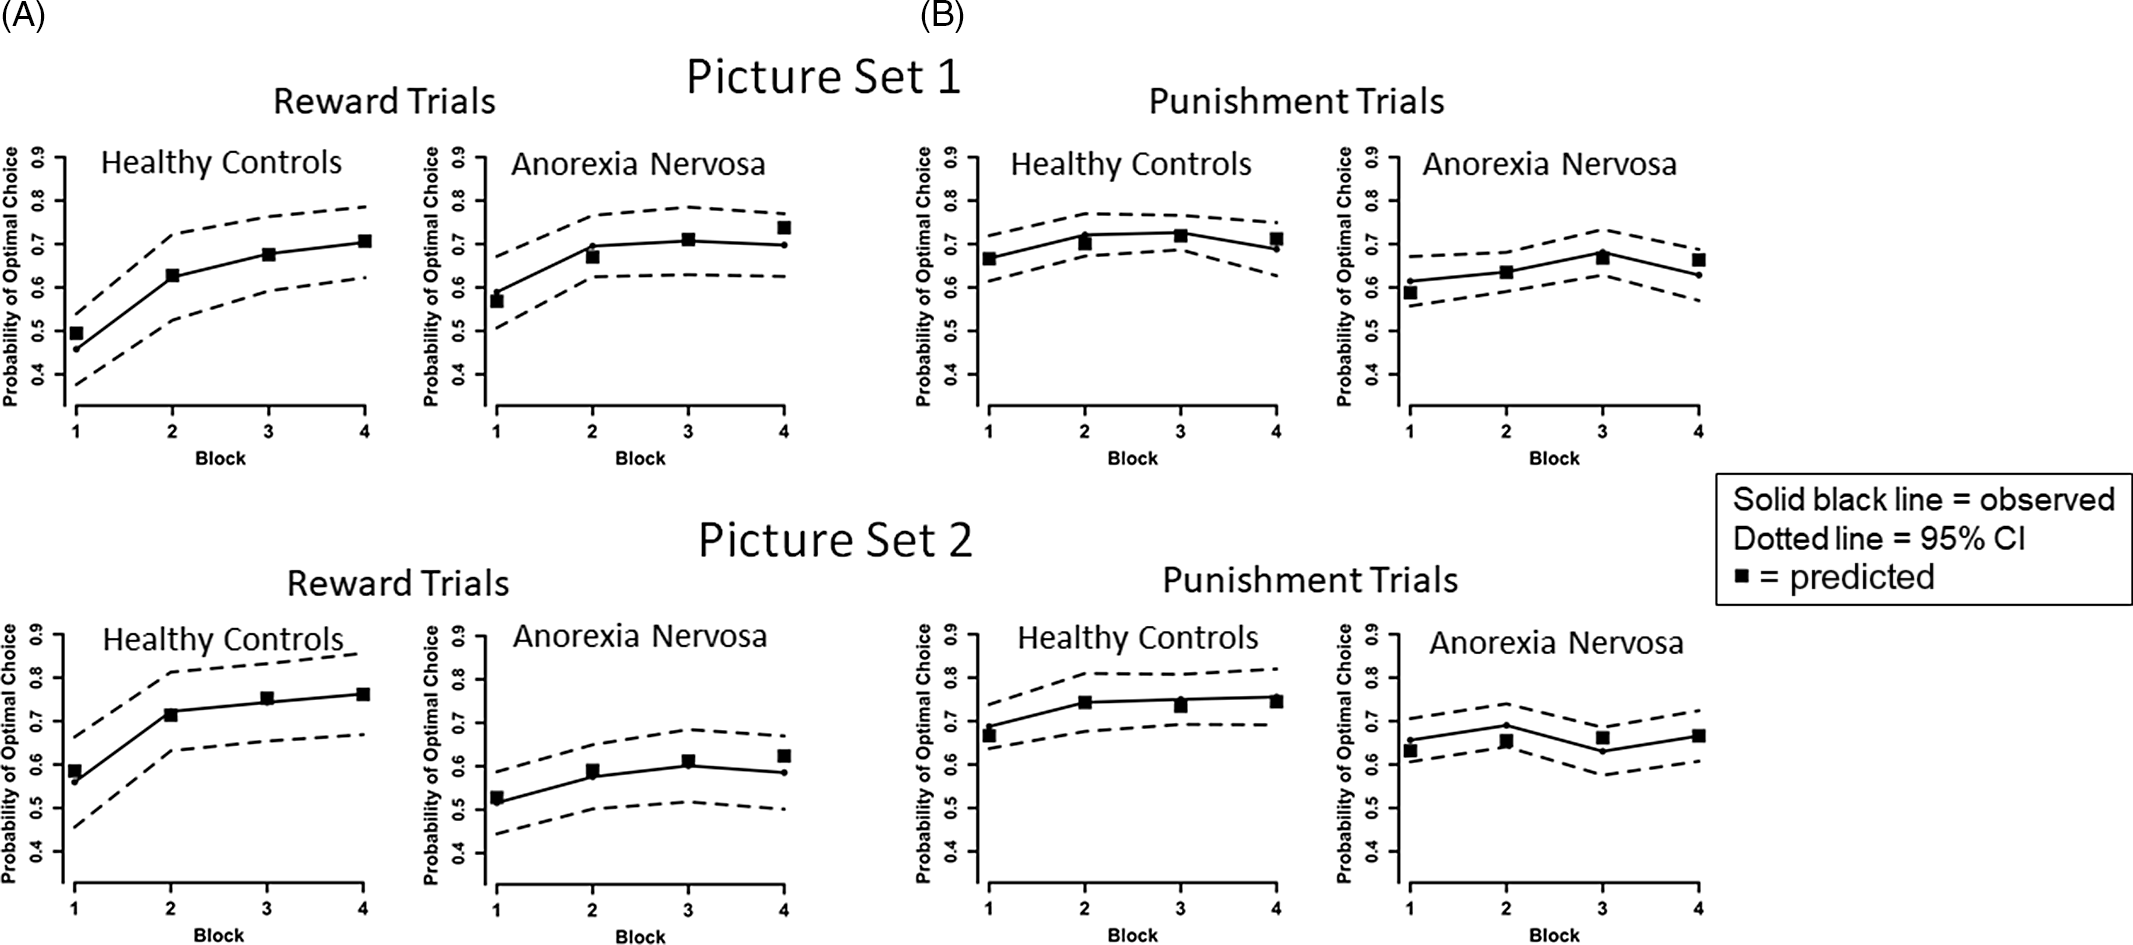
Fig. 3. Plots of the observed and predicted mean probability of selecting the optimal choice for AN and HC groups across the four blocks by trial type (reward, punishment) and picture set. We calculated for each participant the predicted block means for reward and punishment trials based on the participant’s full First Choice Bias model parameter estimates and present the average of these means for AN and HC groups for the two picture sets as black squares. As can be seen, in every instance the model derived means are within the 95% confidence interval of the observed means, and most cover the data means, supporting the prediction model. (A) For observed data, on reward trials, results indicate improved performance over time across all participants, consistent with learning, [main effect of Block, F(3,225) = 41.482, p < .001, η 2 p = .356], and the HC group had a greater learning rate overall than the AN group [Group × Block interaction, F(3,225) = 5.771, p = .001, η 2 p = .071]. However, AN performed better than HC on Set 1 and worse than HC on Set 2 [Group × Set interaction, F(1,75) = 5.556, p = .021, η 2 p = .069]. No other main effects or interactions were significant for reward trials, ps > .3. No other main effects or interactions were significant for reward trials, ps > .3. (B) On punishment trials, performance improved over time across all participants [main effect of Block, F(3,225) = 3.711, p = .012, η 2 p = .047], and HC performed better than AN [main effect of Group, F(1,75) = 6.833, p = .011, η 2 p = .083]. No other main effects or interactions were significant for punishment trials, ps > .1.
Statistical Analysis
Behavioral performance
Choice behavior was analyzed using a repeated measures analysis of variance (rmANOVA) on optimal response accuracy with Group as a between subjects effect and Block and Set as within subject effects, separately for reward trials and punishment trials.
Model-generated parameters
Analyses were performed separately for reward and punishment trials. To compare groups on learning rate parameters, we performed a rmANOVA with Group as a between effect and Set and PE learning rates (η p , η n ) as within effects. We also performed a Group x Set rmANOVA to investigate group differences in the β parameter. To investigate the bias parameters, we averaged the two bias values for reward stimuli and the two bias values for punishment stimuli, then performed a rmANOVA involving Group × Set. To more completely examine group differences in level of learning from a PE perspective, we averaged the size of PEs over trials separating values by PE type (positive or negative) within reward and punishment trials for each set (e.g., mean negative PE for punishment trials on set 1) and submitted these means to Group × Set × PE type rmANOVAs.
Exploratory clinical associations
To examine whether standard clinical assessments are associated with learning in AN, Pearson correlational analyses examined relationships between 14 reinforcement learning model values (for each set: η p , η n , positive and negative PEs for each trial type, and β) and 9 AN clinical measures (age, admission BMI, EDE-Q Global score, TCI Harm Avoidance, TCI Novelty Seeking, BIS/BAS, SPSRQ, STAI, BDI) at time of study. To examine associations with treatment outcome, reinforcement learning model values were explored as predictors of BMI at discharge using hierarchical linear regression analyses, controlling for BMI at treatment admission, length of treatment, and medication status. The hierarchical linear regression analysis was repeated using each self-reported clinical measure as a predictor. Bonferroni correction for multiple comparisons was used to determine a family-wise p-value for the 14 learning model values (.004) and the 9 clinical measures (.006) assuming p = .05 for each test.
Sensitivity analyses
To examine the potential impact of low weight and medication status on our results, we compared AN participants with a BMI below 18.5 kg/m2 (n = 25; 59.5% of sample) to AN participants with a BMI above 18.5 kg/m2 (n = 17; 41.5% of sample), and AN participants on medication (n = 25; 61% of sample) to AN participants not on medication (n = 16; 39% of sample) on clinical measures using Welch’s two sample t-tests and repeated the rmANOVAs described above for each subsample. Small samples precluded analysis of medication class (Table 1).
RESULTS
Sample Characteristics
AN and HC groups did not differ in age or education (Table 1). AN had significantly lower current BMI (p < .001). In AN, there was a significant increase in BMI from treatment admission to discharge (t(39) = 7.9, p < .001, Cohen’s d = 1.0).
Behavioral Performance
A Group × Block × Set rmANOVA on optimal responses for reward trials revealed a main effect of Block, indicating increased accuracy over time across all participants, consistent with learning, F(3,225) = 41.482, p < .001, η 2 p = .356 (Figure 3A). We detected a Group × Block interaction, corresponding to faster learning rates in the HC group compared to AN, F(3,225) = 5.771, p = .001, η 2 p = .071. A Group × Set interaction indicated AN were more accurate than HC on Set 1, but less accurate than HC on Set 2, F(1,75) = 5.556, p = .021, η 2 p = .069.
For punishment trials, a Group × Block × Set rmANOVA revealed a main effect of Block, indicating increased accuracy over time, F(3,225) = 3.711, p = .012, η 2 p = .047 (Figure 3B). A main effect of Group indicated AN performed worse than HC, F(1,75) = 6.833, p = .011, η 2 p = .083. Taken together, both groups demonstrated greater accuracy over time (aka, learning) for reward and punishment trials; compared to HC, AN had slower overall learning on reward trials, with better overall accuracy on Set 1 and worse accuracy on Set 2 (possibly suggesting greater difficulty set-shifting and learning new associations, see (Filoteo et al., Reference Filoteo, Paul, Ashby, Frank, Helie, Rockwell and Kaye2014)), and were less accurate across punishment trials.
Model Generated Parameters
Prediction error learning rates (η)
A Group × Set × PE learning rate type (η p vs. η n ) rmANOVA revealed a main effect of Group, indicating that AN learned more slowly than HC following both positive PEs and negative PEs, F(1,75) = 5.521, p = .021, η 2 p = .061 (Table 3; Figure 4A). A main effect of PE type revealed faster learning rates following positive PEs compared to negative PEs across the entire sample, F(1,75) = 78.792, p < .001, η 2 p = .512. That is, faster learning occurred when the outcomes were better than expected relative to when the outcomes were worse than expected.
Table 3. Reinforcement learning model generated parameters by group and set

Note: PE: predication error; η p : learning rate for positive PE; η n : learning rate for negative PE; β: “inverse temperature” parameter representing the balance between exploring new choice rules and exploiting the rules learned. Two HC and one AN did not complete Set 2.

Fig. 4. (A) Plot of the mean learning rate by prediction error type and group collapsed across set demonstrating the main effect of Group resulting from the Group × Set × PE type ANOVA. The main effect of Group indicated that AN learn more slowly than HC following both positive PEs and negative PEs. A main effect of PE type revealed faster learning rates following positive PEs compared to negative PEs across the entire sample. Neither the main effect of Set nor any interactions were significant (all η 2p < .039). (B) Plot of explore-exploit values by group and set showing a main effect of Group. AN had lower β values than HC. Smaller values imply individuals are still exploring stimulus-response-outcome hypotheses and are less certain about exploiting learned rules. The main effect of Set was not significant, nor was the interaction of Group x Set (all η 2p < .030). (C) Plot of the change in BMI from admission to discharge with size of negative PE on punishment trials of Set 1. Error bars represent standard error of the mean; *p < .05, **p < .01, ***p < .001.
Prediction error size
To directly examine whether groups might have differed in accuracy as a result of better than or worse than expected outcomes on reward and punishment trials, Group × Set × PE type rmANOVAs for average PE size revealed no effects involving Group for reward trials (all η 2 p < .025) or for punishment trials (all η 2 p < .045).
Explore-exploit strategy (β)
A Group × Set rmANOVA for the explore-exploit parameter, β, revealed a main effect of Group, whereby AN had smaller β values than HC, F(1,75) = 6.366, p = .014, η 2 p = .078 (Table 3; Figure 4B). Since smaller values imply individuals are exploring more than exploiting stimulus-response-outcome hypotheses, results indicate AN may less decisively make choices.
Choice bias parameters
To assess whether groups differed in the degree to which early reward and punishment reinforcement trials reflected choice biases, the Group × Set interaction for bias values was significant only for reward trials, indicating that HC had a greater bias against making the optimal choice on Set 1, whereas AN had a greater bias against making the optimal choice on Set 2, F(1,75) = 10.651, p = .002, η 2 p = .124 (Table 3; Figure S10). This is consistent with the behavioral response data indicating that AN outperformed HC on Set 1 and performed worse than HC on Set 2 on reward trials. No significant effects of choice bias were detected for punishment trials (all η 2 p < .018).
Exploratory Clinical Associations
No associations between reinforcement learning model parameters and clinical variables were detected in AN (uncorrected p < .05). Separate hierarchical linear regression models indicated the size of positive PE and of negative PE on punishment trials in Set 1 significantly added to the prediction of discharge BMI controlling for admission BMI, treatment length, and medication status (positive PE: multiple R2 = .62, F_change(1,34) = 9.528, p = .004; negative PE: multiple R2 = .56, F_change(1,34) = 15.901, p < .001). Both models remained significant after Bonferroni correction.
To test whether both positive and negative PE predicted a portion of the change in BMI with treatment, we entered both into the regression model (multiple R2 = .64, F_change(2,33) = 8.546, p = .001). Negative PE (Beta = −.348, t = −2.475, p = .019) more potently predicted discharge BMI than did positive PE (Beta = −.141, t = −1.063, p = .296) (Figure 4C). In other words, AN with smaller negative PE on punishment trials on Set 1, i.e., values closer to −1.0, gained the most weight. Negative PE will approach −1 on punishment trials when successful performers learn to expect outcomes that are close to the favorable outcome, coded 0, but instead receive an unfavorable outcome, coded −1. The eight AN participants with negative PE between −.85 and −1.0 in fact had an average expectancy of 0.013 on punishment trials when negative PE occurred (range for entire sample: −.467 to .545) (see Supplement). Moreover, on punishment trials where negative PE occurred, the regression of expectancy values onto negative PE produced a significant negative regression weight (b = −.419, p = .048), implying that AN participants with larger negative PE (i.e. closer to zero) had more negative expectancies about avoiding loss.
Sensitivity Analyses
As expected, the low weight group had lower BMI at admission, time of study, and discharge (all ps < .001, all Cohen’s ds > 1.0), and showed greater change in BMI during treatment (p = .01, Cohen’s d = 1.1), but weight status groups did not differ on any other clinical measure. Medication status groups did not differ on any clinical measure, including BMI, change in BMI during treatment, length of treatment, or self-report questionnaires. The rmANOVA results from the full sample reported above were observed in the subsample contrasts. Regression results (PE on punishment trials predicting discharge BMI) were observed only in the low weight sample. Overall, sensitivity analyses suggest weight and medication status did not appreciably contribute to the full sample results.
DISCUSSION
This is the first study to apply computational models of reinforcement learning to assess learning from both reward and punishment in restricting-type AN using an instrumental probabilistic associative learning task. A unique aspect to this study is that we distinctly examined differences in instrumental reinforcement learning from better or worse than expected outcomes by deriving trial-specific PE estimates for both reward and punishment conditions. We then modeled and compared learning based on positive and negative PEs separately for reward and punishment trials to examine learning rate when a positive PE occurs (unexpectedly favorable outcome) and when a negative PE occurs (unexpectedly disappointing outcome). Model-based results indicated that both HC and AN learn better following positive PEs compared to negative PEs. Consistent with our hypotheses, individuals with AN have lower learning rates for positive and negative PEs compared to HC. This indicates that AN learn less than HCs from the same PE, slowing their learning of favorable choices. This deficit in learning to predict the most favorable choice was also evidenced in their optimal choice performance by a flatter learning curve on reward trials and by fewer optimal responses on punishment trials. These results are consistent with previous work showing poorer learning performance from reward-based feedback in ill AN (Foerde & Steinglass, Reference Foerde and Steinglass2017) and extends these findings to learning from loss-based feedback. Deficits in learning from punishment could help explain the rigid persistence of disordered eating behaviors despite negative consequences.
The degree to which cognitive inflexibility and difficulty set-shifting in AN contribute to altered reinforcement learning remains to be determined; assessing reversal learning may inform this issue. The lower explore-exploit β values observed in the AN group suggest that poor learning was not due to perseverative responding, as lower β values indicate that individuals with AN were less decisive about exploiting what they had learned and continued to explore stimulus-response outcomes rather than employing the same strategy across all trials, regardless of whether they were aware of the strategy employed. Clinically, AN is characterized by increased sensitivity to uncertainty (Kesby, Maguire, Brownlow, & Grisham, Reference Kesby, Maguire, Brownlow and Grisham2017). It is possible that diminished certainty in exploiting what they learned is secondary to uncertainty in the task contingencies, although this was not directly tested.
In addition to comparing groups on response accuracy and rate of learning, we also examined the size of PE as a determinant of learning level. Counter to our hypotheses, no group differences in magnitude of positive and negative PEs within reward or punishment trials were detected. However, within the AN group, the magnitude of negative PE when punishment was possible was most strongly associated with treatment outcome. Moreover, larger negative PEs were associated with more negative expectations on punishment trials, suggesting that AN individuals who gained the least amount of weight during the course of treatment held negative expectancies about avoiding loss on punishment trials. This negative expectancy is consistent with reports of elevated punishment sensitivity, increased lose-shift behavior on a reversal learning task (Geisler et al., Reference Geisler, Ritschel, King, Bernardoni, Seidel, Boehm and Ehrlich2017), negative interpretation bias for ambiguous social stimuli that involve the risk of rejection, and tendency to resolve ambiguity in a negative manner in AN (Cardi, Di Matteo, Gilbert, & Treasure, Reference Cardi, Di Matteo, Gilbert and Treasure2014; Cardi, Di Matteo, Corfield, & Treasure, Reference Cardi, Di Matteo, Corfield and Treasure2012; Cardi et al., Reference Cardi, Turton, Schifano, Leppanen, Hirsch and Treasure2017). No other learning parameter or clinical measure predicted BMI change during treatment, and PEs were not associated with self-report measures of sensitivity to reward or punishment, suggesting that this learning metric may be a particularly sensitive prognostic indicator.
Other studies have observed a relationship between reward PE brain response and weight gain in AN (DeGuzman, Shott, Yang, Riederer, & Frank, Reference DeGuzman, Shott, Yang, Riederer and Frank2017; GKW Frank et al., Reference Frank, DeGuzman, Shott, Laudenslager, Rossi and Pryor2018); for example, elevated absolute PE (positive and negative PE combined) response in the caudate, orbitofrontal cortex and insula has been associated with less weight gain during inpatient treatment. Taken together, our behavioral findings further support the role of altered PE in the pathophysiology of AN, extending prior findings to include operant learning in response to both reward and punishment, and are consistent with the hypothesis that a failure to appropriately modify expectancies may contribute to poor outcome.
Strengths of this study include novel aspects and refinements of the reinforcement learning model, that included modeling segregating learning for each of the four stimuli within a set, adding parameters to account for choice biases rapidly acquired on early trials, performing Bayesian estimates of model parameters for each subject, and modeling separate positive and negative PE learning rate parameters. However, reinforcement learning models are inherently limited by the parameters included in the model. While our models demonstrated good fit to the behavioral data, future work may consider testing models with additional parameters, such as a stickiness (or perseveration) parameter (Palminteri, Khamassi, Joffily, & Coricelli, Reference Palminteri, Khamassi, Joffily and Coricelli2015). To increase generalizability, we did not exclude for medication use and co-morbidities. Prior studies in major depressive disorder (MDD) report worse learning to reward (Herzallah et al., Reference Herzallah, Khdour, Taha, Elmashala, Mousa, Taha and Gluck2017), and that SSRI antidepressants impair learning from negative feedback (Herzallah et al., Reference Herzallah, Moustafa, Natsheh, Abdellatif, Taha, Tayem and Gluck2013). Notably, 50% of our sample was prescribed antidepressants, and 20% of our sample had a comorbid MDD diagnosis. Although our sensitivity analysis suggests medication status did not contribute to overall results, larger, controlled studies are needed to examine the effects of these clinical variables on reinforcement learning. We also do not have neuropsychological data to characterize the general cognitive function of participants; however, groups did not differ on reaction time on the PALT (see Supplement), suggesting the AN group did not have slowed processing speed indicative of cognitive impairment or medication effects. Thus, it is unlikely that differences in reward/punishment learning in AN are reflective of broader cognitive impairment. Lastly, change in BMI is just one metric of treatment outcome; limited data on cognitive symptoms prevented analysis of other outcome measures.
Conclusions
Results suggest that both AN and HC groups learned better following unexpected favorable outcomes (positive PEs) than unexpected disappointing outcomes, suggesting that maximizing positive PEs may potentiate learning in general. Moreover, individuals with AN demonstrated slower learning from both positive and negative experience compared to HC. Additionally, negative PEs on punishment trials were associated with worse treatment outcome. Treatments that modify negative expectations about avoiding loss, or the perceived value of the outcomes themselves, either with medication or cognitive-behavioral strategies, may be effective in promoting recovery. Overall, findings support the potential of applying computational approaches to reinforcement learning in AN to enhance mechanistic explanations of behavior, identify new neurobehavioral constructs relevant to psychopathology and advance treatment development through target identification.
Supplementary material
For supplementary material accompanying this paper visit https://doi.org/10.1017/S1355617721001326
ACKNOWLEDGMENTS
We thank Noriko Coburn, Sarah Kouzi, Danika Peterson, and Emily Romero for assistance with participant screening and data collection. In addition, we thank the individuals who participated in this study for their time.
FINANCIAL SUPPORT
This work was supported in part by grants from the National Institute of Mental Health (R01MH113588 to ABG & CEW, R21MH118409 to CEW). The contents of this manuscript are solely the responsibility of the authors and do not necessarily represent the official view of the NIH.
CONFLICT OF INTEREST
None of the authors have conflicts of interest to disclose.
ETHICAL STANDARDS
The study was approved by the Institutional Review Board of the University of California, San Diego, research was completed in accordance with the Helsinki Declaration, and all participants gave written informed consent and received a stipend.


 Open access