


Introduction
Tropical dry forests contain unique species adapted to low annual rainfall and intense dry seasons (Kier et al. Reference Kier, Mutke, Dinerstein, Ricketts, Küper, Kreft and Barthlott2005; Sunderland et al. Reference Sunderland, Apgaua, Baldauf, Blackie, Colfer, Cunningham, Dexter, Djoudi, Gautier, Gumbo, Ickowitz, Kassa, Parthasarathy, Pennington, Paumgarten, Pulla, Sola, Tng, Waeber and Wilme2015). These systems are high-priority targets for conservation because they face higher deforestation rates than humid tropical forests (Janzen Reference Janzen, Wilson and Peter1988; Wilson et al. Reference Wilson, McBride, Bode and Possingham2006; Stan & Sanchez-Azofeifa Reference Stan and Sanchez-Azofeifa2019). Fundamental ecological questions on such common ecological topics as species composition and diversity, forest structure, and phenology (Sanchez-Azofeifa et al. Reference Sanchez-Azofeifa, Castro, Rivard, Kalascka and Harriss2003, Reference Sanchez-Azofeifa, Guzmán, Campos, Castro, Garcia-Millan, Nightingale and Rankine2017; Morellato et al. Reference Morellato, Camargo and Gressler2013) remain to be answered in tropical dry forests given that they tend to have high spatial variation and might be more diverse than humid forests in terms of function and variation in leaf renewal and senescence (Hulshof et al. Reference Hulshof, Martínez-Yrízar, Burquez, Boyle and Enquist2013). Tropical dry forests can be highly seasonal, but the phenological patterns are dependent on species composition and climate (Valdez-Hernández et al. Reference Valdez-Hernández, Andrade, Jackson and Rebolledo-Vieyra2010; Mendivelso et al. Reference Mendivelso, Camarero, Gutiérrez and Castaño-Naranjo2016) and may be related to spatial variation in forest structure, as seen in other deciduous systems (Peaucelle et al. Reference Peaucelle, Janssens, Stocker, Descals Ferrando, Fu, Molowny-Horas, Ciais and Peñuelas2019; Peng et al. Reference Peng, Xia, Chen, Zhi and Xu2021) Additionally, the diversity in function might be due to mechanisms to survive water scarcity; however, there is limited understanding on the drivers of the diversity in function (Reich & Borchert Reference Reich and Borchert1984).
The Gran Chaco biome is one of the largest continuous areas of dry forests in the world (Kuemmerle et al. Reference Kuemmerle, Altrichter, Baldi, Cabido, Camino, Cuellar, Cuellar, Decarre, Díaz, Gasparri, Gavier-Pizarro, Ginzburg, Giordano, Grau, Jobbágy, Leynaud, Macchi, Mastrangelo, Matteucci, Noss, Paruelo, Piquer-Rodríguez, Romero-Muñoz, Semper-Pascual, Thompson, Torrella, Torres, Volante, Yanosky and Zak2017). This biome is principally shared among Paraguay, Argentina and Bolivia. The driest portion in Paraguay is called the Dry Chaco. In recent years, it has undergone significant deforestation due to agricultural expansion for soybeans and cattle ranching, losing 1.4% of its original area annually (Kuemmerle et al. Reference Kuemmerle, Altrichter, Baldi, Cabido, Camino, Cuellar, Cuellar, Decarre, Díaz, Gasparri, Gavier-Pizarro, Ginzburg, Giordano, Grau, Jobbágy, Leynaud, Macchi, Mastrangelo, Matteucci, Noss, Paruelo, Piquer-Rodríguez, Romero-Muñoz, Semper-Pascual, Thompson, Torrella, Torres, Volante, Yanosky and Zak2017; Veit & Sarsfield Reference Veit and Sarsfield2017). Knowledge about the factors that influence the ecological function and resilience of the Dry Chaco is limited (Olson et al. Reference Olson, Dinerstein, Wikramanayake, Burgess, Powell, Underwood, d’Amico, Itoua, Strand, Morrison, Loucks, Allnutt, Ricketts, Kura, Lamoreux, Wettengel, Hedao and Kassem2001; Sanchez-Azofeifa et al. Reference Sanchez-Azofeifa, Quesada, Paul Rodríguez, Nassar, Stoner, Castillo, Garvin, Zent, Calvo-Alvarado, Kalacska, Fajardo, Gamon, Cuevas-Reyes, Michoacán and Exico2005; Kier et al. Reference Kier, Kreft, Tien, Jetz, Ibisch, Nowicki, Mutke and Barthlott2009; Kuemmerle et al. Reference Kuemmerle, Altrichter, Baldi, Cabido, Camino, Cuellar, Cuellar, Decarre, Díaz, Gasparri, Gavier-Pizarro, Ginzburg, Giordano, Grau, Jobbágy, Leynaud, Macchi, Mastrangelo, Matteucci, Noss, Paruelo, Piquer-Rodríguez, Romero-Muñoz, Semper-Pascual, Thompson, Torrella, Torres, Volante, Yanosky and Zak2017; Baumann et al. Reference Baumann, Israel, Piquer-Rodríguez, Gavier-Pizarro, Volante and Kuemmerle2017), and an improved understanding of how the Dry Chaco forests could respond to climatic change is critical for conservation, adaptation and mitigation (Sanchez-Azofeifa et al. Reference Sanchez-Azofeifa, Quesada, Paul Rodríguez, Nassar, Stoner, Castillo, Garvin, Zent, Calvo-Alvarado, Kalacska, Fajardo, Gamon, Cuevas-Reyes, Michoacán and Exico2005; García-Cervigón et al. Reference García-Cervigón, Camarero, Cueva, Espinosa, Escudero, García-Cervigón, Camarero, Cueva, Espinosa and Escudero2020).
Assessing leaf phenology is a good approach to fill gaps of knowledge about Dry Chaco Forest variation at landscape to regional scales because phenology integrates physiological processes and reflects local differences in species adaptations to their environment (Sakai & Sakai Reference Sakai and Sakai2001; Cleland et al. Reference Cleland, Chuine, Menzel, Mooney and Schwartz2007; Kushwaha et al. Reference Kushwaha, Tripathi, Tripathi and Singh2011; Richardson et al. Reference Richardson, Keenan, Migliavacca, Ryu, Sonnentag and Toomey2013). Also, understanding how phenology within communities shifts as a function of seasonal climate fluctuations, and forest structure (Badeck et al. Reference Badeck, Bondeau, Bottcher, Doktor, Lucht, Schaber and Sitch2004) will allow an improved understanding of drivers of Dry Chaco forest variation. Forecasting and managing tropical dry forests under current climate predictions require greater understanding of critical drivers in dry forests (Malhi & Phillips Reference Malhi and Phillips2004; Breshears et al. Reference Breshears, Cobb, Rich, Price, Allen, Balice, Romme, Kastens, Floyd, Belnap, Anderson, Myers and Meyer2005; Anadón et al. Reference Anadón, Sala and Maestre2014; Masson-Delmotte et al. Reference Masson-Delmotte, Zhai, Pörtner, Roberts, Skea, Calvo, Priyadarshi, Shukla, Ferrat, Haughey, Luz, Neogi, Pathak, Petzold, Pereira, Vyas, Huntley, Kissick, Belkacemi and Malley2019), especially given that shifts in phenology are one of the most noticeable responses to climate change (Bertin Reference Bertin2008; Scranton & Amarasekare Reference Scranton and Amarasekare2017) and that changes in the timing of phenological events could alter ecosystem function (Ettinger et al. Reference Ettinger, Chamberlain and Wolkovich2022), carbon dynamics (Cleland et al. Reference Cleland, Chuine, Menzel, Mooney and Schwartz2007) and diversity (Fauset et al. Reference Fauset, Baker, Lewis, Feldpausch, Affum-Baffoe, Foli, Hamer and Swaine2012).
In this study, we integrate forest inventory datasets from permanent plots located in the Paraguayan Dry Chaco with monthly phenology calculated using PlanetScope satellite-derived Normalized Difference Vegetation Index (NDVI) time series and historical climate data from WorldClim. Here, we aim to identify bioclimatic predictors of forest structure and composition and assess the relation between phenology, climate, and forest structural and compositional variables. We addressed the following questions: a) what are the strongest bioclimatic variables related to structure and composition? b) how does phenology track climate variation including any lags in phenological response to climate? c) what structural and compositional variables have the strongest correlation with phenology in the period with most water stress? Since the vegetation in the Chaco is xerophytic (Boletta et al. Reference Boletta, Ravelo, Planchuelo and Grilli2006), we expected precipitation to be the most significant determinant of structure and composition and that phenology would respond to monthly precipitation, indicating drought-deciduousness. Additionally, we expected increased NDVI values in the dry season to have strong relationships with structure and composition, because all these variables are related to the trees adaptation to water stress, including their ability to remain photosynthetically active during the dry season.
Materials and methods
Study sites
For this study, we used nine permanent plots located in the Paraguayan Dry Chaco Ecoregion (Figure 1) that span the rainfall and temperature gradient of this region. Vegetation is xerophytic, and soils are located on an alluvial plain, ranging from very loose sandy soils to clay-rich compact soils (S1). Elevation decreases, and rainfall gradient generally increases from West to East. The precipitation gradient in the area varies between 600 and 800 mm/year, condensed in a rainy season from November to February. The dry season, defined as months with less than 10% of annual precipitation and less than 25 mm of rain per month for this ecoregion (Gasparri & Baldi Reference Gasparri and Baldi2013), is from June to August. Mean annual temperature is 20.9 °C.
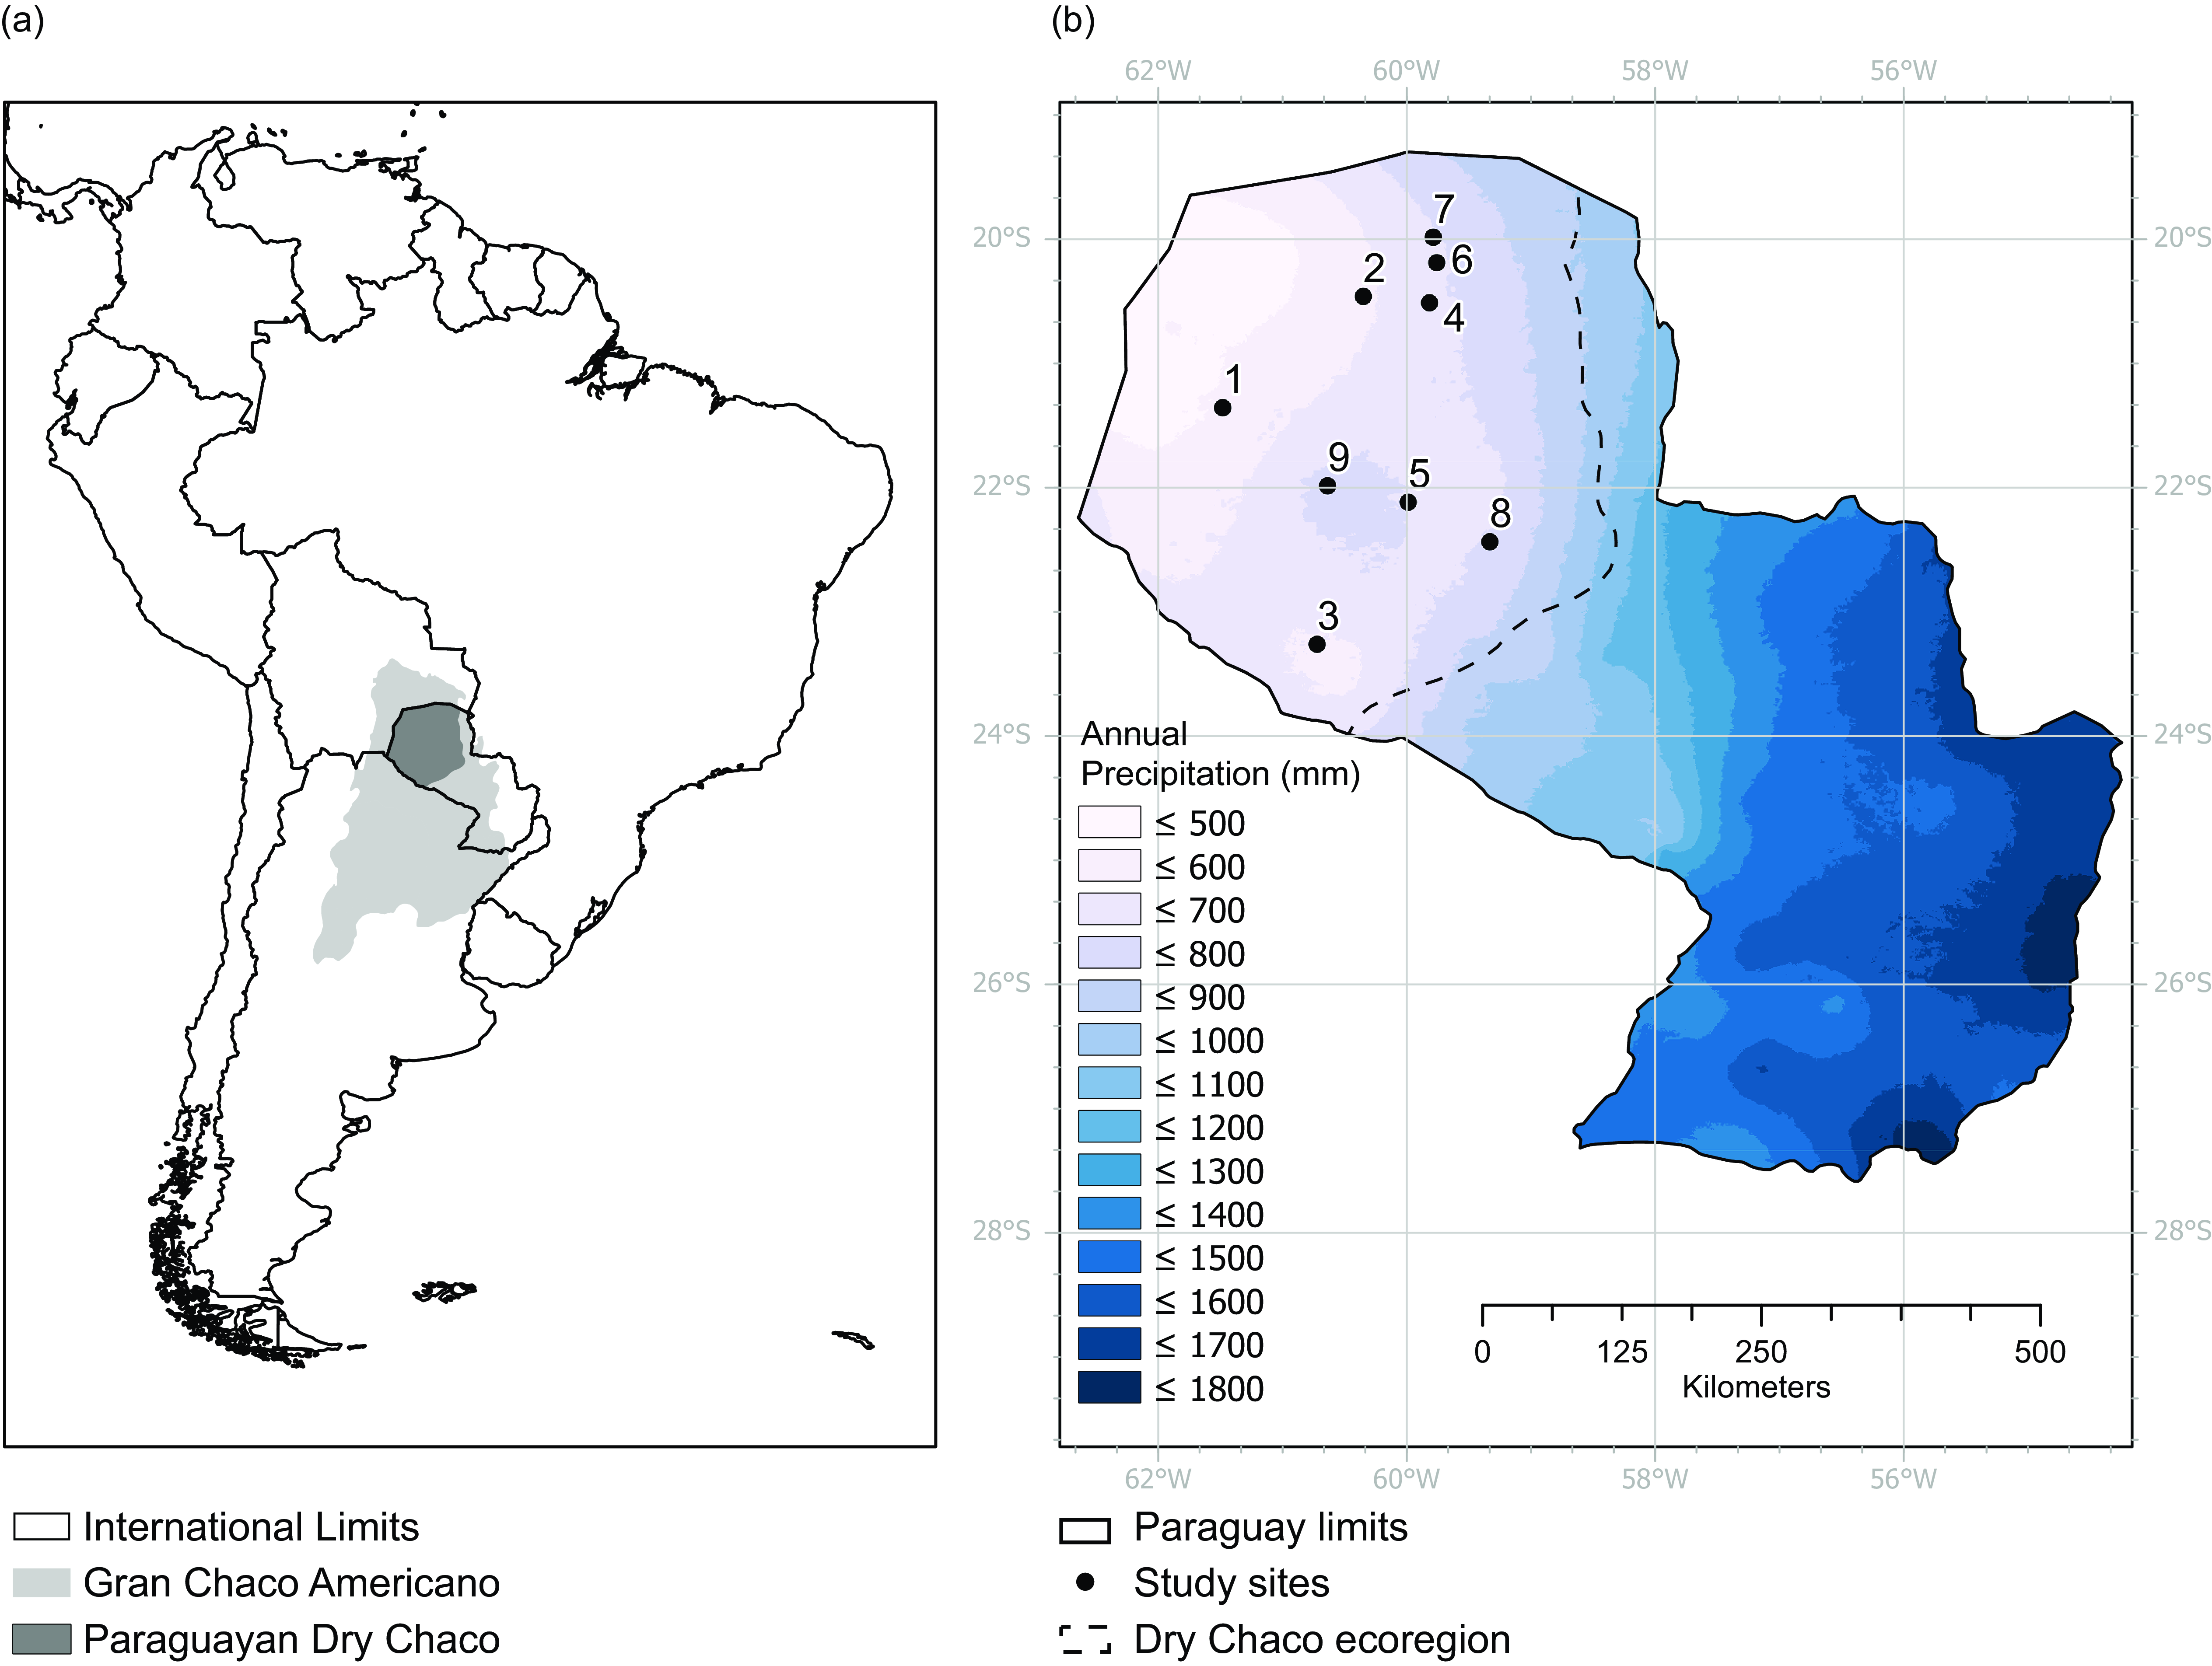
Figure 1. Geographic location of the study site. a) Location of the Paraguayan Dry Chaco (dark grey) within the South American Gran Chaco. b) Location of the study sites in Paraguay within precipitation gradient. The dashed line indicates the Dry Chaco boundaries.
The 1-ha plots are part of the Paraguayan Permanent Plot Network to Monitor Biodiversity, coordinated by the Forestry Program – School of Agrarian Sciences at the Universidad Nacional de Asunción. Each plot has been surveyed once between 2001 and 2014. The mean distance between plots is 77 km. The plots are in public and private old-growth forest reserves with no records of disturbance historically. Examination of the Landsat records confirm that the plots were in continuous forest until the 1980s. Currently, the plots span different levels of fragmentation (continuous forests and large and small fragments) (S2).
Forest structure and composition
All individuals with a diameter at breast height (DBH) ≥10 cm were included in the inventories. The data recorded were species identity, DBH and local coordinates. Total tree height (m) mensuration using handheld instruments like clinometers or hypsometers in the Chaco show difficulties due to a closed canopy and thick understory, and for that reason, height was estimated by visual assessments of an experienced forester. This is a usual practice in the Chaco (Gobbi et al. Reference Gobbi, Van Rompaey, Loto, Gasparri and Vanacker2020), and it is shown to be reliable when other methods are not available in tropical forests (Silva et al. Reference Silva, Curto, Soares and Piassi2012). We calculated stem density (Nind ha−1), quadratic mean diameter (QMD) (cm) (Curtis & Marshall Reference Curtis and Marshall2000), mean height (m), basal area (m2 ha−1) and total aboveground biomass (AGB) (kg ha−1) (methods for calculating AGB can be found in S3). The compositional parameters calculated per plot were species richness, Shannon diversity index (‘H’) (Shannon Reference Shannon and Wyner1993; Spellerberg & Fedor Reference Spellerberg and Fedor2003), Fisher’s α logarithmic series (Fisher et al. Reference Fisher, Corbet and Williams1943) and Pielou evenness index (‘J’) (Feldman Reference Feldman1970). We also calculated ‘Sorensen’s dissimilarity index (Sørensen Reference Sørensen1948) to test the similarity between plots. We calculated these compositional values with the vegan package (Oksanen et al. Reference Oksanen, Blanchet, Friendly, Kindt, Legendre, Mcglinn, Minchin, O’Hara, Simpson, Solymos, Henry, Stevens, Szoecs and Maintainer2019) in R software (R Core Team 2020). A summary table of the study sites can be found the Supplementary material (S4)
Remote sensing data acquisition
Monthly satellite imagery from Planet Labs Inc. was acquired from January to December 2018. The product used was PlanetScope Analytic Basic Scene, which derives from the RapidEye microsatellite constellation, with a spatial resolution of 3 × 3 m, and a high repeat frequency (one or more times per day). The product has four bands (blue, green, red and near-infrared). The product is radiometrically corrected for differences between detectors and geometrically corrected for optical distortions caused by the sensors. We obtained one PlanetScope cloud-free image per month (12) per plot (9), for a total of 108 images (Table S5). We chose the images that covered the plots in their entirety.
Satellite data processing
Phenology variation was measured with the NDVI, a widely used metric to study phenology. NDVI is the ratio between the visible red (R VIS) and near-infrared light (R NIR), which provides an indirect measure of photosynthetic activity. Therefore, changes in NDVI metrics suggest changes in foliar phenology (Myneni et al. Reference Myneni, Hall, Sellers and Marshak1995; Pettorelli et al. Reference Pettorelli, Vik, Mysterud, Gaillard, Tucker and Stenseth2005; Gerard et al. Reference Gerard, George, Hayman, Chavana-Bryant and Weedon2020). Monthly NDVI per plot was calculated as follows:
 $$NDVI = {\displaystyle{{\left( {{R_{NIR - {\rm{\;}}}}{R_{VIS{\rm{\;}}}}} \right)} \over {\left( {{R_{NIR}} + {R_{VIS{\rm{\;}}}}} \right)}}}$$
We processed the satellite imagery with the software ENVI 5.5 (Exelis Visual Information Solutions 5.5), which allows the integration of Planet sensors. We stacked each monthly NDVI into a set of 12 bands from January to December and subset the data to the plot coordinates with a buffer of approximately 120 m, excluding areas coinciding with roads. Per plot, we computed the minimum, maximum, mean and standard deviation of NDVI over the 12 months. For each plot, we identified the start of the growing season (interval between months with the greatest increase in mean NDVI) and the end of the growing season or senescence as the between-month interval with the greatest NDVI decrease (Tateishi & Ebata Reference Tateishi and Ebata2004; Zeng et al. Reference Zeng, Xiang, Zhou, Ouyang, Zeng, Chen, Zhao and Valverde-Barrantes2020).
Climate variables
We used climatic data downloaded from WorldClim 2 (https://www.worldclim.org on 07/20/2019), a historical climate dataset (1970–2000) (Fick & Hijmans Reference Fick and Hijmans2017), at the highest spatial resolution of 30 seconds (∼1 km2). The first set of WorldClim2 variables, which we refer to as ‘bioclimatic data’, contains 19 variables representing annual trends and limiting climatic factors (S6). The second set of WorldClim2 variables, which we refer to as ‘climate data’, corresponds to mean monthly precipitation (mm) and temperature (°C), which were used for the phenological assessments. We extracted bioclimatic variables and the mean monthly precipitation and temperature using the software ArcGIS Pro. We validated the monthly climate data with monthly meteorological station records provided by the DINAC – Dirección Nacional de Aeronáutica Civil (Paraguayan Office of Civil Aeronautics) using linear regressions to make sure it was representative at the plot level (Figure S7). We found significant correlations for both variables, but the explanatory power given by the adjusted R 2 was markedly lower in precipitation (R 2 = 0.63) compared to temperature (R 2 = 0.92). However, the WorldClim dataset includes fewer input data from tropical and dry regions and tends to have more unexplained variance in these regions as a result (Fick & Hijmans Reference Fick and Hijmans2017). We decided to use the WorldClim dataset since it has more data points that cover our study sites, in contrast to the meteorological station data which only provide data from two stations that are not evenly distributed within our study area.
Data analysis
Before running the analysis, we standardised the 19 bioclimatic variables by centring the data and dividing them by one standard deviation. To answer our research questions, first, we tested the importance of bioclimatic variables in determining mean structural and compositional variables per site with simple linear univariate regressions. We included only one bioclimatic variable in each regression because there is a high correlation between temperature and precipitation data from WorldClim, and some variables are derived from each other. We included a false discovery correction to avoid type I error (García Reference García2003). Then, we performed a cross-correlation analysis to identify the time lag between NDVI and precipitation and temperature and performed multiple linear regressions to assess the association between mean monthly precipitation and temperature values and mean monthly NDVI with a lag of 1 or 2 months (see supplementary material S8). To understand synchrony of the phenological response to monthly precipitation, we compared within-plot variation of NDVI (standard deviation among pixels) of each month (m) with the precipitation change between the months (m2–m1). Third, we performed forward stepwise regressions in the month of most water stress (August), which we assumed occurred at the end of the dry season, to identify the structural and compositional variables that explain month-specific NDVI. We used an alpha level of 0.05 for all statistical tests. We synthesised our methods in a workflow (Figure S9).
Results
Bioclimatic determinants of forest structure and composition
The structural and compositional variables related to bioclimatic factors were stem density, Pielou evenness index and basal area (Table 1). Precipitation seasonality (Bio15) explained the most variation in stem density (p < 0.005) with a negative relationship between the two variables. Pielou evenness index (J’) was positively correlated with precipitation seasonality (Bio15) (p < 0.005) and negatively correlated with precipitation of driest month (Bio17) (p = 5.02 × 10⁻³) and precipitation in the coldest quarter (Bio19) (p = 0.016). Basal area was the structural variable significantly correlated with the highest number of bioclimatic predictors; it was negatively correlated with mean diurnal temperature range (Bio2) (p = 0.0104), annual temperature range (Bio7) (p = 0.0369) and temperature seasonality (Bio 4) (p = 0.0369) and positively related to mean temperature in the coldest month (Bio6) (p = 0.0369).
Table 1. Linear regression models using forest structural and compositional variables as dependent variables and standardised bioclimatic variables as independent variables.

Phenological variation explained by climate
For all plots, the maximal decrease in mean NDVI was from June to July, indicating the end of the growing season (Figure 2). The lowest NDVI values were detected in July, August and September, indicating senescence. The highest increase in mean NDVI was from October to November, indicating the start of a new growing season, reaching peak NDVI in February. Additionally, we plotted the phenological cycles at the plot level to get a better understanding of the NDVI variation among study sites (Figure 3). The peak NDVI occurs from January to March depending on the plot, the standard deviation of mean NDVI increased considerably as the dry season got closer. Eight plots showed the end of the growing season in July, reaching the lowest mean NDVI between July and October. With the approach of a new growing season, the mean NDVI increased and the standard deviation decreased. A simple linear regression between monthly precipitation changes and standard deviation of NDVI (Figure 4) within each plot showed a trend (p = 0.004, adj. R 2 = 0.3), indicating that decreases in precipitation result in a more heterogeneous phenological response. Months of decreasing precipitation which occur at the beginning of the dry season (Figure 3) had greater within-plot variation in NDVI than months of increasing precipitation at the dry to wet season transition (Figure 3) when within-plot NDVI variation was lowest (Figure 4). The NDVI and precipitation seasonal patterns were broadly similar, although precipitation declined about a month earlier than NDVI between April and July (Figure 5). Mean temperature has a minimum earlier in the year than NDVI and precipitation. At the scale of the whole ecoregion including all plots, we found correlations between mean monthly NDVI, temperature lagged (earlier) by 1 and 2 months, and precipitation lagged (earlier) by 1 month and without a lag (S7). The best model given by AIC was precipitation lagged by 1 month, showing an adjusted R 2 of 0.71 (Table 2).

Figure 2. One year of variation in NDVI. The dots represent study site values, while the orange line connects the mean representing the phenological trend at the ecoregion level.

Figure 3. Phenological cycles of the nine study sites, along with precipitation and temperature changes and standard deviation of NDVI. The y-axis contains standardised values for the three variables.

Figure 4. Linear regression between monthly precipitation changes (precipitation in month2–month1) and the standard deviation of NDVI within a plot in month 1. Each dot is a different plot and month. Positive values in precipitation change indicate the precipitation increased since the previous month.
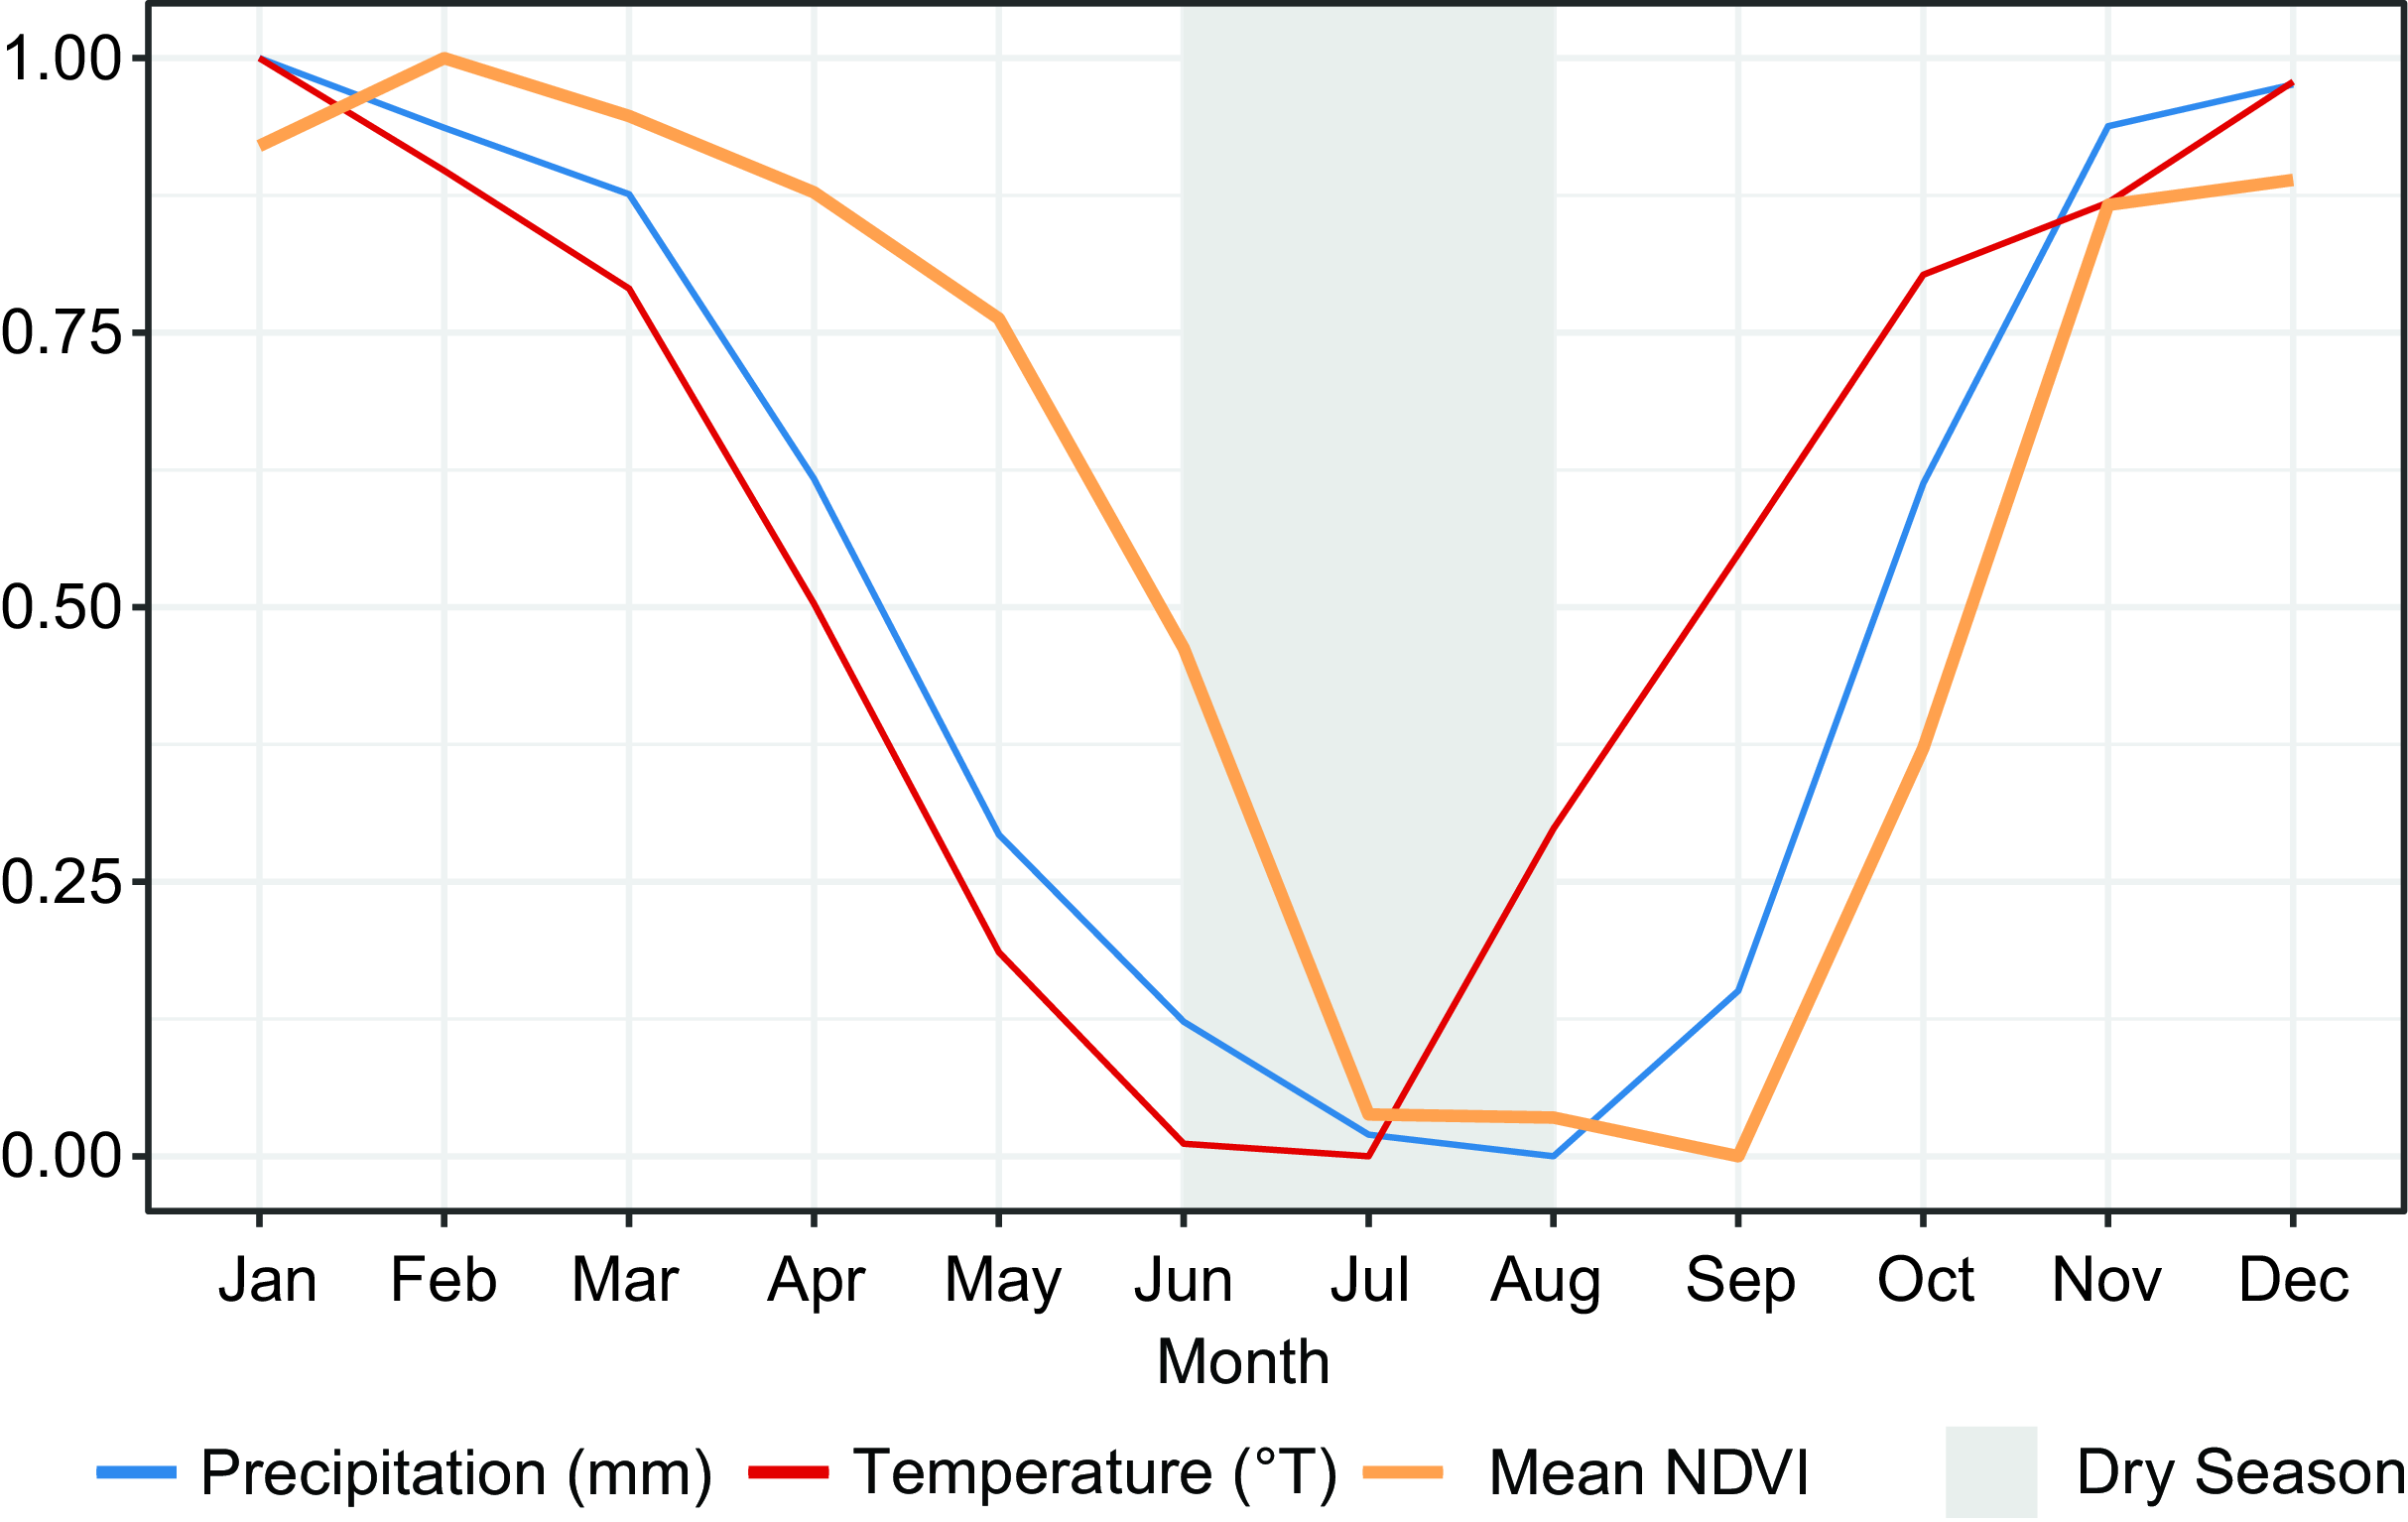
Figure 5. Variation in climate and phenology. The y-axis represents standardised values of mean NDVI, precipitation and temperature. The phenological response to climate observed from mean NDVI presents a delay of 1 month between the start of the dry season (driest 3 months with precipitation of less than 25 mm and less than 10% of annual precipitation) and senescence. The values were standardised for visualisation purposes.
Table 2. Linear models showing relation between NDVI, and temperature lagged by 1 (m−1) and 2 (m−2) months, and precipitation with no lag (m) or lagged by 1 month (m−1).

Note: *p < 0.1; **p < 0.05; ***p < 0.01.
Phenology during the dry season
The structural and compositional variables related to NDVI in the month with most water stress (August) were Shannon diversity index and basal area (with negative relationships) and total tree height (with a positive relationship) (p = 0.03, adj. R 2 = 0.68). The resulting model was as follows:
 $$\begin{gathered}NDV{I_{August}} = 0.619 - 0.099 \times Shannon + 0.018\; \times Height \\ - 0.003\; \times \;Basal\;Area\;\; \\ \end{gathered}$$
Discussion
Bioclimatic determinants of forest structure and composition
Water availability is a key driver of tropical dry forest composition and structure; however, factors like geographical location, scale and precipitation metrics shape the direction of those relations. We found that precipitation seasonality had a positive relationship with the Pielou evenness index (‘J’), and we found that precipitation in the driest month had a negative relationship with Pielou’s index. Across the tropics, Clinebell et al. (Reference Clinebell, Phillips, Gentry, Stark and Zuuring1995) found that species richness was positively correlated with annual rainfall and negatively related to rainfall seasonality. Similar claims can be found in Leigh et al. (Reference Leigh, Davidar, Dick, Puyravaud, Terborgh, Ter Steege and Wright2004), but at local scales, these relationships can vary. For dry tropical forests, while Maia et al. (Reference Maia, de Souza, de Aguiar-Campos, Fagundes, Santos, de Paula, Santos, Silva, de Oliveira Menino and Dos Santos2020) found a positive relationship between annual precipitation and species richness, others (Gillespie et al. Reference Gillespie, Grijalva and Farris2000; Trejo & Dirzo Reference Trejo and Dirzo2002) found no correlation. Our results suggest that longer dry seasons that increase drought stress promote a more even composition across the Dry Chaco forests. Given that this is a water-limited ecosystem, we presume the environment is performing a strong selective force through abiotic filtering. More drought stress could be eliminating less drought-tolerant species or decreasing the abundance of the most common species (Alon & Sternberg Reference Alon and Sternberg2019; Castillioni et al. Reference Castillioni, Wilcox, Jiang, Luo, Jung and Souza2020).
We note that while other diversity measures tested in our study (Shannon diversity index and Fisher’s α logarithmic series) did not have significant relationships with precipitation variables, they were positively correlated with Pielou’s index (R 2 = 0.8 for Shannon and R 2 = 0.4 for Fisher’s α), suggesting that forests with greater rainfall seasonality had higher diversity, as well as greater evenness. When comparing rainfall seasonality and beta diversity, the same pattern is observed, supporting that plots under similar conditions of seasonality have similar species diversity (S9).
Factors other than those included in this study that may be affecting diversity and need further study in Dry Chaco forests are potential evapotranspiration (PET) (Trejo & Dirzo Reference Trejo and Dirzo2002), insolation (Balvanera et al. Reference Balvanera, Lott, Segura, Siebe and Islas2002) and soil type (Peña-Claros et al. Reference Peña-Claros, Poorter, Alarcón, Blate, Choque, Fredericksen, Justiniano, Leaño, Licona, Pariona, Putz, Quevedo and Toledo2012). For instance, PET reflects water availability and takes into consideration a variety of factors like solar radiation, temperature and precipitation, all of this factors plus their fluctuations can enhance or decrease the diversity as it had been shown in other ecosystems in China (Li et al. Reference Li, Pandey, Dakhil, Khanal and Pan2022), Mexico (Trejo & Dirzo Reference Trejo and Dirzo2002) and Nepal (Bhattarai & Vetaas Reference Bhattarai and Vetaas2003). Insolation, on the other hand, plays a role on soil water evaporation and disturbance regimes due to drought-related mortality, and the water stress caused by the dry season could be influencing the distribution of species in the Chaco, as it had been observed in other tropical forests (Balvanera et al. Reference Balvanera, Lott, Segura, Siebe and Islas2002). Lastly, soil type is not only important in terms of water-holding capacity, but there is also evidence suggesting that soil biota mediates species diversity and relative abundances in tropical forests (Mangan et al. Reference Mangan, Schnitzer, Herre, Mack, Valencia, Sanchez and Bever2010). Meaning the biotic properties of the soil contribute to the maintenance of species diversity and changes in the soil biota could affect plant diversity.
In addition to unexamined environmental drivers, other dimensions of biodiversity could be considered such as phylogenetic diversity and functional diversity. The Chaco shows low phylogenetic diversity but the greatest phylogenetic turnover when compared to other biomes in South America (Rezende et al. Reference Rezende, Pontara, Bueno, van den Berg and de Oliveira-Filho2020). The unique conditions of the Chaco have resulted in isolated and closely related species (Rezende et al. Reference Rezende, Pontara, Bueno, van den Berg and de Oliveira-Filho2020), which can be threatened by increased aridity expected from climate change, and land use change for cattle ranching (Rito et al. Reference Rito, Arroyo-Rodríguez, Cavender-Bares, Santo-Silva, Souza, Leal and Tabarelli2021). In terms of functional traits, Chaco species show a variety of traits in response to the water-limited conditions like leaf deciduousness, wood density and hydraulic properties, and specific leaf area and leaf life spans (Hulshof et al. Reference Hulshof, Martínez-Yrízar, Burquez, Boyle and Enquist2014). The degree and variation of these traits along the environmental gradient will advance our understanding on how the Chaco species interact and could respond to natural and anthropogenic disturbances. Forest structure can be related to precipitation and temperature variables with a negative correlation between seasonality and stem density (Ter Steege et al. Reference ter Steege, Pitman, Sabatier, Castellanos, Van der Hout, Daly, Silveira, Phillips, Vasquez, van Andel, Duivenvoorden, de Oliveira, Ek, Lilwah, Thomas, van Essen, Baider, Maas, Mori, Terborgh, Vargas, Mogollón and Morawetz2003; Slik et al. Reference Slik, Aiba, Brearley, Cannon, Forshed, Kitayama, Nagamasu, Nilus, Payne, Paoli, Poulsen, Raes, Sheil, Sidiyasa, Suzuki and van Valkenburg2010; Schietti et al. Reference Schietti, Martins, Emilio, Souza, Levis, Baccaro, Pinto, Moulatlet, Stark, Sarmento, de Araújo, Costa, Schöngart, Quesada, Saleska, Tomasella and Magnusson2016), indicating forests with a more seasonal climate have fewer stems. A longer wet season in less seasonal forests is associated with higher moisture, contributing to seed germination and tree recruitment (Ter Steege et al. Reference ter Steege, Pitman, Sabatier, Castellanos, Van der Hout, Daly, Silveira, Phillips, Vasquez, van Andel, Duivenvoorden, de Oliveira, Ek, Lilwah, Thomas, van Essen, Baider, Maas, Mori, Terborgh, Vargas, Mogollón and Morawetz2003). Another forest structural variable, basal area, had a stronger relationship with temperature variables than precipitation variables. Basal area decreased as temporal variability (diurnal, seasonal and annual) in temperature increased. Also, the minimum temperature in the coldest month was positively related to the basal area suggesting that the warmer the dry season (which coincides with the coldest month), the higher the basal area. Although AGB did not have significant relationships with temperature variables, it was strongly correlated with basal area (R 2 = 0.95). On a regional scale, Gasparri & Baldi (Reference Gasparri and Baldi2013) found that AGB increased with higher minimum temperature, which could be evidencing an energetic limitation in productivity and growth (Schippers et al. Reference Schippers, Sterck, Vlam and Zuidema2015; Muller-Landau et al. Reference Muller-Landau, Cushman, Arroyo, Martinez Cano, Anderson-Teixeira and Backiel2021).
Our results focus only on trees with DBH >10 cm; structure and composition of seedlings and saplings in the Dry Chaco could respond differently to the climate variables we used in our analysis. While those differences were not studied in this paper, other studies have found that rainfall seasonality affects the patterns of seedling survival and development, and the combination of high rainfall seasonality and low soil fertility (which is common in dry forests) reduces understory plant diversity. Additionally, regeneration dynamics might be influenced by other factors like canopy openness and seed longevity. Further studies are necessary to determine the patterns of regeneration and succession in the Dry Chaco.
Land use changes and forest fragmentation in the areas surrounding our study plots might be influencing structure and composition as well. This was outside the scope of this study but could explain some differences found in structure and composition. It is well known that the Paraguayan Dry Chaco has experienced extensive deforestation in the last 20 years (de la Sancha et al. Reference de la Sancha, Boyle, McIntyre, Brooks, Yanosky, Cuellar Soto, Mereles, Camino and Stevens2021). Greater edge effects from more fragmentation make trees more prone to wind damage and alter access to resources like radiation, water and nutrients (Saunders et al. Reference Saunders, Hobbs and Margules1991). Also, compositional differences could result from seed dispersal limitations between forest fragments (Rito et al. Reference Rito, Arroyo-Rodríguez, Cavender-Bares, Santo-Silva, Souza, Leal and Tabarelli2021) and increments or immigration of edge-related species into forest interior (Herrero-Jáuregui et al. Reference Herrero-Jáuregui, Camba, Andries, Aguiar, Fahrig and Mastrangelo2022).
Climate regulation of phenology
Phenological events (i.e., leaf flushing and fall, flowering and fruiting) in the dry tropics are attributed to more than one driver, such as water availability (Reich & Borchert Reference Reich and Borchert1984), temperature seasonality (Williams-Linera et al. Reference Williams-Linera, Alvarez-Aquino, Williams-Linera and Alvarez-Aquino2016), animal–plant interactions (Silva et al. Reference Silva, Espírito-Santo and Morais2015), photoperiod (Rivera et al. Reference Rivera, Elliott, Caldas, Nicolossi, Coradin and Borchert2002) and successional stage (Pezzini et al. Reference Pezzini, Ranieri, Brandão, Fernandes, Quesada, Espírito-Santo and Jacobi2014). In this study, we tested the importance of climatic variables in determining phenology and found that the forest phenological response was correlated to both precipitation and temperature, but that the relationship with precipitation was stronger. These relations are not surprising given the temperature variability in the dry Chaco is limited, but precipitation variability, which is directly related to plant water status and deciduousness, is high. Phenological response lagged changes in precipitation by 1 month, explained by the fact that soil water availability and some physiological responses (such as leaf drop) to soil water status are not instantaneous and depend on the cumulative amount of water as well as other factors such as soil properties (Borchert Reference Borchert1994). The Dry Chaco did not show evidence of dry season green-up seen in some other tropical forests, like the Amazon, where a study found an increase in the Enhanced Vegetation Index (EVI) of 25% during the dry season (Huete et al. Reference Huete, Didan, Shimabukuro, Ratana, Saleska, Hutyra, Yang, Nemani and Myneni2006). This suggests that many species have significant enough water balance limitations that they cannot leaf out before rainfall increases.
The importance of precipitation in shaping phenology is in line with a previous study describing phenological patterns in subtropical forests from Argentina, including the Chaco (Blundo et al. Reference Blundo, Gasparri, Malizia, Clark, Gatti, Campanello, Grau, Paolini, Malizia, Chediack, Macdonagh and Goldstein2018), which found a greater proportion of phenological variation as measured by remote sensing indices was explained by precipitation (47%) compared to temperature (27%). Moreover, the lag in NDVI after precipitation change coincides with patterns of precipitation-dependent phenology found in several other forest ecosystems (Tateishi & Ebata Reference Tateishi and Ebata2004). For example, Gómez-Mendoza et al. (Reference Gómez-Mendoza, Galicia, Cuevas-Fernández, Magaña, Gómez and Palacio-Prieto2008) observed lags of 20–40 days between the occurrence of rainfall and the increase in NDVI in Central Africa and found delays of 20–30 days in intra-annual cycles in the vegetation response to rainfall in tropical dry forests in Oaxaca, Mexico. While precipitation appears to be the strongest driver of phenology, effects of temperature on phenological events have been observed in other tropical forests. The interaction between temperature and leaf dynamics has been observed in southeast Asia and in south America (Marques et al. Reference Marques, Roper and Baggio Salvalaggio2004; da Rocha Gripp et al. Reference da Rocha Gripp, Alícida Fernandes Tavares, da Silva Brito, Caliman, Tavares Corrêa Dias, Arcoverde de Mattos, Maria Villela, Paula da Silva, de Assis Esteves and Lemes Martins2020; Kitayama et al. Reference Kitayama, Ushio and Aiba2021).
The Dry Chaco plots show a spatially heterogenous response during the transition from wet season to dry season indicating that species that compose the Dry Chaco may have different cues and thresholds for leaf senescence. Also, within-plot heterogeneity in NDVI was lowest during the onset of the wet season. Similar to our results, differences in start of leaf fall existed between deciduous species in the tropical dry forest in Yucatan, Mexico, but there was less variance in leaf flush at the start of the rainy season (Valdez-Hernández et al. Reference Valdez-Hernández, Andrade, Jackson and Rebolledo-Vieyra2010), indicating greater synchrony among species during leaf-out and supports that precipitation is an important cue for leaf flush and fall.
While our results support the importance of climate in influencing phenology, we acknowledge that other factors, such as soils, also play an important role in determining forest attributes. Soils, which vary significantly in the Gran Chaco (Navarro et al. Reference Navarro, Molina and Pérez de Molaz2006; Moretti et al. Reference Moretti, Morrás, Pereyra and Schulz2019), likely mediate the effects of precipitation on forest structure, composition and phenology. Soil information was not collected in the nine plots, but some differences in soils can be inferred from the Soil and Terrain Database for Latin America and the Caribbean (Dijkshoorn et al. Reference Dijkshoorn, Huting and Tempel2005), which provides a large-scale classification of soil types of the Paraguayan Gran Chaco. From the list of soil attributes, we can infer that the soils of most of the nine plots in this study originate from the same parent material (unconsolidated material with evaporites) and landform (plain slope) (see S1); however, the soil types covered by the nine plots do show differences in root limiting factors, exchangeable ions and saturation. For instance, plot 1, which has the lowest stem density, is the only plot on Haplic Solonetz soils, which have poor drainage and high sodium saturation. Future studies assessing the phenological response of Chaco forests could greatly benefit from including detailed soil measurements at the forest inventory plots, which were not available for this study.
Relationship of phenology with structural and compositional variables
In this study, we found that phenological response, measured by NDVI, in the period of greatest water stress had a complex relationship with forest compositional and structural variables, specifically a negative relation with Shannon diversity index and basal area and a negative relation with mean tree height. The negative relation we found between dry season NDVI and Shannon diversity index might indicate that less diverse Chaco forests have lower levels of deciduousness. Dominance of the forest canopy by semi-deciduous species instead of fully deciduous species could lower diversity but increase dry season NDVI. The positive correlation between mean tree height and dry season NDVI may be due to larger trees that have greater access to subsurface water due to deeper root systems (Iida et al. Reference Iida, Shimizu, Tamai, Kabeya, Shimizu, Ito, Ohnuki, Chann and Keth2016), delaying leaf fall in response to water stress.
We also found a negative correlation between basal area and dry season NDVI. While dry season NDVI and AGB did not have a significant relationship, AGB and basal area were highly correlated, and both measure forest structure and the amount of woody material present. In contrast to our findings, a study encompassing dry Chaco premontane and montane forests, Blundo et al. (Reference Blundo, Gasparri, Malizia, Clark, Gatti, Campanello, Grau, Paolini, Malizia, Chediack, Macdonagh and Goldstein2018) found that as seasonality measured by remote sensing increased (and thus dry season greenness goes down), AGB decreased. However, in each of the five forest types studied there were different relations, including no relation between seasonality and AGB for dry Chaco forest suggesting that the relation between biomass and phenology varies with scale as well as forest type. We suggest that the negative correlation between basal area and NDVI is related to the leaf area index and total leaf biomass. Reich & Borchert (Reference Reich and Borchert1984) explains that forest canopies in seasonally stressed ecosystems (like the Dry Chaco) tend to have high leaf turnover, resulting in lower biomass canopies but with higher photosynthetic rates.
Our results point out that precipitation is the main factor related to Dry Chaco forest’s structure, composition and phenology. Changes in precipitation seasonality, particularly an increase in dry season length (which coincides with the driest and coldest quarter), can affect the number and distribution of species in the Dry Chaco. On the other hand, variation in temperature ranges (daily, seasonally and annually) can affect forest growth and productivity. These trends are in accordance with other studies in dry forests and imply that the main correlate of phenology is precipitation while temperature likely moderates leaf deciduousness. Given our results, increases in minimum temperatures might enhance growth and productivity, but any growth enhancements could be inhibited intensifying water limitations. Diversity, height and basal area are key factors when accounting for dry season phenology because they are related to species dominance and greenness, access to water through deep roots, and photosynthetic efficiency. Although our study encompassed only old undisturbed forests, we acknowledge that in addition to climate change, Dry Chaco forests are exposed to anthropogenic threats such as land use change, fragmentation and fires that can dramatically change structure and function. Further studies, such as the forest response to climate under different disturbances or successional stages, are necessary, in particular in the Paraguayan portion of the Dry Chaco.
Supplementary material
The supplementary material for this article can be found at https://doi.org/10.1017/S0266467423000329.
Acknowledgements
The forest inventory data used in this study were collected by students from the Forest Engineering Program at the Universidad Nacional de Asunción, as part of their academic internships and thesis fieldworks between the years 2001 and 2014, we highly value the time and energy put into the data collection. Thanks to the institutions and individuals who provided authorization to collect data: Ministry of Environment and Sustainable Development of Paraguay, Cooperative Fernheim, Fondo Ganadero, Mariscal Estigarribia Agricultural School, Agroganadera Ita Ka’avo. The authors would like to acknowledge the Dirección Nacional de Meteorología – Paraguay for providing climatic data from their institutional records. The authors also thank Dr Geraldine Klarenberg for her feedback on early drafts and Dr Daniel Colopietro for his help interpreting soils information.
Funding statement
This research received no specific grant from any funding agency, commercial or not-for-profit sectors.
Competing interests
The authors declare no conflict of interest.


 Open access