


1. Introduction
What does it mean when we say that something is a ‘good word for’ a concept? Certain words, like klutz, smooch and smoosh, seem to suit their meanings. We may have a sense that French belle is a more appropriate word for BEAUTY than Swedish vacker. Such intuitions are likely to be somewhat subjective, and influenced by our own experiences, but we all have them. This quality of resemblance between forms and meanings is known as iconicity.
Iconicity – defined here as a perceived resemblance between aspects of form and meaning – is now increasingly recognised as a key property of language (see e.g., Dingemanse et al., Reference Dingemanse, Blasi, Lupyan, Christiansen and Monaghan2015; Perniss et al., Reference Perniss, Thompson and Vigliocco2010; Perniss & Vigliocco, Reference Perniss and Vigliocco2014 for reviews). But where do perceptions of iconicity come from? From the very earliest investigations of iconicity in language, there has been an assumption that perceptions of iconicity arise from formal correspondences. The presence of /i/ leads to the perception of smallness, /a/ to largeness (Sapir, Reference Sapir1929); sonorants are curved, obstruents are spiked (Köhler, Reference Köhler1929), and so on. The decoding of this ‘iconic language’ has been an appealing challenge, and the continuation of this line of work has proved fruitful; many more such iconic correspondences have now been uncovered.
Iconicity has been studied at the level of the linguistic system as a whole, by identifying skewed distributions of form-meaning mappings in lexicons, both within a single language (e.g., Monaghan et al., Reference Monaghan, Shillcock, Christiansen and Kirby2014; Winter & Perlman, Reference Winter and Perlman2021a; Hamano, Reference Hamano1998; Thompson & Do, Reference Thompson and Do2019), and across languages (e.g., Blasi et al., Reference Blasi, Wichmann, Hammarström, Stadler and Christiansen2016; Johansson et al., Reference Johansson, Anikin, Carling and Holmer2020; Joo, Reference Joo2020; Wichmann et al., Reference Wichmann, Holman and Brown2010; Winter et al., Reference Winter, Sóskuthy, Perlman and Dingemanse2022). It has also been studied on an individual level, in behavioural paradigms like iconicity rating tasks (e.g., Caselli et al., Reference Caselli, Sehyr, Cohen-Goldberg and Emmorey2017; Perry et al., Reference Perry, Perlman and Lupyan2015; Thompson et al., Reference Thompson, Akita and Do2020; Vinson et al., Reference Vinson, Cormier, Denmark, Schembri and Vigliocco2008) and guessing experiments (Brown et al., Reference Brown, Black and Horowitz1955; Dingemanse et al., Reference Dingemanse, Schuerman, Reinisch, Tufvesson and Mitterer2016; Köhler, Reference Köhler1929; Ramachandran & Hubbard, Reference Ramachandran and Hubbard2001; e.g., Sapir, Reference Sapir1929; Tsuru & Fries, Reference Tsuru and Fries1933). One advantage of studying individual construals of iconicity in behavioural tasks is that we can manipulate elements of these tasks to explore factors that shape construals of iconicity. Several studies have now uncovered discrepancies which emerge between different populations and tasks when investigating construals of iconicity, suggesting that this is more than a simple ‘decoding’ process. At the same time, it is becoming increasingly apparent that the associations language users tap into in interpreting iconicity do not stem from a single, universal iconic ‘language’, but rather from many iconic ‘languages’ that vary between individuals and evolve with experience.
As an illustration, Occhino et al. (Reference Occhino, Anible, Wilkinson and Morford2017) show that perceptions of iconicity are influenced by familiarity, with sign language users consistently rating signs from their own language as more iconic than signs from a foreign language. Construals of iconicity also have a developmental trajectory, as older children are better at recognising iconicity than younger children (Fernández-Prieto et al., Reference Fernández-Prieto, Navarra and Pons2015; Fort et al., Reference Fort, Lammertink, Peperkamp, Guevara-Rukoz, Fikkert and Tsuji2018; Magid & Pyers, Reference Magid and Pyers2017; e.g., Namy, Reference Namy2008; Tzeng et al., Reference Tzeng, Nygaard and Namy2017). Adult speakers of different languages exhibit differing sensitivities to specific form-meaning associations (Fordyce, Reference Fordyce1988; Iwasaki et al., Reference Iwasaki, David and Gabriella2007; Kwon, Reference Kwon2017; Shinohara & Kawahara, Reference Shinohara and Kawahara2010; Taylor & Taylor, Reference Taylor and Taylor1962). For example, Iwasaki et al. (Reference Iwasaki, David and Gabriella2007) asked both Japanese and English-speaking participants to rate Japanese ideophones for manners of walking along several semantic differential scales. They found that while Japanese speakers associated ideophones containing voiceless consonants with a lighter gait, and ideophones containing voiced consonants with a heavier gait, English speakers were only sensitive to the latter association. The authors conclude that the iconicity of at least some Japanese ideophones exhibits a degree of language specificity, meaning that it is something Japanese speakers learn through exposure to distributional patterns of sound-meaning pairings in their own lexicon, rather than a property that is immediately apparent from the sound of the word alone. Akita and Imai (Reference Akita and Imai2022) term this emergent iconicity.
Other studies vary aspects of task design to explore the role that external factors like context and framing play in shaping construals of iconicity. For example, two studies found that participants were better at guessing the meanings of foreign words when pronounced with an expressive intonation, compared to a flat intonation (Dingemanse et al., Reference Dingemanse, Schuerman, Reinisch, Tufvesson and Mitterer2016; Kunihira, Reference Kunihira1971). Similar work by Sevcikova Sehyr and Emmorey noted discrepancies in construals of iconicity between different tasks. They observed that while participants may rate a sign as highly iconic in a task where the meaning is provided, the same sign could be considered only weakly transparent in a guessing task (Sevcikova Sehyr & Emmorey, Reference Sevcikova Sehyr and Emmorey2019). Clearly, further work is needed to understand what it is that we really measure when we measure iconicity, and to learn how to untangle the contributions of form-meaning resemblances from other factors that influence perceptions of form-meaning fit (for more on this see e.g., Motamedi et al., Reference Motamedi, Little, Nielsen and Sulik2019; Winter & Perlman, Reference Winter and Perlman2021b).
The current study embraces this challenge. We collected iconicity measures for 304 Japanese words from monolingual English-speaking participants, in both an iconicity rating task and a series of guessing experiments, to better understand the role that factors external to form-meaning resemblances per se (e.g., native language, task design) play in shaping construals of iconicity. It is important to understand these factors, so that they can be taken into account when collecting measures of iconicity to use as explanatory variables in other analyses. In collecting these different measures, we made some variations particularly to the design of the guessing experiments to fine-tune the sensitivity of this task to detecting form-meaning resemblances specifically. While individual measures can be fine-tuned in this way to focus on specific factors, our experience of iconicity in the real world is multidimensional (e.g., Hodge & Ferrara, Reference Hodge and Ferrara2022), and for this reason, we believe that moving forward triangulating insights from multiple measures offers the greatest explanatory power when seeking to understand how iconicity affects various aspects of language. We illustrate this with the guessing and rating data by showing how when used together the two measures shed light on each other, and on the contribution of different factors to iconic effects.
As a final contribution, to make it easier for future studies to use these measures in tandem, we introduce a reproducible workflow for generating rating and guessing tasks from a single wordlist, with support for a variety of stimulus formats (audio, video, text, and images). This is available in an open source python package, icotools (https://pypi.org/project/icotools/), to make the collection of behavioural measures of iconicity quicker, easier, and more comparable between future studies.
2. Method
The materials used to produce the experiments, as well as the resulting data and analyses are available on the Open Science Framework, at https://osf.io/j57uc/.
2.1. Materials
The materials were 304 Japanese words taken from the Japonic Sensory Lexicon database (McLean, Reference McLean2022), which is a collection of words for 110 sensory concepts in 49 Japonic varieties. The words in the database were collated from three different sources: Hirayama (Reference Hirayama1992) and Sanada and Tomosada (Reference Sanada and Tomosada2015, Reference Sanada and Tomosada2018). Any available concepts related to the senses were included. For all three sources, words for each concept were collected from speakers of different Japonic varieties by asking the speakers to translate sentences from the standard variety into their local variety. The iconicity measures in this study were collected to enrich the data in the Japonic Sensory Lexicon, as a prior step in a broader investigation of this lexicon. Further information about the Japonic Sensory Lexicon can be found in the online Supplementary Material (https://osf.io/j57uc/).
The words come from the native stratum of the Japanese lexicon, which can be further divided into two substrata: the prosaic and the ideophonic (also called the mimetic) stratum (see e.g., Kageyama & Kishimoto, Reference Kageyama and Kishimoto2016). The ideophonic stratum is defined on the basis of its distinctive morphophonological properties, as well as its use of sound symbolism (Akita, Reference Akita2008, Reference Akita, Iwasaki, Sells and Akita2017). Words belonging to the ideophonic stratum are generally considered to be iconic (Akita, Reference Akita2008; Thompson et al., Reference Thompson, Akita and Do2020), and typically depict sensory experiences (Akita, Reference Akita, Iwasaki, Sells and Akita2017). The term ‘prosaic’ is used in this study to distinguish other native words belonging to the sensory lexicon of Japonic from ideophones. Frequently, a similar concept can be expressed either by a prosaic word or by an ideophone. For example, something that is soft could be described in Standard Japanese as jawarakai, to use a prosaic word, or fuwafuwa, to use an ideophone. This lexical stratification predates the diversification of the Japonic languages from Proto-Japonic, and is found in all the modern Japonic varieties used in this study. While ideophones are felt to be iconic to Japanese speakers, we wanted to test if this would also be true for our English-speaking participants.
In all the experiments, the Japanese words were presented to participants as audio files. This was to guard against any interference from orthography. For example, to avoid participants interpreting the phonetic values of the transliterations of Japanese characters incorrectly. The audio files were synthesised using the Google Cloud Text-to-Speech API (https://cloud.google.com/text-to-speech), with the female Japanese Wavenet voice ja-JP-Wavenet-B. They were then edited using Praat (Boersma & Weenink, Reference Boersma and Weenink2020) to have a flat pitch of 200 Hz. Since expressive prosody can enhance performance in guessing tasks (Dingemanse et al., Reference Dingemanse, Schuerman, Reinisch, Tufvesson and Mitterer2016; Kunihira, Reference Kunihira1971), standardising the intonation in the recordings ensured comparisons between the words were fair and not influenced by the prosody in a particular recording. We also considered editing the words to have a marked intonation, but it was difficult to do this in a comparable way for words of different lengths. While flat, synthetic voices may be the best option for comparability, a consequence of this methodological decision is that our results almost certainly underestimate the iconicity of these words in natural settings, which involve not only speech segments but also prosody and accompanying multimodal cues (e.g., gesture, facial expressions).
2.2. Participants
A total of 689 monolingual English speakers were recruited through the crowd-sourcing service Prolific (www.prolific.co), and received £0.75 for their participation in the study (based on Prolific’s ‘good’ hourly rate of £7.50). All participants confirmed that they had no prior knowledge of Japanese. Although iconicity rating tasks are usually conducted with native speakers, we used English speakers for the rating task as well as the guessing experiments so that we could assess the agreement between these two different measures of iconicity when collected from the same population. Using non-speakers was also important as our data contained a mix of Standard Japanese and non-standard Japanese words (see Section 2.1), and we were concerned that using only Standard Japanese speakers would bias the Standard Japanese words (Occhino et al., Reference Occhino, Anible, Wilkinson and Morford2017).
2.3. Procedure
The study was conducted online via Prolific (Peer et al., Reference Peer, Rothschild, Gordon, Evernden and Damer2022). Each participant completed either a rating task, or a guessing experiment, and Prolific’s pre-screening features were used to prevent the same participant from completing multiple studies. To avoid fatigue effects, the words were divided between participants so that each only had to rate or guess around 34 words, which took a median of 6 minutes per participant. The words were divided in a way that ensured there was a balance of ideophones and prosaic words among the wordlists for each participant. In addition, two ‘practice words’ and three ‘control words’ were included in every wordlist. The practice items were included to give participants time to familiarise themselves with the experimental design, and responses to the practise items were not included in the results. The control items were chosen from words found to be highly iconic/easily guessable in previous studies, and were included as a check to identify participants who were perhaps not performing the task as intended. The first two items in every wordlist were the practice items, while the order of the rest of the items in the list, including the control items, was randomly varied between participants. After completing the wordlist, participants were asked to describe the task they were performing. This was used as an attention check, and to identify participants who had misunderstood task instructions. Strange or lacking task descriptions, particularly when coupled with poor performance on the control items, were used to identify and exclude results from participants who were likely not performing the task as intended. For the rating study, we also calculated the person-total correlation for each participant as an additional quality check, to identify participants whose response patterns differed from those of other participants with the same wordlist (following Curran, Reference Curran2016). Based on these criteria, data from 11 out of 689 participants was excluded across the different studies. Further information on these exclusions is provided in the online Supplementary Material.
Excluding the practice and control items (which every participant saw), the final dataset for the pilot guessing experiment included a median of 40 guesses per word (range: 15–129); in the second-guessing experiment there was a median of 30 guesses per word (range: 29–60); and in the rating task, there was a median of 15 ratings per word (range: 14–58). Motamedi et al. (Reference Motamedi, Little, Nielsen and Sulik2019) suggest a benchmark of 10 ratings per word is sufficient.
Since the words were presented as audio files, participants were instructed to use headphones in every study, and could not proceed to the main task without first completing a listening test designed to require the use of headphones (Woods et al., Reference Woods, Siegel, Traer and McDermott2017). The response buttons for each trial did not appear until after the audio files had finished playing, ensuring that participants could not respond without first listening to the audio files. For every trial, the time (in milliseconds) participants took to select a response for the trial (after the response buttons appeared on the screen) was recorded.
The remainder of this section outlines the design of the three studies themselves, which included: (1) a pilot study of guessing experiments following previous work (Dingemanse et al., Reference Dingemanse, Schuerman, Reinisch, Tufvesson and Mitterer2016), (2) a series of improved guessing experiments addressing complications encountered with (1), and (3) a rating task. We compare the measures of iconicity collected in these studies for their robustness to different experimental choices, their sensitivity to iconicity, and their ability to distinguish between different levels of iconicity in Section 3.
2.3.1. Pilot guessing experiments: word to meaning design
Following previous studies (e.g., Dingemanse et al., Reference Dingemanse, Schuerman, Reinisch, Tufvesson and Mitterer2016), we piloted guessing experiments in which participants were presented with a Japanese word and asked to guess its meaning from a choice of two possible translations. Some of the ideophones in the data had very specific meanings, which were difficult to capture in a single English word. To provide more context, the translations were presented in sentence frames, with the translation word in capitals. The instructions were as follows:
We are interested in how well people can guess the meanings of words in foreign languages. In this experiment, we are interested in your intuitions about the meanings of JAPANESE words. You will hear 25 Japanese words. After listening to each word, try to guess its meaning from a choice of two possible English translations. For context, meanings are given in a sentence, with the intended meaning in CAPITALS. For example, if you think the word could mean BRIGHT in the sentence ‘The sun is BRIGHT’, choose that sentence. If you think it could mean ROUND in the sentence, ‘The sun is ROUND’, choose that sentence. Trust your gut, and good luck!
A sample trial is shown in Fig. 1.

Figure 1. Guessing task, word to meaning design.
The same formulaic structure, ‘After X, Y’, was used for all the sentences – where Y is the target perception, and X is the event that causes it. As some sensory modalities (e.g., sound) may better lend themselves to the construal of iconicity than others (e.g., taste) (Little et al., Reference Little, Sulik, Cuskley, Flaherty, McCrohon, Ravignani and Verhoef2018; Perlman et al., Reference Perlman, Little, Thompson and Thompson2018), correct translations were always paired with foil translations from the same modality (e.g., sound translations were only paired with other sound translations, taste translations with other taste translations, etc.). This ensured that one translation was not more likely to be chosen over another simply because it belonged to a domain typically high in iconicity (Motamedi et al., Reference Motamedi, Little, Nielsen and Sulik2019). Following Dingemanse et al. (Reference Dingemanse, Schuerman, Reinisch, Tufvesson and Mitterer2016), only words that were neither synonyms nor antonyms of the correct translation were used as foil translations. For example, in the sample trial shown in Fig. 1, the correct translation ‘SCRATCHY’ is paired with the foil translation ‘CRAMPING’. It would not be paired with a synonymous foil, like ‘ITCHY’, nor with an antonymic foil, like ‘SMOOTH’. Since not all the meanings in the dataset have clear antonyms (a meaning like CRAMPING is one example), this made the difficulty of the task comparable between different trials. Finally, the length of the sentences was also kept consistent (to a difference of no more than five characters) between pairings of translations and foils.
To test the robustness of the guessing procedure to different choices of translations and foil translations, the same words were tested multiple times with two to three different correct and foil translations (see also Perlman & Lupyan, Reference Perlman and Lupyan2018). We were concerned that participants could choose English translations based on how they sound (particularly if they sounded similar to the Japanese target word), rather than based on their meanings as we intended. To minimise any potential effects from this, as much as possible phonologically distinct synonyms were used as alternative translations (e.g., SMALL|TINY, BIG|LARGE).
Pilot results from these guessing experiments showed that the guessability of the words varied considerably depending on the particular combination of translations and foils used (see Section 3.1). We hypothesised that, as well as considering the meaning of the English translations and foils, participants may have been driven to choose one option over another because of its phonetic similarity to the target word; lexical features of the word like its frequency, valence, or arousal; or other semantic associations they may have had with the word. To address this, we developed a new guessing paradigm (described in Section 2.3.2) that did not require participants to compare different English translations.
2.3.2. Guessing experiments: meaning to word design
In our novel guessing paradigm, the forced-choice aspect of the task was between Japanese words rather than English translations. Participants were given a meaning (in English), and two potential Japanese words for that meaning, then asked to guess which word matched the meaning. By making the forced choice between two Japanese words that the participants did not have any experience with, rather than between two familiar English words, we hoped to reduce interference from factors other than iconicity that could influence participants’ forced choice. The instructions for the task were as follows:
We are interested in how well people can guess words in foreign languages. In this experiment, you will be asked to match the English translation with the corresponding word in JAPANESE, guessing from a choice of two Japanese words.
Since conflicting results in the pilot study seemed to primarily stem from the use of English, this time, rather than using sentence frames for context, we kept the amount of English to a minimum by using only single-word translations as much as possible. Where more context was needed, this was provided in brackets. A sample trial is shown in Fig. 2.
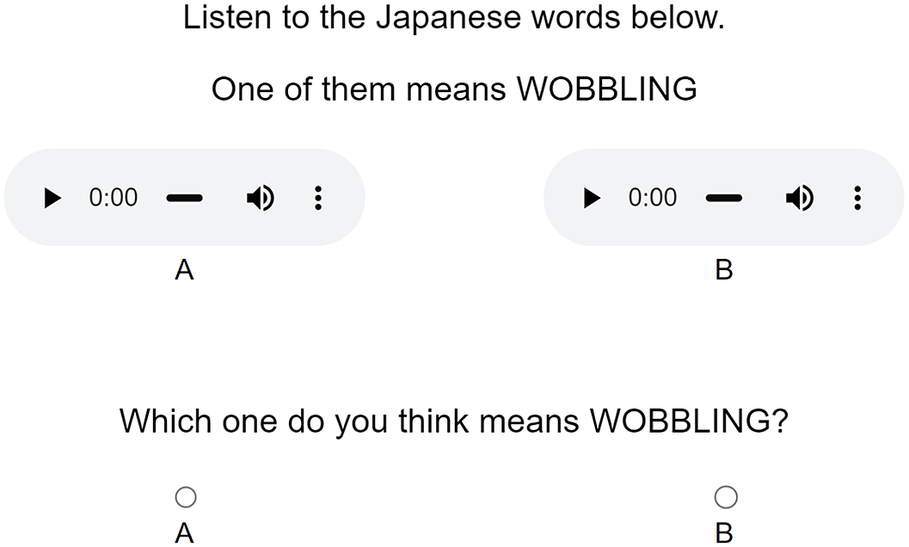
Figure 2. Guessing task, meaning to word design.
The incorrect ‘foil’ word in each trial was a nonsense Japanese word artificially generated to be as phonologically distinct as possible from the correct word, while still conforming to Japanese phonotactics. For every word, three different foil words were generated by substituting each consonant with its top three most phonologically distant consonants in the Japanese sound system. Phonological distances were calculated using the feature matrix provided in PHOIBLE (Moran & McCloy, Reference Moran and McCloy2019), with the distance between two sounds equal to the sum of the distances between each of their feature values. Distances were calculated as follows:
The distance between two feature values that are identical is 0. The distance between two opposing values (+/− or −/+) is 1 – except if the feature involved is length or voicing, then the distance is 0.5. The distance between two feature values when one of them is 0 (= not applicable) is 0.25.
Since /a/ is the most phonologically distant vowel from most of the vowels in Japanese, to avoid the foil words all having the same vowel, a different approach was used for substituting vowels. Instead of using feature values, vowels were substituted with the vowel obtained by rotating the vowels at the endpoints of the vowel space triangle 120 degrees clockwise or counterclockwise, and flipping the vowels in the middle. So /u/ is substituted with either /a/ or /i/, /a/ is substituted with either /i/ or /u/, /i/ is substituted with either /a/ or /u/, and /e/ and /o/ are substituted with each other (see Fig. 3). Finally, reduplicated words were ‘unreduplicated’ when creating foils. For example, the foils for fuwafuwa were niti, witʃi and ratsːu (not nitiniti, witʃiwitʃi, and ratsːuratsːu).

Figure 3. Vowel substitutions for the creation of foil words. Vowels were substituted with the vowel obtained by rotating the vowels at the endpoints of the vowel space triangle 120 degrees clockwise or counterclockwise, and flipping the vowels in the middle. So /u/ is substituted with either /a/ or /i/, /a/ is substituted with either /i/ or /u/, /i/ is substituted with either /a/ or /u/, and /e/ and /o/ are substituted with each other.
By using foil words that sound as different as possible to the target word, we hoped to improve the sensitivity of the guessing task to iconicity in the target word. Our logic was that if the target word is iconic for a concept, then a word that sounds very different to the target word should be a bad fit for that same concept – making the choice between the two easier. To test whether this was really the case, we ran one of the experiments a second time using foils that were randomly chosen from among the other words in the experiment, rather than phonologically distinct foils. This allowed us to assess whether using phonologically distinct foils led to more words being guessed correctly.
As with the previous guessing experiments, the translations and foils used in each trial were randomly varied between participants to assess the robustness of the results to the particular foil or translation chosen.
2.3.3. Rating task
We also conducted an iconicity rating task with the same words. In the rating task, the concept of iconicity was defined to participants as ‘when a word and its meaning resemble one another’, using the English examples wiggle, jiggle and wriggle. The instructions stated that ‘Even people who do not speak any English can get a sense of the meaning of these words’, and contrasted them with words like walk and run whose meanings are ‘not so intuitive’. The full instructions given were as follows:
Some words seem to ‘fit’ their meanings. For example, consider the English words wiggle, jiggle and wriggle.
We have an intuitive sense of the meanings of these words, because there is a resemblance between the words and their meanings.
Even people who do not speak any English can get a sense of the meaning of these words.
Words like walk and run on the other hand are not so intuitive; people who do not know any English would not be able to guess what these words mean.
In this task, you will listen to some Japanese words, and we will tell you their meanings.
You will then be asked to judge whether there is a resemblance between the word and its meaning.
Participants were instructed to listen to the Japanese words and were told their meanings. They then had to rate the resemblance between the word and its meaning on a scale from 0 ‘No resemblance’ to 6 ‘Strong resemblance’ (see Fig. 4). Earlier studies also included a negative end of the scale, corresponding to a ‘bad resemblance’. However, a meta-analysis found that the negative end of the scale was both underused and inconsistently used, suggesting that anti-iconic relationships are difficult to assess (Motamedi et al., Reference Motamedi, Little, Nielsen and Sulik2019). For this reason, we used only a positive scale in this study. As with the guessing studies, the translation shown for each participant was varied randomly between a set of (wherever possible) phonologically distinct synonyms.

Figure 4. Iconicity rating task.
3. Results
Statistical analyses were conducted using R version 4.2.1 (R Core Team, 2022).
3.1. Robustness to different choices of translations and foils
We first investigated whether the results from the rating and guessing studies were robust to different choices of translations (for both tasks) and foils (for the guessing tasks only). For each word separately, we performed Fisher’s Exact Tests on the guessing results, and ANOVAs on the rating results, to determine whether there were significant differences in guessing accuracy or ratings given depending on the translation or foil word shown. As the ANOVAs are less robust to sparse data than the Fisher’s Exact Tests, for the analysis of the rating data we excluded translations with fewer than 10 ratings.
In the pilot version of the guessing task – where participants were guessing between English translations – the guessability of 11 out of the 45 words tested (=24%) differed significantly depending on the translation and/or foil word chosen. By modifying the guessing task so that participants guessed between Japanese words rather than English translations, we were able to reduce this proportion to 37 out of 301 words tested (=12%). This was comparable to the variation found in the rating task when using different translations, which affected 11 out of 88 words tested (=13%). We looked into each of these cases individually, but could not find a consistent explanation for the differing distributions of guesses and ratings. For the English translations, frequency and arousal sometimes seemed to influence how often a particular translation was chosen, or how highly the word-translation pairing was rated (in that more frequent, high-arousal English words seemed to be chosen more often and given higher iconicity ratings). Resemblances between the sound of the translation words and the sound of the Japanese words also sometimes seemed to play a role. However, we were unable to determine which of these factors would be most relevant in any one case, nor how they would interact.
3.2. Sensitivity and discriminability
To test whether using phonologically distinct foils in the guessing experiments improved the sensitivity of the task to iconicity, a subset of 30 words was tested twice – once with phonologically distinct ‘opposite’ foils, and once with random foils. The number of these words which were guessed at rates significantly higher than chance (using an exact binomial test, with a sample of 30 guesses per word an accuracy greater than or equal to 2/3 is needed to be 95% confident the true accuracy is above chance) was greater when using opposite foils than when using randomly selected foils. Using opposite foils, just over half of the words in the sample (16/30) were guessed at rates significantly higher than chance, whereas with the random foils this number fell to just 1 in 3 words (10/30). Only two words were guessed significantly higher than chance in the random foil condition, but not in the opposite foil condition. However, both were guessed numerically above chance in the opposite foil condition as well (with accuracies of 52 and 57%). Fig. 5 compares the distribution of guessing accuracies between the two conditions. When using random foils, most of the distribution is centred around chance. When using opposite foils, however, the guesses are more evenly dispersed across the full range of accuracies. Critically, the portion of the distribution that is above chance is larger in the opposite foil condition compared to the random foil condition.

Figure 5. Guessing accuracies when using opposite versus random foils. The dotted line indicates the 95% confidence interval for accuracies greater than chance.
We also compared the distribution of measures (guessing accuracies and iconicity ratings) between the different tasks. Since the iconicity ratings in this study were collected from participants who did not speak any Japanese, whereas rating studies more commonly use native-speaker participants, we added one more plot to the figure showing the distribution of iconicity ratings in a separate study by Thompson et al. (Reference Thompson, Akita and Do2020). Thompson et al. collected iconicity ratings for Japanese words from native Japanese-speaking participants. Their dataset contained a wider variety of words than the current dataset, and they also used a different rating scale. Their scale started at -5 for ‘anti-iconic’ words, and ended at 5 for ‘iconic’ words, with 0 indicating arbitrariness. The scale in the current study started at 0 (also corresponding to an ‘arbitrary’ category, in which there is ‘no resemblance between the word and its meaning’), and ended at 6 for a ‘strong resemblance between the word and its meaning’. To make the data more comparable between the two studies, and since a meta-analysis found negative ratings unreliable (Motamedi et al., Reference Motamedi, Little, Nielsen and Sulik2019), we have filtered the data from Thompson et al. to only contain responses using the part of the scale between 0 and 5. Also, since the Thompson et al. study included loanwords, whereas the current study contained only native words, to improve comparability between the studies we have also filtered the Thompson et al. data to remove non-native words. Finally, ratings from both studies were transformed so that they varied between 0 and 1, allowing them to be compared with the guessing accuracies. The resulting distributions are shown in Fig. 6.

Figure 6. Discriminability of iconicity measures from different tasks. Iconicity ratings have been transformed so that they vary between 0 and 1 (to compare with guessing accuracies).
Focusing first on the data from the current study, we can see that the guesses provide a more even spread of measures compared to the ratings. Between the two guessing methods, the method of guessing between words provides a wider spread of measures than guessing between translations – both at the very high end of the scale (highly guessable words) and at the very low end of the scale (poorly guessable words). If we look at the ratings from native Japanese speakers, however, we can see that these are dispersed similarly to the guesses between words from the current study. Their distribution is slightly narrower at the very top end of the scale. However, the words in the current study were taken from a portion of the vocabulary (the sensory lexicon) predicted to be high in iconicity (see e.g., Winter et al., Reference Winter, Perlman, Perry and Lupyan2017), whereas the data from Thompson et al. was more varied, with proportionally fewer ideophones. So this could simply be a reflection of underlying differences between the two datasets, rather than a reflection of the sensitivity of the measures used.
3.3. Agreement
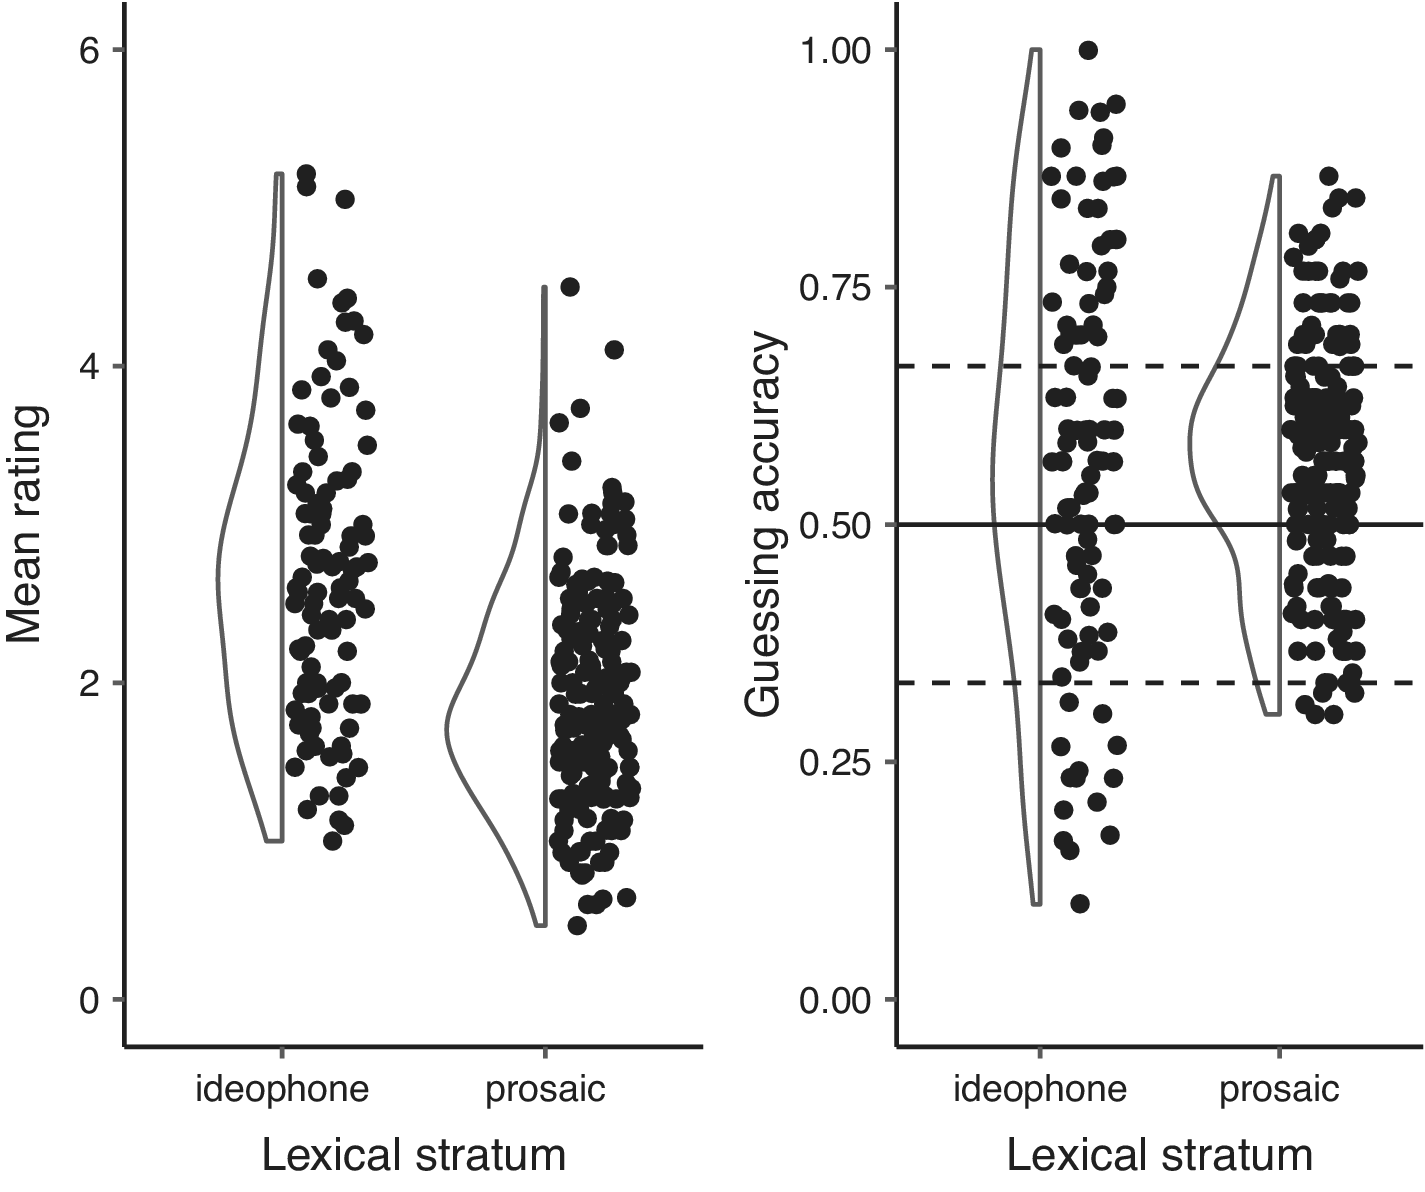
Fig. 7 compares the guessing accuracies and mean iconicity ratings for ideophones and prosaic words. For the guessing accuracies, the solid line represents chance while the dotted lines above and below indicate the 95% confidence interval for accuracies greater than or lesser than chance respectively. The pilot guessing study where participants guessed between translations contained different words to those used in the subsequent guessing and rating studies, so here only the results from the later guessing study (where participants guessed between words) are shown. At the top end of the scale, the two measures agree – ideophones score higher than prosaic words for both ratings and guesses. However, while the bottom end of the scale is dominated by prosaic words in the ratings, in the guessing results we again find ideophones at the extremities. That is, ideophones were guessed both better and worse than prosaic words. Also, while both ideophones and prosaic words were guessed at above-chance accuracies, the portion of the graph corresponding to below-chance accuracies is dominated by ideophones. We will return to this in the discussion.

Figure 7. Comparison of iconicity ratings and guessing accuracies, for ideophones and prosaic words. For the guessing accuracies, the solid line indicates chance while the dotted lines above and below indicate the 95% confidence interval for accuracies greater or lesser than chance, respectively.
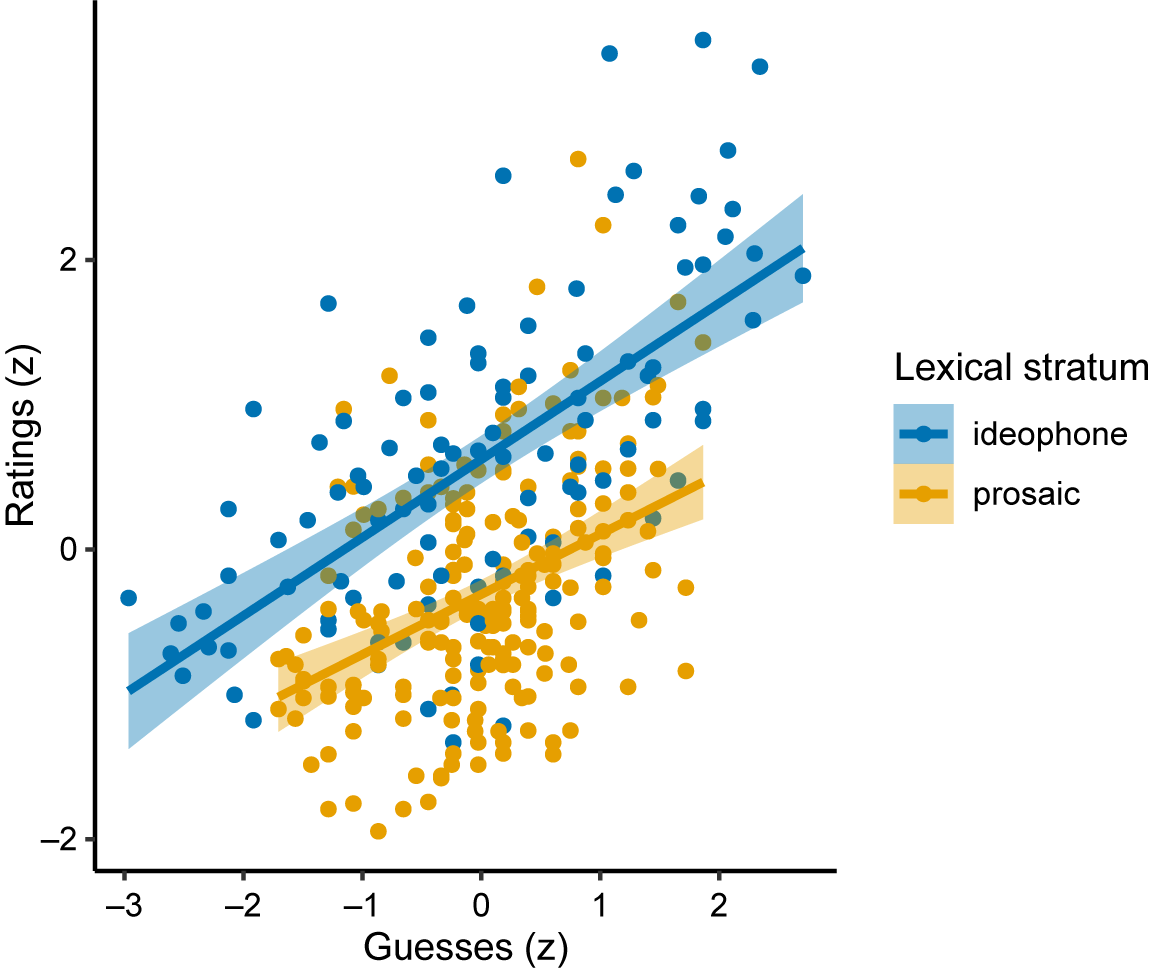
To assess how well the measures agree on the iconicity of individual words, iconicity ratings and guessability scores for the same words were transformed to z-scores so that they could be directly compared. Fig. 8 plots the z-scores for each measure against each other, to show the agreement between them. In the figure, ideophones are represented by blue points and prosaic words by orange points.

Figure 8. Agreement between guesses and ratings. Ideophones are represented by blue points, and prosaic words by orange points. Values are z-scores.
For both ideophones and prosaic words, iconicity ratings and guessing accuracies were strongly correlated. This correspondence was slightly better for ideophones (r = 0.66, 95% CI [0.44, 0.79], 95% CI [0.53, 0.76], t(99) = 8.68, p < 0.001) compared to prosaic words (r = 0.41, 95% CI [0.29, 0.52], t(201) = 6.45, p < 0.001). To explore this relationship further, we created two linear regression models: one predicting ratings from guesses, lexical stratum, and the interaction between these two factors; and a second model predicting guesses from ratings, lexical stratum, and the interaction between these two factors. Again, both models used z-scores rather than raw ratings and guesses. The models were created using the R package lmerTest (version 3.1.3) (Kuznetsova et al., Reference Kuznetsova, Brockhoff and Christensen2017). The output of the first model (predicting ratings from guesses) is shown in Table 1.
Table 1. Linear regression model predicting ratings from guesses, lexical stratum, and the interaction between these two factors.

The model shows that guessing accuracies predict iconicity ratings, in that the better guessed a word was, the higher its iconicity rating. There was also an effect of lexical stratum, such that prosaic words were predicted to receive lower iconicity ratings than ideophones with the same guessing accuracies. There was no significant interaction between these two factors. This is shown in Fig. 9. The lines for ideophones and prosaic words are parallel, indicating that differences in guesses correspond to differences in ratings in the same way for both ideophones and prosaic words. However, the line for the ideophones is directly above the line for prosaic words, indicating that ideophones are rated higher in iconicity than prosaic words – even when guessed at the same accuracies.

Figure 9. Relationship between lexical stratum, guessability, and predicted rating. The line for ideophones is shown in blue, and for prosaic words in orange.
Table 2 shows the output of the second model, in which we predicted guessing accuracies from iconicity ratings. The model confirmed that the relationship between guesses and ratings works both ways, with higher iconicity ratings also predicting higher guessing accuracies. However, the relationship between ratings, guesses, and lexical stratum was more complex than in the first model, as here we found an interaction effect in addition to the main effects. These effects are easiest to interpret by plotting the interaction, shown in Fig. 10.
Table 2. Linear regression model predicting guesses from ratings, lexical stratum, and the interaction between these two factors.


Figure 10. Interaction between ratings and lexical stratum when predicting guesses. The line for ideophones is shown in blue, and for prosaic words in orange.
The plot shows that both ideophones and prosaic words that received high iconicity ratings were also guessed well. For well-guessed items, there was no significant difference between the ideophones and the prosaic words, as shown by the lines overlapping. However, among the poorly guessed items, ideophones were guessed comparatively worse than prosaic words with the same iconicity ratings. We will return to this in the discussion.
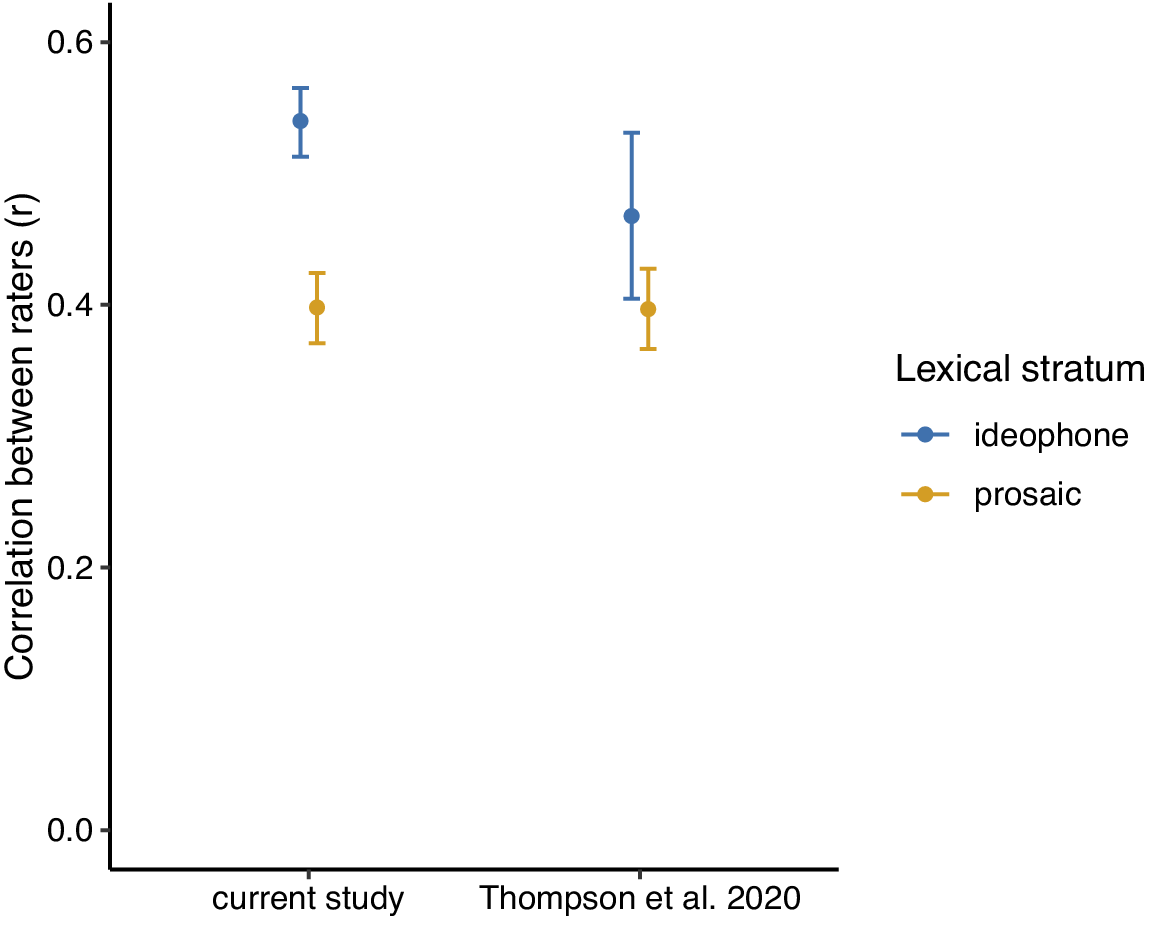
Finally, the lower correlation between guesses and ratings obtained for prosaic words compared to ideophones suggests that participants may not have been as consistent or reliable when rating prosaic words compared to when rating ideophones. To further investigate this, we calculated person-total correlations (Curran, Reference Curran2016) for the rating data using bootstrapping (5000 iterations; following Motamedi et al., Reference Motamedi, Little, Nielsen and Sulik2019), for ideophones and prosaic words separately. Fig. 11 shows the agreement between raters (expressed as the correlation between each individual rating, and the by-item average) for ideophones and prosaic words respectively. The points indicate the mean while the lines indicate 95% confidence intervals. Again, since these ratings were from non-Japanese speakers, we added data from Japanese speakers from Thompson et al. (Reference Thompson, Akita and Do2020) as a comparison.

Figure 11. Consistency of iconicity ratings given for ideophones versus prosaic words, for non-speakers (current study) and native speakers (Thompson et al. Reference Dingemanse and Thompson2020). Points represent the mean correlation while the lines indicate the 95% confidence interval for the mean. Ideophones are shown in blue, and prosaic words in orange.
In both studies, participants were more consistent with each other when rating ideophones than when rating prosaic words, though for the data from Thompson et al. (Reference Dingemanse and Thompson2020) the overlap of the confidence intervals indicates that the difference was not significant. There was no difference in the consistency of ratings between the English and the Japanese speakers, as shown by the overlap between the ideophone and prosaic lines for each group of raters.
4. Discussion
4.1. Relationship between ratings, guesses, ideophones and iconicity
The strong positive correlation between the ratings and guesses, both for ideophones and for prosaic words, confirms that these two measures tap into overlapping constructs, which we suggest are form-meaning association biases. However, ideophones were consistently rated higher in iconicity than prosaic words – even when guessed at the same accuracies (Fig. 8). We believe this is due to the majority of ideophones in the dataset being reduplicated. The two lowest-rated ideophones – sappari ‘clean’ and guttari ‘exhausted’ – were among the few in the data that do not use a reduplicated template. Reduplication is common in onomatopoeic words in English and is also a feature of child-directed speech (Ferguson, Reference Ferguson1978), in which iconicity plays a prominent role (Perry et al., Reference Perry, Perlman, Winter, Massaro and Lupyan2018). We suggest that because of these associations, the use of reduplication in the ideophones enhanced their perceived iconicity to English-speaking participants, above and beyond the influence of form-meaning resemblances themselves. This is in line with previous work showing a relationship between iconicity ratings and structural markedness (Dingemanse & Thompson, Reference Dingemanse and Thompson2020). The result is especially clear when we compare the ratings with the guessing accuracies, particularly for poorly-rated ideophones, which were guessed comparatively worse than prosaic words with the same ratings (Fig. 10). While in the rating task looking like an iconic word was enough to inflate ratings for ideophones, this did not help participants to correctly guess their meanings in the guessing task. For this, only form-meaning resemblances themselves were helpful.
However, ideophones were still differentiated from prosaic words in the guessing results in other ways. The most noticeable difference between the two-word groups was that while both were alternatively guessed at or above chance, of the words guessed at levels significantly below chance almost all were ideophones (Fig. 7). Perhaps because participants were more likely to view form-meaning relationships in ideophones as meaningful (since they look like iconic words), they attached more weight to perceived conflicts between a form and its given meaning for this word group, resulting in a stronger pull away from the correct form (Dingemanse, Reference Dingemanse and Akita2019: 19; for more on this see discussion in Webster, Reference Webster2017). This is supported by the larger person-total correlations reported for ideophones compared to prosaic words in Section 3.3; that participants were more consistent with each other when rating ideophones suggests that their intuitions about form-meaning relations for these words were stronger.
So, although the structural markedness of the ideophones did not help participants to decode their meanings, it did serve them in other ways. It led them to focus on the forms of the ideophones and to view them as meaningful, which in turn meant their iconic intuitions about these words were stronger (even if they did not always align with the association in Japanese). As a first step in detecting iconic correspondences, this process (known as depiction marking; see for discussion Akita, Reference Akita2021; Clark, Reference Clark2016; Dingemanse and Akita, Reference Dingemanse and Akita2017) is frequently overlooked, but here we see how important it can be, as without that step participants greatly underestimated form-meaning resemblances in prosaic words. This is reflected in the finding that prosaic words were guessed just as well as ideophones, even though they received lower iconicity ratings. When forced to make a decision, participants must have used form-meaning resemblances in the prosaic words to inform their guesses, but they did not recognise these resemblances when rating the same words.
The result of some ideophones being very poorly guessed highlights another overlooked aspect of iconicity, which is that construals of iconicity emerge from individual experience. How is it that an ideophone which to a Japanese speaker so perfectly resembles its meaning, can to an English speaker resemble the very opposite meaning? The finding highlights the role that systematic patterns in the lexicon play in establishing form-meaning associations (Akita & Imai, Reference Akita and Imai2022; Occhino et al., Reference Occhino, Anible, Wilkinson and Morford2017, Reference Occhino, Anible and Morford2020). English speakers without any knowledge of the Japanese lexicon may not pick up on associations which to Japanese speakers feel very natural, because unlike Japanese speakers they have not seen these patterns thousands of times in their own lexicons.
Alternatively, poor guessing accuracies and low iconicity ratings for some ideophones could be explained by conflicting associations English speakers have with these forms, which might not have anything to do with resemblance, but which can still influence perceptions of form-meaning fit. As an example, one person commented that zarazara as a word for ‘rough’ sounds wrong to them because they associate the form zara with the clothing store ZARA, and clothes are soft. Fortunately, the chances of English speakers having the same associations as Japanese speakers with these forms through something not inherent to the forms themselves are much smaller than the chances of them having a different association, so the highly-rated, well-guessed Japanese words likely do reflect form-meaning resemblances more than anything else. However, the poorly guessed, poorly rated ideophones in particular highlight that experience also plays a role in shaping construals of iconicity.
4.2. Towards a synthesis of measures
The above comparisons shed light on the variety of processes involved in meaning-making through iconicity, processes which do not take place in a vacuum but which interact with different linguistic and cultural environments. To capture these processes, and tease them apart in analyses, a synthesis of different measures focused on different aspects of iconicity offers more than single-shot approaches. For example, iconicity ratings from native speakers can tell us which mappings are meaningful to them, while comparisons with guessability for non-speakersallows us to establish the relative contribution of (specific linguistic and cultural) experiences to the meaningfulness of these mappings. This study used a single population of guessers, but particularly for the poorly guessed items, a second or third group of guessers from a different population would be helpful to ascertain whether specific items were poorly guessed because their forms were not inherently meaningful, or whether conflicting associations among the guessers led to poor guessing accuracies. In the latter case, a different group of guessers with different experiences may not have had the same trouble with these items.
Since ratings are more sensitive than guesses to the presentation of a word as iconic through cues like structural markedness, comparing the predictive strength of the two measures could allow researchers to investigate the degree to which processes like framing or staging are involved in iconic effects, or whether the presence of form-meaning resemblances alone is enough. Having guesses alongside ratings also makes the ratings themselves more interpretable. For instance, the raters in this study rated all the words as ‘slightly’ iconic, even though the guessing results revealed many could not match the word to its meaning at rates any better than chance. This is likely an artefact of the scale used in the rating task, where a lack of iconicity is represented by just one of the seven points, with the other six all indicating varying degrees of form-meaning resemblance. Correlating ratings with guessing accuracies offers a principled way to determine what constitutes a ‘low’ or ‘high’ rating, as opposed to, for example, arbitrarily dividing the scale at the half-way point, or using percentiles tied to particular datasets.
4.3. Methodological contributions
Finally, we introduced and tested some modifications to the design of the guessing and rating tasks to improve their robustness to different choices of translations and foils, and to fine-tune the sensitivity of the guessing task to detecting form-meaning resemblances. We found that participants were sometimes better at guessing the meaning of a Japanese word when it was paired with a particular English translation over other possible translations, or when it was paired with particular foils. Iconicity ratings were similarly affected. For example, the ideophone pyonpyon was guessed more accurately and rated higher in iconicity when translated as ‘bouncing’ rather than ‘hopping’. These patterns appeared to be driven by multiple opaque factors that would be difficult to control for, especially at large scales. To address this, we used multiple alternative translations for the Japanese words in this study, showing different translations to different participants. Where results are consistent across the different translations, we can assume the effect is driven by the semantic content that the translations share, rather than by extraneous features (e.g., frequency and arousal) that could differ between the translations. In the rating task, we found roughly 90% of the ratings were robust to the choice of translation in this way. However, using traditional guessing paradigms in which participants are presented with a word and must choose its translation (a word-to-meaning design) this number fell to roughly 75%. We attributed this drop in robustness to the addition of more English translations in the guessing task, which heightens the influence of extraneous factors by introducing interactions between the two alternative translations. To counter this, we developed a new guessing paradigm in which participants are presented with a single English translation and asked to choose a Japanese word to match it to – a meaning-to-word design more comparable to that of the rating task. We found that this new paradigm increased the robustness of the guessing measures to roughly 90% – on par with the ratings.
As foil words for this new guessing paradigm, we could have used the other Japanese words in the study, and randomly varied them between trials. However, because iconicity in spoken language is fairly subtle, we developed a different approach which we hoped would increase the sensitivity of the measure to detecting form-meaning resemblances specifically. Rather than using real words as foils, we used artificial words constructed to be maximally phonologically distinct from the Japanese words being tested. Our hypothesis was that if the real word is a good fit for the meaning, then a word that sounds very different to it should be a bad fit for the same meaning. So using phonologically distinct foils should enhance the task’s sensitivity to iconicity. We confirmed this by retesting a subset of the words with randomly chosen foils, and comparing the results with those obtained using phonologically distinct foils. As expected, using phonologically distinct foils increased the number of items guessed above chance (Section 3.2).
We were also interested in the discriminability of the different measures. That is, how well they distinguished between greater and lesser amounts of iconicity. We found that between the two tasks, the guessing accuracies provided a wider spread of measures than the ratings. The forced-choice nature of the guessing task meant participants had to act on even their weakest intuitions, intuitions they may not have felt confident to express in the rating task. A lack of confidence in rating foreign words is understandable, so we compared the ratings in this study with ratings for Japanese words taken from native speakers in another study (Thompson et al., Reference Thompson, Akita and Do2020). We found that native speakers were more confident in giving high or low ratings, with the distribution of native speaker ratings providing a comparable spread of measures to the guesses. However, we did not find any difference in the consistency of the ratings provided between the two groups – non-speakers were just as consistent as native speakers in rating the iconicity of Japanese words. This supports the use of non-speaker ratings in situations where native speaker ratings would be problematic (as in the current study; see discussion in Section 2.2), or where measures from an inexperienced population are theoretically desirable (for e.g., for use in modeling language aquistion). Ratings can always be supplemented with guesses where more power is needed, and our new guessing paradigm helps with this too. We found the meaning-to-word design used in this study increased the range of guessing accuracies, with more words guessed at high (and low) accuracy levels, and fewer words guessed at chance. This is probably because in the word-to-meaning design, to make the difficulty comparable between trials, we had to restrict the foils to words from the same sensory modality, which were neither synonyms nor antonyms of the correct translation (Section 2.3.1). The meaning-to-word design eliminated this issue, making it easier for participants to choose between the two options, and resulting in a more discriminating measure.
Having developed these methods for more robust, sensitive, and discriminating measures of iconicity, we packaged them in icotools (https://pypi.org/project/icotools/), so that other researchers can benefit from them. Icotools can be used to automatically generate guessing and rating tasks from standardised wordlists, following the designs in Sections 2.3.2 and 2.3.3. A full discussion of icotools and its functionality is provided in the online Supplementary Material. As well as audio files, the package supports videos, images, and text as stimuli formats, making it suitable for investigations of iconicity in multiple modalities.
5. Conclusions
There has been a tendency in iconicity research to view resemblance as a silver bullet, but when we really look into it resemblance alone does not always explain why, for example, smooch is better than kiss, or smoosh is better than flatten. That resemblances exist is not always enough – we also have to access them, and the things that determine whether and how we do this are likely to be part and parcel of many iconic effects. Measures of iconicity need to be sensitive to the involvement of these other processes, and here we show how triangulating insights from multiple measures offers a way to do this. As the empirical study of ideophones and iconicity is coming of age, it is critical to couple descriptive and theoretical work with quantification and reproducible methods. We made strides towards this by improving the reliability of the rating and guessing measures, and making the guessing measures more targeted. We’ve packaged these improvements in icotools, which simplifies and standardises the process of generating rating and guessing tasks. We hope that the methods and findings presented here provide a foundation for future work to build on, as well as a pointer towards a more nuanced treatment of iconicity as situated in broader processes.
Acknowledgements
The authors would like to thank Ian Joo and Bodo Winter for providing the opportunity to present an early version of the manuscript for feedback, as well as the three anonymous reviewers for their thoughtful comments and advice.
Data availability statement
The data from the study, as well as the code used to produce the experiments and analyses can be found on the Open Science Framework at https://osf.io/j57uc/.
Competing interest
The authors declare that the research was conducted in the absence of any commercial or financial relationships that could be construed as a potential conflict of interest.


 Open access