


Introduction
Today, 454 active nuclear power plants provide 17.6% of the total worldwide-generated electricity. Although several decommissioning projects have started in the last years due to policy changes, the number of operating reactors is still increasing as a result of worldwide population growth and economic progress (OECD-NEA, 2018). Therefore, considerable research and development is still focused on improving the efficiency of nuclear fuel material and its cycle, but also on finding solutions to reduce the toxicity of long-lived radioactive waste. Studying the distribution and quantity of actinides (Z = 90, 92–96) in the fuel after irradiation is of particular interest because actinides are major contributors to the high-level waste but could be potentially reduced through a process called transmutation (Berthou et al., Reference Berthou, Degueldre and Magill2003; Fernandez et al., Reference Fernandez, McGinley, Somers and Walter2009; Ohta et al., Reference Ohta, Ogata, Papaioannou, Kurata, Koyama, Glatz and Rondinella2011; Vespa et al., Reference Vespa, Rini, Spino, Vitova and Somers2012; Wiss et al., Reference Wiss, Hiernaut, Roudil, Colle, Maugeri, Talip, Janssen, Rondinella, Konings, Matzke and Weber2014; Capriotti et al., Reference Capriotti, Brémier, Inagaki, Pöml, Papaioannou, Ohta, Ogata and Rondinella2017; Wright et al., Reference Wright, Harp and Capriotti2019).
Perhaps the most important nondestructive micro-analytical method that is used to improve the safety and performance of nuclear fuels with the potential of reducing high-level waste is electron probe microanalysis (EPMA) (Walker, Reference Walker1999; Brémier et al., Reference Brémier, Haas, Somers and Walker2003, Reference Brémier, Inagaki, Capriotti, Poeml, Ogata, Ohta and Rondinella2016; Lamontagne et al., Reference Lamontagne, Blay and Roure2007; Walker et al., Reference Walker, Brémier, Pöml, Papaioannou and Bottomley2012; Bottomley et al., Reference Bottomley, Walker, Papaioannou, Bremier, Pöml, Glatz, Van Winckel, Van Uffelen, Manara and Rondinella2014; Capriotti et al., Reference Capriotti, Inagaki, Papaioannou, Brémier, Ohta, Ogata, Eloirdi, Bocci, Bouëxière and Rondinella2014; Moy et al., Reference Moy, Merlet, Llovet and Dugne2014; Wiss et al., Reference Wiss, Rondinella, Konings, Staicu, Papaioannou, Bremier, Pöml, Benes, Colle, Van Uffelen, Schubert, Cappia, Marchetti, Pizzocri, Jatuff, Goll, Sonoda, Sasahara, Kitajima and Kinoshita2017; Gerczak et al., Reference Gerczak, Parish, Edmondson, Baldwin and Terrani2018; Llovet et al., Reference Llovet, Moy, Pinard and Fournelle2020). EPMA is a fast and reliable tool usually applied to earth and material sciences, yet encounters several technical obstacles in nuclear fuel analysis. First, the preparation and characterization of radioactive samples requires specifically designed equipment in nuclear-grade facilities to avoid contamination, such as glove boxes under different atmospheres, under pressure in laboratories, remote handling in hot cells, or lead walls protecting analytical measurement tools and personnel (Walker, Reference Walker1999). These facilities are globally rare, while research and development on nuclear fuels is strictly regulated by (inter)national policies. Second, microprobe counting detectors and other sensitive parts in the column are exposed to high β- and γ-irradiation from the samples, which demands special and costly shielding (Walker, Reference Walker1999; Lamontagne et al., Reference Lamontagne, Blay and Roure2007; Walker et al., Reference Walker, Brémier, Pöml, Papaioannou and Bottomley2012). Third, well-polished surfaces are crucial for the quality of quantitative analysis using EPMA, yet all of the common sample preparation steps such as embedding, grinding, polishing, and controlling the polishing status under a microscope have to be carried out in glove boxes (Walker, Reference Walker1999; Lamontagne et al., Reference Lamontagne, Blay and Roure2007; Wright et al., Reference Wright, Popa and Pöml2018), but these “simple” steps are not necessarily available all in one glove box. Thus, every approach in sample transportation imposes a risk of destroying or even losing the sample. These obstacles during preparation for microanalysis occur next to complications in fabrication methods (Wright et al., Reference Wright, Popa and Pöml2018) or policy and logistical issues during transportation.
Beside all practical and technical complications, EPMA on actinide-bearing samples is an analytical challenge: First, the analysis of the M line region is highly complex. The characteristic main M-line X-rays from the actinides all fall into a narrow energy region (2.8–4 keV), which causes substantial interferences. Second, the Ar K absorption edge at 3.2029 keV occurs in this energy range and reduces the intensity of some actinide element X-ray lines. Moreover, the analysis using M-lines is impaired with uncertainties in mass absorption coefficients (MACs) and lower fluorescence yields compared to K-lines, where the lower fluorescence yields worsen peak-to-background ratios and detection limits (Rinaldi & Llovet, Reference Rinaldi and Llovet2015; Pöml & Llovet, Reference Pöml and Llovet2020). Third, high beam currents (in the hundreds nA) are used to improve counting statistics, which increase the beam size and thus decrease spatial resolution. This trade-off is especially prominent for instruments using W filaments, and it is less problematic for LaB6/CeB6 sources and no issue for field emission guns. Note, there are no shielded microprobes using field emission guns to this date. High acceleration voltages of 25 keV are necessary to bypass oxidized layers of samples with high masses (Z = 90–96) and advance good statistics of generated X-ray photons in the M line region (2.8–4 keV), but high voltages increase absorption effects, decrease spatial resolution, and excite high-energy L-lines, which in turn can travel long distances in matter and cause fluorescence, including secondary fluorescence across grain boundaries. Thus, the measurement of actinide-containing samples using EPMA remains challenging and requires further investigation and most importantly facilitation.
For this purpose, we report here a step-by-step guideline to quantify actinides (Th, U, Np, Am, Pu, Am, and Cm) in as-fabricated or irradiated nuclear fuels. For the development of this guideline, we have first assessed the status, composition, and homogeneity of rare actinide-bearing reference materials available at the Joint Research Centre of the European Commission (JRC), Karlsruhe, Germany, as the accuracy of any future quantification of unknown samples relies on the accuracy of the measurements on the reference materials. These reference materials were then used to investigate and visualize prominent X-ray interferences in the M-line region and outline the frequently used method to account for interferences. We then define the preferred choice of X-ray lines, list their peak positions, the preferred background positions, and apply the to-date most effective background correction tool (Jercinovic et al., Reference Jercinovic, Williams, Allaz and Donovan2012; Allaz et al., Reference Allaz, Williams, Jercinovic, Goemann and Donovan2019). Finally, we use the correction factor approach to quantify the Am and Cm contents for the case where reference samples are not available. The new guideline was successfully tested on an irradiated sample, showing that the measurement of actinides is complex yet achievable. This work should improve the routine post- or prior-irradiation analysis of actinides bearing materials using a shielded electron microprobe.
Materials and Methods
Five actinide reference materials (<2 × 1×0.2 mm) were investigated in this study: in-house prepared powder ceramics of UO2, PuO2, and (U0.8Am0.2)O2 (Vespa et al., Reference Vespa, Rini, Spino, Vitova and Somers2012), an in-house prepared single crystal of NpO2, and a commercially available reference of ThO2 (Astimex). The in-house prepared samples were cut, polished, and Al-coated (~20 nm) in glove boxes at JRC Karlsruhe, Germany (Ritter, Reference Ritter2015).
Analysis was carried out using a shielded electron microprobe CAMECA SX 100 R at the JRC Karlsruhe, with four vertically aligned spectrometers, two equipped with  $10\bar{1}1$ quartz (QTZ; 2d = 6.686 Å) and two with pentaerythritol (PET; 2d = 8.742 Å) crystals for the analysis of actinides. The spectrometers’ flow-through proportional counters for PET and QTZ crystals are utilizing P10 as counting gas atmosphere at atmospheric pressure and 2 bars, respectively. Analytical measurement conditions are summarized in Table 1.
Table 1. Analytical Conditions Used for the Measurement of Reference Materials.

a Dwell time for wavelength-dispersive spectra described as measurement time on peak.
b Spot sizes were 1 μm for spot analysis and 20 μm for wavelength-dispersive spectra.
c PuO2.
d Two background positions on each side of the peak.
Because of the lack of secondary standards, the standards were measured against themselves. For (U0.8Am0.2)O2, UO2 was used for U, NpO2 was used for Np, and a virtual standard was used for Am (calibration curve approach, see section “Correction factors for missing reference materials: Americium and Curium”). Ten to eleven points were measured on each standard. For ThO2, no extra standard measurements were performed, and the average of the measurements was taken as the reference value. The measurements on ThO2 were performed at 20 nA. UO2 and NpO2 were measured at 60 nA (standard and unknown points), and 20 nA was used for the PuO2 reference points, and 180 nA was used for the PuO2 unknown points.
A shielded microprobe differs from a normal one mainly by shielding the P10 gas flow-through proportional counters from the gamma radiation of the sample using heavy metal such as Pb or W. In addition, the microprobe is usually placed behind a lead wall or inside a lead cell to protect the operator from the radiation. At JRC Karlsruhe, this lead cell has a wall thickness of about 10 cm and is designed to shield about 2 Ci (Walker, Reference Walker1999; Pöml et al., Reference Pöml, Brémier, Lahuerte, Hasnoui and Walker2010). The software package “Probe for EPMA” (www.probesoftware.com) was used for acquisition and data processing. For the matrix correction, the PAP model (Pouchou & Pichoir, Reference Pouchou and Pichoir1984, Reference Pouchou, Pichoir, Heinrich and Newbury1991) was applied. The MACs of Farthing & Walker (Reference Farthing and Walker1990) were used. They are based on the equations from Heinrich (Reference Heinrich, Brown and Packwood1986) with minor modifications and were extrapolated for elements up to Cm.
Results
Reference Material Homogeneity
To assess the homogeneity, status (porosity and planeness), and composition of the reference materials, secondary electron (SE) and backscattered electron (BSE) images, qualitative X-ray maps, and quantitative spot analysis (50–200 spots per reference) were obtained by applying the analytical conditions, as shown in Table 1. For the spot analyses, ThO2, UO2, PuO2, and NpO2 were used as reference materials for the measurements of Th, U, Pu, and Np, respectively. By using the same reference materials as unknown samples and references alike, that is measuring the reference materials and using the reference as standard material, along with calculating mean, standard deviation, and minimum/maximum of the resulting spot analyses (Table 2), we were able to evaluate the relative composition and homogeneity of the reference materials. Thus, the given weight percent results in Table 2 do not represent absolute values.
Table 2. Quantitative Spot Analysis Results of Reference Materials Used in This Study Using the Analytical Conditions in Table 1.

The following matrix-matching reference materials were used for quantitative spot analysis: commercial ThO2, in-house prepared UO2, PuO2, NpO2, and a correction factor for AmO2 (section “Correction factors for missing reference materials: Americium and Curium”). Thus, measured weight percent results do not represent absolute values.
RSD, relative standard deviation; SE, standard error in the intensity ratio (k). Nominal weight percent: 87.9 for Th in ThO2, 88.2 for U in UO2, 88.1 for Np in NpO2, 88.4 for Pu in PuO2, and 70.3 for U and 17.9 for Am in U0.8Am0.2O2. Totals were obtained by calculating the O contents by stoichiometry (not shown in the table).
As seen in Figure 1 and Table 2, UO2, NpO2, and PuO2 are dense and show good homogeneity. UO2 and NpO2 show no porosity, whereas differences in polishing quality can be observed. The commercially available ThO2 consists of various pieces, where some show increased porosity. Spot analysis results show slightly higher statistical scattering and we have observed strong electrostatic charging on the ThO2, and thus, no qualitative maps were acquired for the latter. PuO2 shows increased porosity and one location around a larger pore (Fig. 1k) with decreased Pu Mα and increased Am Mα intensity. The latter can be either explained by contamination during mixing of the starting material or inhomogeneous mixing of the starting material before/during sintering. Note that the total for PuO2 is slightly low (99.11 wt%). We attribute that to dead-time issues, because the PuO2 points were measured at 180 nA in order to properly detect the Am in the PuO2 reference material.

Fig. 1. Secondary electron images (SE, left column) (a,c,f,i,l), backscattered electron images (BSE, center column) (b,d,g,j,m), and qualitative X-ray maps (right column) (e,h,k,n) on the reference materials used in this study (measured X-ray line indicated). Due to too strong electrostatic charges despite Al-coating, a qualitative map was not recorded for ThO2.
The (U0.8Am0.2)O2 reference material shows increased inhomogeneity including Np impurities and was thus rated unsuitable as a reference material for the routine analysis work at JRC Karlsruhe. Nevertheless, for this work we have used the (U0.8Am0.2)O2 reference material for further studies, specifically for the measurement of wavelength-dispersive spectra to observe Am X-ray lines (see following sections).
Line Interferences
Wavelength-dispersive spectra were recorded for peak and interference identification and the selection of background positions on all five reference materials containing Th, U, Np, Pu, and Am, between 2.3 and 7.3 keV (1.7 and 5.4 Å). Figure 2 shows all carefully assessed X-ray lines of Th, U, Np, Pu, and Am measured on ThO2, UO2, NpO2, PuO2, and (U0.8Am0.2)O2, respectively, where the typical spectral background trend can be observed. Peak positions were assessed by manually finding the highest intensity and recording the spectrometer position. The count rate of the highest-intensity X-ray lines decreases as expected in the following order: Mα>Mβ>Mγ (Fig. 2a). Interestingly, the minimum intensity signal between Mα and Mγ is stronger than the bremsstrahlung continuum due to the overlap of the tails of these peaks. Peaks of rarely seen line transitions such as M1N2, M3O1, and M4O2 are noticeable and show that care must be taken when background positions are selected (see below and section “Background correction and peak positions”).
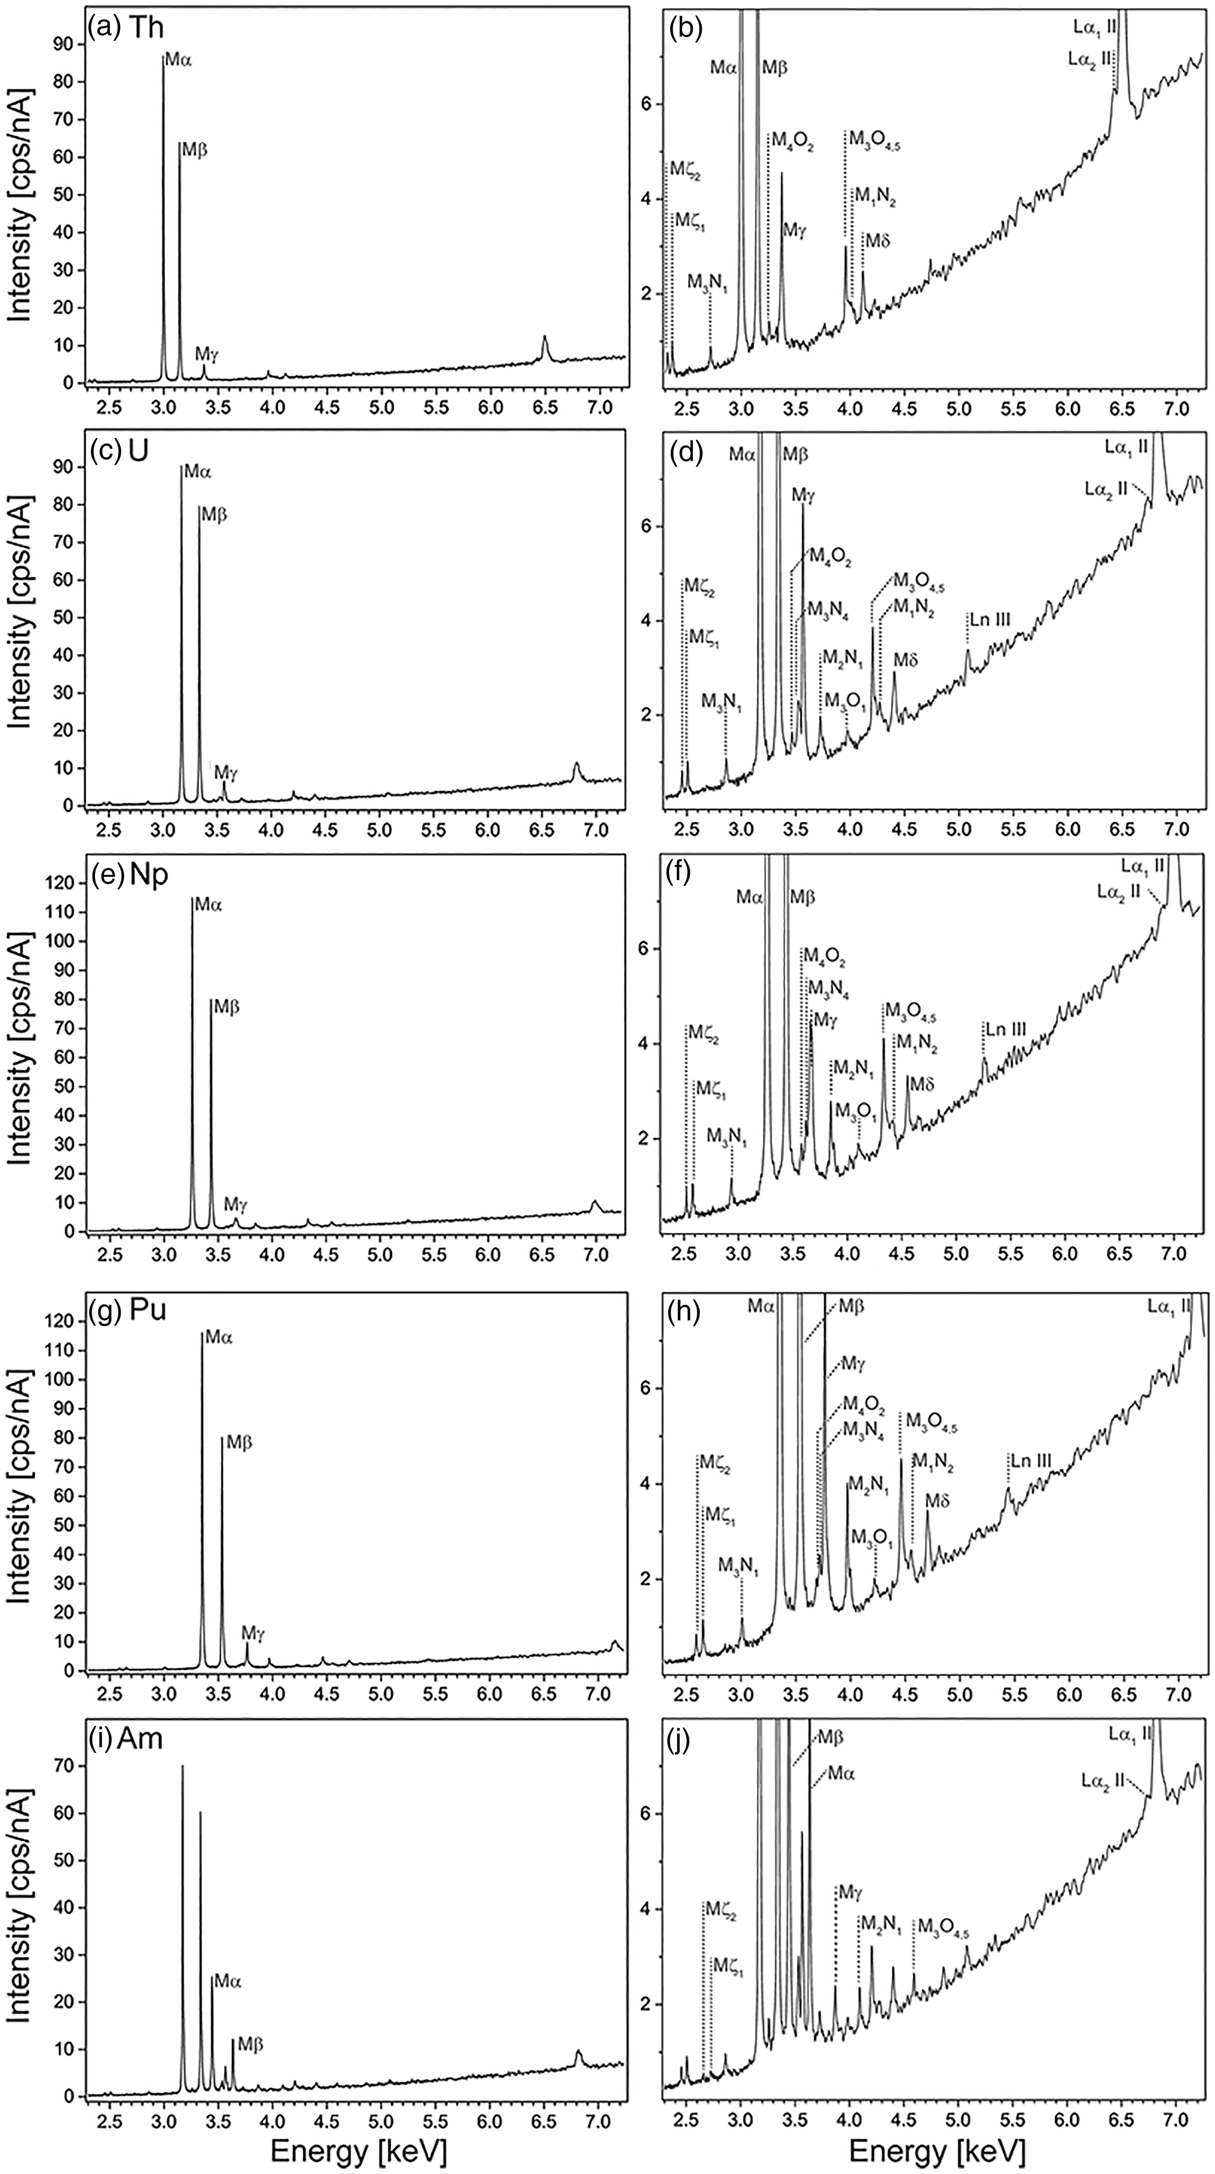
Fig. 2. Detailed wavelength-dispersive spectra measured on QTZ 10-11 showing all high intensity (a,c,e,g,i) and respective low intensity (b,d,f,h,j) peaks of Th (a,b), U (c,d), and Np (e,f), Pu (g,h), and Am (i,j). Note the U peaks in i and j, since the material is U0.8Am0.2O2.
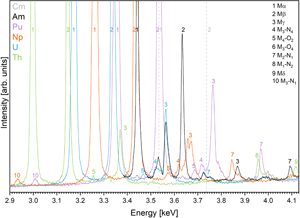
In the next step, these spectra were used to illustrate the complex and convoluted M-line region with all possible interferences between the most common high-intensity peak assemblages (Mα, Mβ, Mγ) of Th, U, Np, Pu, Am, and Cm (Kleykamp, Reference Kleykamp1991) in Figures 3 and 4. The most prominent interferences occur between U Mα and Th Mβ, Pu Mα, and U Mβ, and between Cm Mα and Am Mβ, yet interferences between low-intensity peaks should not be underestimated. Figure 4 shows a detailed view on the convolution of the M line region. An overview of possible interferences of Mα, Mβ, and Mγ X-ray lines on peak and on background positions (more discussion in section “Background correction and peak positions”) is listed in Table 3 and can be used to facilitate the set-up of the analytical protocol. Depending on the elements in the sample, the X-ray lines with the least interferences should be selected for on-peak counting in quantitative spot analysis. Lines with high count rates should, however, be preferred over lines with low count rates—a trade-off. If interferences cannot be avoided, an overlap correction has to be applied: for instance, if the measured line on an unknown sample is U Mα, and Th Mβ is the interfering line, the U Mα intensity has to be corrected for the Th Mβ intensity by measuring the intensity of U Mα on a U-free Th reference material (e.g., ThO2). This intensity should then be subtracted from the U Mα intensity measured on the unknown. Note that this method of overlap correction is a commonly accepted method in EPMA. We want to emphasize that there may not be a one-method-fits-all solution, as discussed in section “Case study on an irradiated sample.”

Fig. 3. M-line region of actinides, measured on actinide bearing materials using α-quartz “QTZ” (a) (reflecting plane  $10\bar{1}1$, 2d = 6.686 Å) and PET (b) (2d = 8.742 Å). Peak assemblages of X-ray M line transitions (α, β, and γ) and the interferences of all measured actinides (Th, U, Np, Pu, and Am) are illustrated. Additionally, peak positions of Cm Mα and Cm Mβ are indicated (Kleykamp, Reference Kleykamp1991). Note the drop in intensity on the spectrum measured on PET at energies of <3.22 keV as a result from the Ar K absorption edge (see section “Effects from the Ar K absorption edge”).

Fig. 4. The complex M-line region from Figure 3 seen here in detail, showing interferences between low-intensity peaks (indicated in numbers). Note that U peaks occur both in U and (U, Am) containing samples. Peak positions of Cm Mα and Cm Mβ (gray, dashed) taken from Kleykamp (Reference Kleykamp1991).
Table 3. Interferences on Peak and Both Background Positions for α, β, and γ X-Ray Lines for Th, U, Np, Pu, Am, and Cm.

Higher/lower represent higher/lower energy side, respectively. See more details in sections “Line interferences” and “Background correction and peak positions.”
Background Correction and Peak Positions
The spectra shown in section “Line interferences” were used to identify the peak positions from all major observed X-ray lines, which are reported in Table 4. Peak positions were found as the value on the x-axis with the maximum intensities on the y-axis. Error (standard deviation) on peak positions is below 1%, as calculated from three wavelength-dispersive spectra reported in a previous study (Ritter, Reference Ritter2015). The energy of U Mα was used to calibrate the spectrometers, as this energy should be reasonably well known. The listed peaks show very good agreement with values previously reported in the literature (Bearden, Reference Bearden1967; Kleykamp, Reference Kleykamp1981; Dellith et al., Reference Dellith, Scheffel, Terborg and Wendt2011; Saber et al., Reference Saber, Chen-Zhong, Xiang-Li, Wei-Dong and Zhong-Wen2014). For instance, Th Mβ lies at 3.145 keV in this study and at 3.145 keV in Bearden (Reference Bearden1967); U Mδ lies at 4.402 keV in this study and at 4.402 keV in Dellith et al. (Reference Dellith, Scheffel, Terborg and Wendt2011); and Pu Mα lies at 3.350 keV in this study and at 3.349 keV in Kleykamp (Reference Kleykamp1981).
Table 4. Peak Positions Determined in This Study (in keV) from Wavelength-Dispersive Spectra Measured on Reference Materials Compared with the Literature.

Errors on peak positions from this work are below 1%, calculated as standard deviation from three measured wavelength-dispersive spectra.
However, the Ar K absorption edge (discussed in the following section “Effects from the Ar K absorption edge”), interferences, and increased background signal make it difficult to measure the true background signals of the analytical X-ray line of interest. Using the common background correction approach of selecting one background position close to the peak at each side can lead to significant errors (Allaz et al., Reference Allaz, Williams, Jercinovic, Goemann and Donovan2019), especially if several actinides have to be measured in one sample. Thus, we have followed the multi-point background acquisition method (Jercinovic et al., Reference Jercinovic, Williams, Allaz and Donovan2012; Allaz et al., Reference Allaz, Williams, Jercinovic, Goemann and Donovan2019), which was initially developed for precise and accurate analysis of transition elements at low concentrations (Merlet & Bodinier, Reference Merlet and Bodinier1990; Jercinovic et al., Reference Jercinovic, Williams, Allaz and Donovan2012, Reference Jercinovic, Williams and Lane2008). This tool is implemented in the Probe for EPMA software package (http://www.probesoftware.com/) and enables the measurement of multiple background points on either side of the peak followed by automatic evaluation and regression. This method significantly improves the background measurement in EPMA, as it allows modeling the “true” background spectrum and gives details about background interferences, holes in the background, or absorption edges, which can alter the results if neglected (Allaz et al., Reference Allaz, Williams, Jercinovic, Goemann and Donovan2019). Moreover, this tool provides the option to model the background of several elements simultaneously, if elements are analyzed on the same spectrometer (Allaz et al., Reference Allaz, Williams, Jercinovic, Goemann and Donovan2019). This “shared background approach” allows the identification of absorption spectra and interferences during post-processing and reduces measurement times while accurately determining curvature and improving counting statistics (Allaz et al., Reference Allaz, Williams, Jercinovic, Goemann and Donovan2019). Despite its advantages, the operator has to compromise at times between selecting multiple background points and only two background points due to substantially disturbed background signals close to the peaks of interest (see section “Case study on an irradiated sample”).
Figure 5 plots an example of how background positions were selected for all actinide elements on reference materials consisting of only one actinide element or two for (U,Am) bearing samples. From this sample, it becomes evident that even samples containing only one actinide element (i.e., Pu), the background curvature is strongly influenced by interferences. After statistical smoothing, two background points were chosen on the lower energy and two on the upper energy range far away from the M-line peak of interest, avoiding the Ar-absorption edge, the increased intensity region between the Mα and M2N1 peaks (section “Line interferences”), and other interfering low-intensity X-ray lines (Fig. 4). Note the explanations of the Ar K edge effect in Figure 5b in the following section. Fitting the intensity measured on the background positions to an exponential function better represents the continuum spectrum compared to previously overestimated background signals (Reed, Reference Reed1975, Reference Reed1997). Following this approach, background positions for all elements were selected and are listed in Table 5.

Fig. 5. Wavelength-dispersive spectra measured on the PuO2 reference material on (a) QTZ and (b) PET with selected background positions (Low 1,2; High 1,2) for Pu. Interferences occur between Mα, Mβ, and Mγ peaks. The strong Ar K absorption edge effect renders the PET crystal practically unusable, while the effect is hardly seen on the QTZ crystal; see text for explanation. The Am Mα peak appears between Pu Mα and Pu Mβ due to the decay of 241Pu into 241Am (t½ 14.3a). 1 = Mα, 2 = Mβ, 3 = Mγ, 4 = Mζ2, 5 = Mζ1, 6 = M3N1, 7 = M4O2, 8 = M3N4, 9 = M2N1, 10 = M3O1.
Table 5. Complete set of Background Positions (in keV, sinΘ, and mm) for Mα X-Ray Lines for Th, U, Am, Np, and Pu, to Be Used for Reference Materials Consisting of One Actinide Element.

Effects from the Ar K Absorption Edge
In addition to the interferences, the Ar K absorption edge falls exactly into the energy region of the actinides, causing a sharp intensity drop at 3.2029 keV on the PET crystal. Figure 5b illustrates the effect of the absorption edge on the spectrum measured on PuO2. The absorption edge lowers the X-ray line intensities and background of the lower-energy side of this edge, and thus intensities of U Mα, Th Mα, Th Mβ, and any background intensities can be significantly lower compared to the X-ray intensities on the higher-energy side, that is, Np Mα or Pu Mα. Note that the low Am Mα intensity is the result of the lower Am content in the reference sample, where (U0.8Am0.2)O2 is composed of 6.67 mol% Am compared to 33.34 mol% Np found in NpO2.
Interestingly, the absorption edge has a significantly higher effect on the PET (Fig. 5), the reason for this being the difference in gas pressure in the spectrometer's counter. In most flow-through counters installed in EPMA spectrometers “P10” gas, a mixture of 90% Ar and 10% methane is used as the counting gas. The PET crystal is installed in a spectrometer, where the P10 gas in the counter is at atmospheric pressure. In comparison, the QTZ crystal is installed in a spectrometer, where the P10 gas in the counter is at 2 bars pressure. The higher pressure P10 gas shows a relatively small effect of the Ar K absorption edge, and the QTZ offers a slightly better energy resolution than the PET; that is, the full width at half maximum of the Pu Mα peak on the QTZ is 0.0107278 and 0.0120292 on the PET using a Voigt fit function. Thus, QTZ is the preferred choice for the measurement of actinides, as it resolves the line overlaps better. In fact, the strong Ar K edge effect on the atmospheric pressure spectrometer using the PET renders this setup virtually unusable. It is hence necessary to have either a QTZ or a PET crystal installed on a high-pressure spectrometer to properly measure the actinide M-lines. Alternatively, to avoid the side effects of the Ar absorption edge, sealed xenon counters could be used, but these are not available for the EPMA model used in this study.
Correction Factors for Missing Reference Materials: Americium and Curium
If reference materials are not available, other methods can be used to quantify the concentrations of an element. First, standardless or virtual reference procedures are highly promising as reported in Limandri et al. (Reference Limandri, Bonetto, Josa, Carreras and Trincavelli2012), Trincavelli et al. (Reference Trincavelli, Limandri and Bonetto2014), Moy et al. (Reference Moy, Merlet, Llovet and Dugne2014, Reference Moy, Merlet and Dugne2015), and Pinard et al. (Reference Pinard, Protheroe, Holland, Burgess and Statham2020), which are accompanied by an error of 9% for heavy elements (Moy et al., Reference Moy, Merlet, Llovet and Dugne2014, Reference Moy, Merlet and Dugne2015). Second, specifically for the quantification of Am, a missing reference for Am can be replaced by measuring the Am in-growth in the PuO2 material. Since 241Pu decays into 241Am with a half-life of t½ = 14.3a, the americium content in the PuO2 reference of known age could also be calculated and used as a virtual reference (Walker, Reference Walker1999; Lamontagne et al., Reference Lamontagne, Blay and Roure2007, Reference Lamontagne, Pontillon, Esbelin, Béjaoui, Pasquet, Bourdot and Bonnerot2013). This method can be used for other elements, where the radioactive decay and half-life are well known. However, it is important to note that the accuracy of this option suffers from low concentrations of the in-growth, which inevitably results in lower counting statistics and thus higher errors in the final results. A third and last option is the derivation of a calibration curve for the missing reference (Walker, Reference Walker1999; Pöml et al., Reference Pöml, Brémier, Lahuerte, Hasnoui and Walker2010; Wright & van Rooyen, Reference Wright and van Rooyen2020).
In this study, we found the in-house prepared material (U0.8Am0.2)O2 was not suitable to be used as a reference material for Am due to its inhomogeneity. Thus, we followed the third mentioned approach to derive a correction factor for Am Mβ, as an example, by measuring the Mβ intensities of adjacent elements and fitting them to a linear regression. In this way, the U intensity can be used as a reference material for Am. In detail, the Mβ intensities of U, Np, and Pu (Z = 92–94) are measured on one spectrometer, for example, on pure metals or oxides, corrected for k-ratio, dead-time, and coating effects, and subsequently normalized to the U Mβ intensity. After Moseley's law, these ratios are plotted as a function of atomic number and fitted to a linear regression (Fig. 6), which is extrapolated using the atomic number of Am to derive the correction factor (Am Mβ/U Mβ ratio) for Am. This factor is then multiplied with the U Mβ standard intensity (metal or oxide) to derive the theoretical intensity of Am in a virtual metal or oxide standard. This linear regression could be further extrapolated to derive a correction factor for Cm Mβ despite an increase in uncertainty, which is the trade-off for not having any physical standard available at all. Figure 6 shows the derivation of the correction factor for Am Mβ and Cm Mβ for each spectrometer. Here, it can be observed that Th Mβ needed to be excluded from the derivation of the calibration curve due to the sharp intensity drop caused by the Ar K absorption edge (Figs. 3, 5, 6; section “Effects from the Ar K absorption edge”). Uncertainties on the extrapolated ratios using the U Mβ intensity as denominator were determined from the 95% confidence limits, resulting in 3.6, 5.8, and 8.2% on Pu, Am, and Cm, respectively.

Fig. 6. Measured intensities from which the Am and Cm correction factors were derived using the X-ray intensities of Np Mα (orange) and U Mβ (blue) as common denominator. Note the intensity drop caused by the Ar K absorption edge (indicated as gray arrows) between U Mβ and Pu Mβ and between Th Mα and U Mα. 95% confidence limits are indicated as error bars on extrapolated intensity ratios for one fit; standard errors of the linear fit parameters are indicated in parentheses.
Similar to the Mβ line regression, the intensities from Mα lines were measured and tested to be used to derive a correction factor for Am or Cm. However, the Ar K absorption edge would affect both Th Mα and U Mα intensities, and as a result, only Np Mα and Pu Mα would be taken into account for the linear regression while using Np Mα as the common denominator (Fig. 6).
It should be stated that the composition of the sample and the resulting interferences should dictate which correction factors should be used, either those derived from Mα or from Mβ lines. For instance, if a sample contains U, Np, Pu, Am, and Cm, the Am concentration should be measured by using the Mα correction factor and the Cm concentration can be measured by using the Cm Mβ correction factor (see section “Case study on an irradiated sample”).
Case Study on an Irradiated Sample
We report the quantitative analysis of an irradiated sample taking into account the analytical guidelines discussed in the previous sections. The sample in this case study is an irradiated metal fuel alloy, its base elements being U, Pu, Zr, minor actinides (Np, Am, and Cm), and rare earth elements (Y, Ce, Nd, and Gd; Capriotti et al., Reference Capriotti, Brémier, Inagaki, Pöml, Papaioannou, Ohta, Ogata and Rondinella2017). This sample is part of the METAPHIX program, which is a collaboration between the JRC and the Central Research Institute of Electric Power Industry (CRIEPI, Japan) focused on studying the effectiveness and safety of a closed nuclear fuel cycle with regard to minor actinide separation from spent fuel, incorporation in metal alloy fuel, and transmutation in fast reactors (Ohta et al., Reference Ohta, Ogata, Papaioannou, Rondinella, Masson and Paul2015; Capriotti et al., Reference Capriotti, Brémier, Inagaki, Pöml, Papaioannou, Ohta, Ogata and Rondinella2017). The irradiated sample shows strong porosity and compositionally different areas (Fig. 7). We chose to report results of two distinct areas (Fig. 7), hereafter referred to as Phases 1 and 2. Note that irradiated metallic fuel is prone to fast oxidation in air. To minimize any effects, the sample was prepared under an N2 atmosphere, coated with 20 nm Al, and then transported under vacuum to the EPMA where it remained under the chamber vacuum during analysis.

Fig. 7. BSE image of the irradiated fuel, showing the two investigated phases.
In the first step, it is crucial to record energy- or wavelength-dispersive spectra in order to identify elemental sample composition, to observe and avoid possible interferences, and to select X-ray lines and background positions for the quantitative measurement protocol. Note that selecting X-ray lines and background positions while describing interferences go usually hand in hand. Figure 8 shows the wavelength-dispersive spectra of the two different phases measured on the irradiated sample. Individual peaks were modeled with a Voigt function in the Fityk software (Wojdyr, Reference Wojdyr2010) to observe possible interferences. Phase 1 is Am, Cm, and Pu-rich, whereas Phase 2 shows increased concentrations of U, Pu, and Np. The wavelength-dispersive spectra in Figure 8 show that both phases reveal several interferences such as Am Mα with Np Mβ, Pu Mα with U Mβ, as well as Cm Mα with Pu Mβ. Moreover, Figure 8 shows that the L-lines of rare earth elements heavily interfere with the M-lines of minor actinides, and thus need to be corrected on top of the minor actinide interferences. For instance, Cm Mβ is corrected for U and Pu, and Pu Mα is corrected for U and Gd (Table 6), similar to what is reported in Wright et al. (Reference Wright, Harp and Capriotti2019). It is important to note, however, that with a sample consisting of minor actinides and other transition/rare earth elements (Z = 57–71), the operator has to compromise at times that several elements may have to be excluded from the measurement protocol due to the too-strong interferences. For the X-ray lines of both Am and Cm, we selected for this fuel to take Am Mα and Cm Mβ into the measurement protocol. Am Mα was selected due to the high intensity of the Am Mα peak and the low contents of Np. Despite the strong interferences between Cm Mβ and Pu Mγ, Cm Mβ was selected for quantitative spot analysis due to the better linear fit in the calibration curve derivation (Fig. 6).

Fig. 8. Wavelength-dispersive spectra measured on two phases present in the irradiated sample. (a) shows the Am, Cm, Pu-rich Phase 1, and (b) shows the U, Pu, Np-rich Phase 2. Interferences between all elements lead to increased background intensities and asymmetrical peak shapes (Cm Mα and Pu Mβ in (a)). Inlet shows modeled background signal. A typical quantitative measurement of each phase is given in Table 7.
Table 6. Measurement Protocol for the Analysis of an Irradiated Sample, Measured at 25 keV at 250 nA, Using the QTZ Crystal.

Measurement times are 50 s on the peak and 25 s on each background position.
a Unfortunately, Np and Pu metal standards were not available.
b 1.47 using Np Mα on NpAl2 as reference.
c Note that the correction for Pu on Am Mα is problematic because the PuO2 standard contains a minor amount of Am.
d 1.10 using U Mβ on U for Cm. The correction factor would be 1.08 for Am Mβ.
Figures 2–4 and Table 3 are further used to select X-ray lines with the least interferences. Table 6 then summarizes the measurement protocol including X-ray lines, reference materials (see more information below), spectrometer crystals, respective peak and background positions, and the respective corrections applied for the occurring interferences, as described in the section “Line interferences.”
In the next step, reference materials need to be selected. For this metallic fuel specimen, metallic standards were used where possible to avoid large matrix corrections that can occur when using oxide standards for a metallic sample. Unfortunately, for Np and Pu metallic reference materials were not available, and NpAl2 and PuO2 were used. As for the measurements of Am and Cm, the calibration curve approach was selected (Fig. 6; Table 6). For Am, a virtual metallic standard was created and its Am Mα intensity was calculated from the intensity of Np Mα on NpAl2 using a factor of 1.47. For Cm, a virtual metallic standard was created and its Cm Mβ intensity was calculated from the intensity of U Mβ on metallic U using a factor of 1.1.
Next, the analyzing spectrometer crystals have to be selected. In our case, Quartz was preferred over PET due to higher energy resolution for actinides and lower Ar K absorption effect (as discussed in the section “Effects from the Ar K absorption edge”). The next step is to select background positions, for which Tables 3–5 are used as a guideline. As stated above, the background positions were limited by the interferences between L- and M-lines. Therefore, only two background positions were selected far away from the peak convolution and exponentially fitted (Table 6; Fig. 8, inlet). Figure 8 shows that the exponentially fitted background follows the background signal, yet we want to emphasize that more background positions are the preferred choice for future measurements.
Finally, the new measurement protocol seen in Table 6 was applied to quantitative spot analysis on the two distinct phases. The results of spot analysis of two phases in the irradiated sample are given in Table 7, showing that Phase 1 of this sample contains high amounts of Am (15.1 wt%), Cm (4.94 wt%), and Nd (47.3 wt%) and trace amounts of Np (<0.09 wt%) and U (<0.07 wt%). Phase 2 contains high amounts of U (64.1 wt%), Pu (20 wt%), and Zr (9.46 wt%). The total values of Phases 1 and 2 show 96.7 and 98.2 wt%, respectively, which attest to the reliability of the new and improved guideline to measure actinides in fabricated or spent fuels, despite all above described analytical obstacles. Note that the slightly low total values can be attributed to either sub-micron porosity formed during irradiation or fission products that were not measured in this measurement protocol. In general, a total of 97-98 wt% is excellent for an irradiated fuel specimen.
Table 7. Analysis Conditions, Standardization Details, Interferences/Background Corrections, and Quantitative Spot Analyses (in wt%) of Two Phases of the Irradiated Sample Using the Updated Analytical Protocol.

Phase 1 is minor Actinide and REE-rich; Phase 2 is U and Pu-Rich.
DL, detection limit; SE, standard error; n.d., not detected.
Conclusion
In this work, we discussed the problems and challenges involved with the analysis of actinide elements using the electron microprobe and provide tools and a guideline for setting up an appropriate analysis protocol. For this purpose, the convoluted and complex region of X-ray lines emitted from the M shells was carefully investigated in order to avoid major interferences, absorption edge effects, and to select preferred peak and background positions. Options to include standardless methods were described for Am and Cm. The new and improved guideline was successfully tested on an irradiated sample, which can now be used as a base protocol for the microanalysis of actinide-bearing samples, for instance during routine post-irradiation examinations. Therefore, despite the encountered obstacles, the electron microprobe remains an important tool to investigate radioactive elements in unknown samples. Future investigations should focus on verifying MACs of actinide elements, for example, by empirical measurements, and strengthening research on standardless approaches.
Acknowledgments
X.R. greatly acknowledges the funding for a traineeship (project sheet reference no. 2013-ITU-2494) at JRC Karlsruhe. The authors thank X. Llovet for critically reading the manuscript. The authors gratefully acknowledge the critical and helpful comments of two anonymous reviewers.


 Open access