


Introduction
Electron monochromators have undergone significant improvements since they were first designed by Boersch et al. (Reference Boersch, Geiger and Hellwig1962), with current generation monochromators being employed as attachments to scanning transmission electron microscopes (STEM) that can routinely form 1 Å probes (Krivanek et al., Reference Krivanek, Nellist, Dellby, Murfitt and Szilagyi2003, Reference Krivanek, Bleloch, Dellby, Lovejoy, Shi and Zhou2018). When combined with high-resolution electron spectrometers (Lovejoy et al., Reference Lovejoy, Corbin, Dellby, Hoffman and Krivanek2018), these monochromators enable an energy resolution of up to 4.2 meV at 30 kV accelerating voltage (Krivanek et al., Reference Krivanek, Dellby, Hachtel, Idrobo, Hotz, Plotkin-Swing, Bacon, Bleloch, Corbin, Hoffman, Meyer and Lovejoy2019). Such unprecedented improvement in energy resolution has resulted in performing vibrational spectroscopy with a 1 Å STEM probe using electron energy-loss spectroscopy (EELS). Since the first reports on vibrational STEM EELS were published (Krivanek et al., Reference Krivanek, Lovejoy, Dellby, Aoki, Carpenter, Rez, Soignard, Zhu, Batson, Lagos, Egerton and Crozier2014; Miyata et al., Reference Miyata, Fukuyama, Hibara, Okunishi, Mukai and Mizoguchi2014), there has been tremendous progress in understanding the character of various vibrational energy-loss signals and investigating their spatial resolution (Egerton, Reference Egerton2015; Dwyer et al., Reference Dwyer, Aoki, Rez, Chang, Lovejoy and Krivanek2016; Forbes & Allen, Reference Forbes and Allen2016; Rez et al., Reference Rez, Aoki, March, Gur, Krivanek, Dellby, Lovejoy, Wolf and Cohen2016; Govyadinov et al., Reference Govyadinov, Konečná, Chuvilin, Vélez, Dolado, Nikitin, Lopatin, Casanova, Hueso, Aizpurua and Hillenbrand2017; Lagos et al., Reference Lagos, Trügler, Hohenester and Batson2017; Konečná et al., Reference Konečná, Venkatraman, March, Crozier, Hillenbrand, Rez and Aizpurua2018; Venkatraman et al., Reference Venkatraman, Rez, March and Crozier2018, Reference Venkatraman, Levin, March, Rez and Crozier2019; Hage et al., Reference Hage, Kepaptsoglou, Ramasse and Allen2019, Reference Hage, Radtke, Kepaptsoglou, Lazzeri and Ramasse2020).
Electrons in a STEM probe transmitting a specimen can excite vibrational modes via two mechanisms: dipole and impact scattering. The same nomenclature has been used previously to describe scattering in reflection-based high-resolution EELS with low-energy incident electrons by Ibach & Mills (Reference Ibach and Mills1982). Dipole scattering is associated with the long-range Coulomb interaction of the transmitting electron with the electron cloud in a chemical bond which polarizes the medium and modulates the bond dipole moment, giving spectral features typically observed with infrared (IR) absorption spectroscopy (Rez et al., Reference Rez, Aoki, March, Gur, Krivanek, Dellby, Lovejoy, Wolf and Cohen2016; Haiber & Crozier, Reference Haiber and Crozier2018). The spatial resolution of dipole scattering for vibrational EELS ranges from a few to tens of nanometers and can be modeled with the classical dielectric theory (Ritchie, Reference Ritchie1957; Crozier, Reference Crozier2017; Venkatraman et al., Reference Venkatraman, Rez, March and Crozier2018). Characteristic scattering angles involved with dipole scattering are small, practically the order of ~1 mrad.
Impact scattering is associated with short-range collisions with the core of an atom, giving spectral features that can be observed with inelastic neutron scattering but not IR absorption spectroscopy. Impact scattered energy-loss signals have atomic resolution, as demonstrated recently (Venkatraman et al., Reference Venkatraman, Levin, March, Rez and Crozier2019). Short-range interaction implies that impact scattering is associated with a large momentum transfer (the uncertainty principle) which means that its characteristic scattering angles are large. Thus, in general, dipole scattering dominates in the forward direction, while impact scattering dominates outside the convergent cone of a STEM probe (Dwyer et al., Reference Dwyer, Aoki, Rez, Chang, Lovejoy and Krivanek2016; Hage et al., Reference Hage, Kepaptsoglou, Ramasse and Allen2019). However, even in the forward direction, the electron beam can excite vibrational modes that do not involve bond polarization (and therefore cannot be strongly excited by dipole scattering), such as acoustic modes in all materials, optical modes in nonionic materials, and symmetric stretching and deformation optical modes in ionic materials. In crystals, the list would also include short-wavelength optical phonon modes at Brillouin zone boundaries (BZBs). The energy-loss signals of such excitations would be impact scattering dominated (Ibach & Mills, Reference Ibach and Mills1982).
In this paper, we want to explore the effect of varying probe convergence and spectrometer collection semi-angles on the on-axis vibrational energy-loss spectrum from a crystalline h-BN nanoparticle oriented along the [0001] zone axis. The dominant dipole contribution to the spectrum would be unaffected by a large change in probe convergence or spectrometer collection semi-angles, since it is associated with small scattering angles. We hypothesize that as the convergence or collection semi-angle becomes large enough to include BZBs, impact scattering dominated energy-loss signals from vibrational modes at BZBs will become more pronounced in the spectrum. To test this hypothesis, we have employed two probe convergence semi-angles of 10 and 33 mrad and two spectrometer collection semi-angles of 10 and 40 mrad for EELS acquisition, as the angle for completely encompassing the first Brillouin zone (BZ) in h-BN is 12.9 mrad.
Materials and Methods
Specimen Preparation
High-purity h-BN powder (99.8% pure) with average lateral dimensions of 5 μm and thicknesses of 300 nm was purchased from U.S. Research Nanomaterials, Inc. The powder was ultrasonicated in electronic grade (99.999% pure) isopropyl alcohol (IPA), purchased from Sigma Aldrich, for 1 h. Ultrasonication helps exfoliate the layered h-BN powder into thinner nanoparticles. The ultrasonicated solution was drop-casted onto a 3 mm, lacey carbon film-coated, 200 mesh Cu TEM grid purchased from Pacific Grid-Tech, and the grid was dried under a heat lamp for 1 h. The specimen was baked at 140°C for 12 h prior to introduction into the microscope to burn off all volatile hydrocarbons and prevent contamination.
Monochromated STEM EELS Measurements
STEM EELS analysis on the specimen was performed using the monochromated, aberration-corrected Nion UltraSTEM 100, operating at 60 kV accelerating voltage. It was routinely possible to make 1 Å sized probes with high convergence angles due to aberration correction up to the fifth order (Krivanek et al., Reference Krivanek, Nellist, Dellby, Murfitt and Szilagyi2003), and monochromation enabled a routine energy resolution of 10 meV (Krivanek et al., Reference Krivanek, Ursin, Bacon, Corbin, Dellby, Hrncirik, Murfitt, Own and Szilagyi2009). Each h-BN nanoparticle was oriented into the [0001] zone axis before EELS acquisition. The probe convergence semi-angle (α) was either 10 or 33 mrad, and spectrometer collection semi-angle (β) was either 10 or 40 mrad. Figure 1a shows a schematic diagram of the STEM EELS geometry employed. Figure 1b overlays circles representing the different convergence and collection angles on the first BZ at every reciprocal lattice point for [0001] h-BN. The procedure for calculating the angular dimensions of h-BN BZs is outlined in Supplementary Figure 1.

Fig. 1. (a) STEM EELS geometry employed during data acquisition. The solid orange cone above the sample denotes 33 mrad convergence, while the shaded orange cone denotes 10 mrad convergence. The solid green cone below the sample represents 40 mrad collection, while the shaded green cone represents 10 mrad collection. (b) Circles representing the different convergence and collection semi-angles employed are overlaid on the hexagonal 1st Brillouin zones of [0001] h-BN at each reciprocal lattice point. The angular dimensions of the M and K points relative to the Γ point are 11.2 and 12.9 mrad, respectively.
Energy-loss information was acquired either as “point-and-shoot” spectra from different positions on the nanoparticle or as linescans across the specimen edge (an energy-loss spectrum was recorded at every pixel along the linescan with the pixel size being 2 Å). An energy dispersion of 0.66 meV per channel was used to record the spectra. Parametric two-window background subtraction was performed to isolate spectral features from the background of the zero-loss peak (ZLP) tail and of energy losses preceding the feature of interest using custom MATLAB codes (Levin et al., Reference Levin, Venkatraman, Haiber, March and Crozier2019). The spectra were calibrated by setting the center of the saturated ZLP to 0 meV. We confirm the accuracy of our calibration by ensuring that the bulk out-of-plane optical phonon peak is at 100 meV or that the bulk LO phonon peak is at 194 meV when the probe is far away from the specimen edge. The error in measuring energy loss was the channel width, i.e., ±0.66 meV. The background-subtracted signal was expressed as a linear combination of Gaussians to quantify the contributions from different peaks in the vibrational spectrum. The nanoparticle thickness was estimated by performing low-loss EELS measurements with 10 mrad probe convergence, 57 mrad spectrometer collection, and an energy dispersion of 50 meV per channel (Supplementary Figure 2). The inelastic mean free path, λ, for valence shell inelastic scattering from h-BN was computed to be 75 nm at 60 kV (Iakoubovskii et al., Reference Iakoubovskii, Mitsuishi, Nakayama and Furuya2008). This value of λ is likely to be overestimated by ~25% (Egerton, Reference Egerton1981; Craven et al., Reference Craven, Bobynko, Sala and MacLaren2016; Shinotsuka et al., Reference Shinotsuka, Tanuma, Powell and Penn2019), and a more reasonable inelastic mean free path would be ~60 nm. Measurements were performed on nanoparticles of different thickness and the results in the figures come from a nanoparticle of approximately 40 nm thickness (t/λ value ~0.68).
Results
We first present the experimental observations showing how the vibrational spectrum from h-BN changes with variations in the angular conditions employed. To a high degree of accuracy, the entire set of spectra can be represented as linear combination of Gaussian peaks which facilitates the spectral interpretation (presented later in the Discussion section). We also present spatially resolved EELS to determine the degree of localization of different groups of peaks in the spectra. This allows to differentiate between spectral features that arise from dipole interaction and those arising from impact scattering.
Spectral Variation with Convergence and Collection Angle
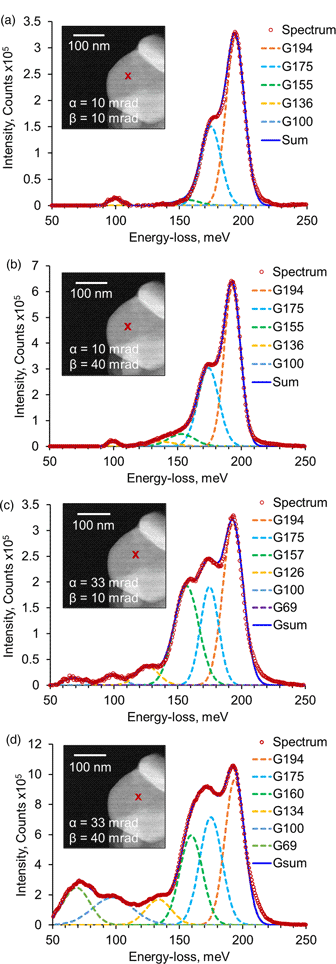
A typical background-subtracted vibrational energy-loss spectrum from a h-BN nanoparticle recorded with α = 10 mrad and β = 10 mrad is shown in Figure 2a (examples of raw spectra for all angular conditions are given in Supplementary Fig. 3). The inset shows an annular dark field (ADF) image of the nanoparticle and the probe position relative to the sample edge. The spectrum shows a strong peak at 194 meV with an intense shoulder at 175 meV and a weak peak at 100 meV. There is weak intensity on the lower energy-loss tail of the 175 meV shoulder. Gaussians were fit to the three main peaks in the spectrum as shown in Figure 2a. Two weaker Gaussians centered on 155 and 136 meV were added to improve the fit to the weak tail extending before the 175 meV peak. The integrated intensity of each of the Gaussian peaks normalized to the intensity of the strong peak at 194 meV is shown in Table 1. It is seen that most of the total spectral intensity is contained in the two high energy peaks. The background-subtracted spectrum obtained after β was increased to 40 mrad is shown in Figure 2b. The spectrum is very similar to Figure 2a, showing dominant peaks at 194, 175, and 100 meV. However, the lower energy-loss tail for the 175 meV shoulder is stronger in intensity relative to that in Figure 2a. The spectrum could again be well fitted to a series of Gaussians with peak energies identical to those of Figure 2a. Table 1 shows that the relative intensities of the two high energy peaks are not significantly changed, but the peaks at 136 and 155 meV have roughly doubled.

Fig. 2. Background-subtracted vibrational spectra and corresponding Gaussian peak fitting employed with (a) α = 10 mrad and β = 10 mrad, (b) α = 10 mrad and β = 40 mrad, (c) α = 33 mrad and β = 10 mrad,and (d) α = 33 mrad and β = 40 mrad.
Table 1. Integrated Intensities of Different Spectral Peaks as a Fraction of the Strong High Energy Peak at ~194 meV.

The background-subtracted spectrum obtained with α = 33 mrad and β = 10 mrad is shown in Figure 2c. The spectral shape is starkly different from Figures 2a and 2b. The intensity of the peaks at 126 and 157 meV is greatly enhanced, and an additional peak is observed at around 70 meV. Despite the marked changes, the spectral intensity can still be well represented with a series of 5 Gaussians with energies similar to those used in Figures 2a and 2b. A 6th Gaussian centered on 69 meV was added to account for the new low energy peak. Table 1 shows that the peak at 157 meV is now ~6 times stronger, and that all the other lower energy peaks have significantly increased in value. Thus, we have a somewhat surprising result that a threefold increase in α (keeping β constant) leads to a large variation in the form of the vibrational spectrum characterized by five- to tenfold increases in the relative intensity of the low-energy phonon peaks.
The background-subtracted spectrum obtained with α = 33 mrad and β = 40 mrad is shown in Figure 2d. The increase in β gives a threefold increase in the overall signal intensity relative to Figure 2c. The peaks at 175 and 194 meV look very similar in shape to that in earlier spectra, and the 100 meV peak is more than a factor of 6 stronger compared to Figure 2c. The spectral component corresponding to peaks at 160, 134, and 69 meV is also much stronger.
One preliminary conclusion that can be drawn from these measurements is that the two high energy peaks are present at approximately the same relative intensity for all four experimental conditions. All the other lower energy peaks show very pronounced variation and are strongest in the spectra acquired with a large convergence angle.
Identifying Dipole and Impact Signals From the Variation in Delocalization
The spatial variation profiles of the observed phonon energy-loss signals across the h-BN nanoparticle edge were determined by performing linescans with α = 33 mrad and β = 40 mrad. An ADF image in Figure 3a shows the linescan position relative to the nanoparticle; the step size for EELS acquisition is 0.2 nm. The background-subtracted vibrational spectra acquired at the two extremes of the linescan are shown in Figure 3b. The relative intensity of the shoulder to the 194 meV peak observed in previous spectra (Fig. 2) is reversed in the current transmission beam spectrum (impact parameter 29 nm). Also, the spectral position of this signal shifts to 179 meV. The aloof beam spectrum recorded at the end of the linescan in the vacuum (impact parameter 21 nm) shows only one sharp peak at 175 meV.

Fig. 3. (a) ADF-STEM image showing the position of the linescan across the h-BN nanoparticle edge. Linescan length = 50 nm, 250 pixels. (b) Background-subtracted transmission and aloof beam spectra at the extremes of the linescan with 33 mrad convergence and 40 mrad collection semi-angles. Impact parameter (distance of the probe from the nanoparticle edge) for the transmission spectrum was 29 nm, while that for the aloof spectrum was 21 nm.
The localization of the phonon signals was explored by plotting integrated intensities contained in different energy windows along the linescan. The background-subtracted signal must be normalized by the total signal going into the spectrometer to account for elastic scattering and sample thickness changes along the linescan. Since the ZLP was saturated, the signal was normalized relative to the negative tail of the ZLP, integrated between −250 and −200 meV (no significant energy-gain signal is observed in these spectra). The spatial variation profiles of signals covering different energy-loss peaks are shown in Figures 4a and 4b, with the simultaneously acquired HAADF signal profile overlaid on both plots for comparison.

Fig. 4. (a) Spatial variation of the 170–190 and 190–210 meV group of signals along the linescan overlaid on the HAADF profile. (b) Spatial variation of the 120–140 and 140–165 meV group of signals along the linescan overlaid on the HAADF profile.
The spatial variation profile of the phonon signal between 190 and 210 meV follows the HAADF profile up to ~10 nm from the edge, which confirms that it is a bulk signal. As the probe approaches the edge of the nanoparticle, it falls over a larger distance than the HAADF signal which shows that it is more delocalized. The signal in vacuum comes from the tail of the aloof signal at 175 meV (see Figure 3b).
The profile of the signal between 170 and 190 meV does not follow the HAADF signal profile; it is approximately constant with decreasing nanoparticle thickness up to ~10 nm from the edge. This implies that it is more of a surface signal (Egerton et al., Reference Egerton, Venkatraman, March and Crozier2020). It then falls rapidly till the probe is ~3 nm from the edge, and then drops more slowly to ~30% of its maximum value at the exact edge position. This implies that the surface signal is much more delocalized than the bulk signal between 190 and 210 meV. An inflection is observed in the 170–190 meV profile when the probe is ~3 nm from the edge. The spatial variation in vacuum is associated with the aloof signal at 175 meV. The strong delocalization associated with the 170–190 meV and 190–210 meV signal profiles demonstrates that they arise from dipole interactions between the fast electron and the sample. This analysis shows that the two high energy peaks that are present for all angular conditions arise from dipole scattering and are associated with small scattering angles.
The profiles corresponding to the signals between 140 and 165 meV and 120 and 140 meV mostly follow the HAADF intensity as the probe crosses the nanoparticle edge, indicating that these signals are highly localized (they drop slightly faster than the HAADF signal probably due to a 1 nm surface amorphous layer on the BN nanoparticle as seen in Supplementary Fig. 4). The high degree of localization implies that these signals are associated with impact scattering and larger scattering angles. It is interesting to note that the strength of these peaks dramatically increases in intensity when the convergence angle is large.
This analysis shows that the spatial variation in the intensity of different vibrational peaks is a convenient way of differentiating between dipole and non-dipole (impact) signals. As we will show in the next section, such information is helpful in assigning the phonon modes that are most strongly associated with the peaks in the energy-loss spectrum.
Discussion
Process to Assign Spectral Peaks to Phonon Modes
The energy-loss spectrum samples the scattering dynamic structure factor S(q, E) of the material and each point in the spectrum will be an integral of this function over the relevant range of energy and momentum transfers. The structure factor can be approximated as a joint density of states multiplied by a transition probability. A particular momentum transfer q could arise from multiple transitions between branches in the phonon dispersion curves that satisfy the energy and momentum transfer condition. However, this is a two-phonon process involving annihilation of the phonon in the lower band (corresponding to energy gain) and creation of a phonon in the upper band (corresponding to energy loss) and is not very probable. Moreover, at room temperature (kT ~25 meV), most of the phonon bands are empty. The peaks in the experimental spectrum are more likely to arise from the excitation of a single phonon when the fast electron transfers the appropriate energy and momentum described by the dispersion curves, E(k). For a material like h-BN where the E(k) is well known (see Fig. 5a, Serrano et al., Reference Serrano, Bosak, Arenal, Krisch, Watanabe, Taniguchi, Kanda, Rubio and Wirtz2007), simple inspection of the experimental spectrum will provide information on the types of phonon modes that give rise to the peaks. Peaks in the density of states (i.e., flat regions of the dispersion curves) are likely to give rise to peaks in the energy-loss spectrum. With this in mind, we inspect the energy loss spectrum acquired under the STEM conditions employed and explore a simple interpretation by referring to the E(k) curve.

Fig. 5. (a) Phonon dispersion curves at the Γ, M, and K points from bulk h-BN (Serrano et al., Reference Serrano, Bosak, Arenal, Krisch, Watanabe, Taniguchi, Kanda, Rubio and Wirtz2007). (b) In-plane dielectric function of h-BN showing the Reststrahlen band between 170 and 196 meV (Geick et al., Reference Geick, Perry and Rupprecht1966).
Detecting Long-Wavelength Modes From Dipole Scattering
In a dipole transition, the change in momentum is very small (q ~ 0), so this will correspond mostly to vertical transitions on an E(k) curve. At room temperature, the only vertical transitions with sufficient energy to give the two high energy peaks (194 and 175 meV) are near the Γ point corresponding to the excitation of long-wavelength longitudinal optical (LO) and transverse optical (TO) phonons in h-BN. For these two modes, the dispersion curves are relatively flat close to the Γ point corresponding to a high density of states consistent with the observation of peaks in EELS. The weak peak at 100 meV seems to be the long-wavelength out-of-plane optical (ZO) phonon mode. In [0001] h-BN, when the convergence and collection angles are small (α = 10 mrad and β = 10 mrad), the momentum transfer vector will lie mostly in the basal plane, so the ZO mode will be excited only weakly (as seen in Fig. 2a) since it requires momentum transfer normal to the basal plane for strong excitation.
In an electron–optical geometry where dipole vibrational modes close to the Γ point are strongly excited, features in the energy-loss spectrum can be described by approximating the collective response of h-BN to the fast electron's electric field with its optical dielectric function (Ritchie, Reference Ritchie1957; Govyadinov et al., Reference Govyadinov, Konečná, Chuvilin, Vélez, Dolado, Nikitin, Lopatin, Casanova, Hueso, Aizpurua and Hillenbrand2017). h-BN is an anisotropic layered material, with mixed ionic-covalent bonding in the B–N planes and van der Waal's forces between the B–N planes (Geick et al., Reference Geick, Perry and Rupprecht1966). Thus, it has different dielectric functions along the (0001) plane (in-plane) and perpendicular to it (out-of-plane). The in-plane dielectric function is shown in Figure 5b (Geick et al., Reference Geick, Perry and Rupprecht1966). The real part of the in-plane dielectric function is negative between 170 and 196 meV; this region is called the Reststrahlen band. These are also the TO and LO phonon mode positions derived from Kramers-Kronig analysis of infrared reflection spectra, showing good agreement with the Γ point values in the dispersion curves. The real part of the out-of-plane dielectric function is positive in this region. The opposite signs of the real part of in-plane and out-of-plane dielectric functions lead to an indefinite dispersion for electromagnetic waves propagating through h-BN (Poddubny et al., Reference Poddubny, Iorsh, Belov and Kivshar2013). [0001] h-BN nanoparticles can thereby support volume and edge-surface hyperbolic phonon polaritons (HPhP) due to anisotropy, and a previous vibrational EELS study from h-BN suggests that the peaks at 175 and 194 meV correspond to the volume HPhP and the bulk LO phonon modes, respectively (Govyadinov et al., Reference Govyadinov, Konečná, Chuvilin, Vélez, Dolado, Nikitin, Lopatin, Casanova, Hueso, Aizpurua and Hillenbrand2017). The 179 meV peak observed in the transmission spectrum in Figure 3b is probably a convolution of the volume HPhP at 175 meV and the edge-surface HPhP at 184 meV (Govyadinov et al., Reference Govyadinov, Konečná, Chuvilin, Vélez, Dolado, Nikitin, Lopatin, Casanova, Hueso, Aizpurua and Hillenbrand2017). The delocalization observed in the 190–210 meV spatial variation profile (Fig. 4a) is attributed to a Begrenzungs effect which is characteristic of a bulk dipole energy-loss signal as the probe moves toward a boundary (Egerton, Reference Egerton2011; Venkatraman et al., Reference Venkatraman, Rez, March and Crozier2018). The inflection point observed in the 170–190 meV profile ~3 nm from the nanoparticle edge can be attributed to an increased excitation of the edge-surface HPhP accompanied by a decreased volume HPhP excitation, while the profile observed in the aloof mode is characteristic of a polariton signal (Konečná et al., Reference Konečná, Venkatraman, March, Crozier, Hillenbrand, Rez and Aizpurua2018).
The Gaussian peak-fitting method provides a simple and convenient method to extract the dipole and non-dipole components of the spectrum. Gaussians associated with long-wavelength dipole modes (100, 175, and 194 meV peaks) were added to give the dipole spectrum in Figure 6a. The relative intensities of all the dipole peaks and all the non-dipole peaks from Table 1 were added and then compared to find that the non-dipole contribution (labeled BZB spectrum) is ~15 times weaker than the dipole contribution.

Fig. 6. Dipole and BZB contribution to background-subtracted vibrational spectra acquired with (a) α = 10 mrad and β = 10 mrad, (b) α = 10 mrad and β = 40 mrad, (c) α = 33 mrad and β = 10 mrad, and (d) α = 33 mrad and β = 40 mrad.
Detecting Short-Wavelength Modes From Impact Scattering
Increasing the Spectrometer Collection Angle
As shown in Figure 1b, the M and K points of the first BZB are located at 11.2 and 12.9 mrad relative to the Γ point, respectively. Increasing the spectrometer collection beyond these values will enhance the non-dipole contribution from short-wavelength modes at the BZB. The dipole and impact components of the spectrum obtained with α = 10 mrad and β = 40 mrad are shown in Figure 6b. The dipole spectrum is almost identical to that in Figure 6a which implies that long-wavelength modes are unaffected by an increase in spectrometer collection. The non-dipole component shows a two fold increase relative to Figure 6a due to the increased collection angle but is still ~10 times weaker than the dipole signal.
Increasing the Probe Convergence Angle
An alternative approach to increase the range of momentum transfer contributing to the spectrum is to increase the convergence angle. The dipole component of the spectrum obtained with α = 33 mrad and β = 10 mrad (Fig. 6c) shows good similarity to the dipole contributions recorded with the smaller probe convergence. The main difference is the energy and intensity of the polariton contribution at around 175 meV because of a change in the probe position relative to the specimen edge, and an increase in the ZO peak at 100 meV, in part due to the larger out-of-plane component of momentum transfer enabled by the factor of 3 increase in α. There could also be a contribution from the TA mode at the K point. We now consider the likely transitions responsible for the peaks at ~157, 126, and 69 meV. The localization of the peaks at 157 and 126 meV (shown in Fig. 4b) demonstrates that these are impact peaks. Since impact peaks involve significant momentum transfer, we can rule out vertical transitions which are consistent with the peaks being very weak in the spectrum with low convergence and collection angles. Since the 69 meV peak was also absent from the spectra with low convergence angles, we assume that it is also an impact peak. We also know that spectral peaks are probably associated with maxima in the density of states, and for h-BN, the density of states is high at the BZB. From inspection of the dispersion curves, we see that the peak between 145 and 160 meV matches well with the TO/LO BZB phonon, the one between 125 and 145 meV matches well with the longitudinal acoustic (LA) BZB phonon, while the one between 65 and 75 meV potentially constitutes the transverse acoustic (TA) and ZO BZB phonons. These vibrational mode assignments are labeled and described with their spectral positions in Table 2. Based on this analysis, the non-dipole part of the spectrum is associated with short-wavelength modes at the BZB and is a strong signal accounting for 36% of the background-subtracted spectral intensity.
Table 2. Different Vibrational Modes Excited by the Electron Beam in [0001] h-BN.

Increased Convergence and Collection Angles
The short-wavelength non-dipole contribution with α = 33 mrad can be further enhanced by increasing β to 40 mrad as shown in Figure 6d. The dipole contribution looks very similar in shape to that in earlier spectra except for the ZO/TA phonon at 100 meV being more than a factor of 4 stronger compared to Figure 6c. The non-dipole spectral component is still about ~36% of the background-subtracted spectral intensity. Interestingly, the significant enhancement on the peaks at 69 and 100 meV implies that each is strongly associated with the ZO phonon at the M and K points (69 meV) and at the center of the BZ (100 meV).
Origin of the Short-Wavelength Mode Enhancement with Increased Probe Convergence
The measurements presented here show that it is possible to acquire energy-loss spectra that probe phonon modes at both the center and boundaries of the BZ. It has been well established that EELS recorded with on-axis geometry can easily detect long-wavelength phonons at the Γ point. It was surprising to find that simply increasing the convergence angle of the electron probe would give a large increase in the contribution to the spectrum from short-wavelength BZB phonons. The delocalization measurements show the long-wavelength modes are probed by the dipole interaction, whereas the short-wavelength modes are probed by impact scattering. Table 1 shows that the TO/LO (short) and LA (short) in-plane modes increase by factors of 5–10 when the probe convergence angle is increased from 10 to 33 mrad. This is much larger than the factor of 2 increase that is associated with increasing the collection angle alone.
The short-wavelength mode enhancement associated with increasing the collection angle is expected, and sampling the off-axis scattering is the basis for mapping the phonon dispersion surfaces with EELS (Hage et al., Reference Hage, Nicholls, Yates, McCulloch, Lovejoy, Dellby, Krivanek, Refson and Ramasse2018; Senga et al., Reference Senga, Suenaga, Barone, Morishita, Mauri and Pichler2019). The origin of the five- to tenfold increase in the nondipole contribution associated with increasing the convergence angle is not well understood. To develop a fully quantitative understanding of this effect, it will be necessary to perform extensive calculations from a fully dynamical phonon scattering theory for electrons. Such calculations are not readily available at present; however, some insights can be gained from the fundamental properties of phonons and the recent vibrational EELS report from Si (Venkatraman et al., Reference Venkatraman, Levin, March, Rez and Crozier2019). It was shown that short-wavelength phonons in Si can be detected when large probe convergence angles are employed. Si is a nonpolar elemental semiconductor and there is no dipole contribution to the spectrum (whereas h-BN has a strong dipole response). Phonons can be excited either by normal processes, where the scattering wavevector lies within the first BZ, or via Umklapp processes, where the scattering wavevector lies outside the BZ (Ashcroft & Mermin, Reference Ashcroft and Mermin1976). Recent fully dynamical phonon scattering calculations for Si suggest that Umklapp processes from the second BZ may be critical in explaining many of the features observed in the on-axis spectrum (Rez & Singh, Reference Rez and Singh2021). These Umklapp processes are favored under strong diffraction conditions (large convergence angles encompassing multiple BZBs) and if the density of states peaks at the BZB, these are the modes that appear in the spectrum. Further experimental and theoretical work will be required to develop a fundamental comprehension of all the factors which influence the relative strength of the dipole and nondipole contributions. However, it is clear from the experimental results that when large convergence angles are employed, the forward scattering spectrum contains long-wavelength modes from dipole scattering and short-wavelength modes from impact scattering.
The difference in the spatial and angular dependence of the dipole and impact scattering processes offers two approaches to separate the short- and long-wavelength components of the spectrum. Recording two sets of spectra with high and low convergence angles will allow the dipole contributions to be easily identified since they will be approximately constant in each spectrum. Alternatively, spatial differencing techniques would also allow the dipole and impact contributions to be separated since the dipole signal will be much more delocalized. From a practical point of view, these two approaches have considerable utility. Spectral peaks can be associated with long- or short-wavelength phonons without the need for electron-scattering calculations or detailed knowledge of the dispersion curves of the system. The latter point is particularly important since the motivation for performing experiments in the STEM is to probe local atomic-scale heterogeneities such as defects or interfaces and determine the vibrational response. On a modern STEM, changing the convergence angle or spectral mapping is easily accomplished allowing rapid interpretation of the spectral features.
Conclusion
We have explored how dipole and impact electron scattering can be exploited to probe long- and short-wavelength phonon modes in crystals using EELS in a STEM. By varying the incident electron probe convergence and spectrometer collection angles, the relative contribution of dipole and impact scattering to the recorded spectrum can be varied. Specifically, optimum conditions for exciting phonons dominated by impact scattering and detecting them with a conventional on-axis STEM detection geometry were investigated in h-BN, a polar crystal. Employing a probe convergence semi-angle less than that required to completely encompass the first BZ of h-BN results in an energy-loss spectrum dominated by dipole scattering giving strong spectral contributions from long-wavelength phonons and polaritons from the central region of the BZ. Increasing the probe convergence to include the boundaries of the first (and higher) BZs enhances the impact scattering contribution yielding a spectrum containing not only long-wavelength modes but also a significant contribution from short-wavelength modes associated with the BZB. These impact signals are much more localized than the dipole signals. As the probe moves toward the h-BN nanoparticle edge, the dipole profile associated with the long-wavelength bulk LO phonon shows a characteristic attenuation over a 10 nm length scale due to the Begrenzungs effect. However, the LO phonon signal is more localized than the HPhP signal which extends many tens of nanometers into the vacuum. The impact signal profiles are much sharper and trace the HAADF profiles, thereby confirming their high spatial resolution.
Probing long- and short-wavelength phonons simultaneously with STEM EELS offers vibrational information on materials similar to that available from combining IR absorption and neutron-scattering spectroscopies. A huge advantage of the on-axis vibrational STEM EELS approach is that we can probe short-wavelength modes rapidly and with high spatial resolution. This ability will help establish a direct connection between vibrational excitations and local atomic-level defects and structural heterogeneities such as surfaces and interfaces in materials.
Supplementary material
To view supplementary material for this article, please visit https://doi.org/10.1017/S1431927621012034.
Acknowledgment
The authors acknowledge the insightful discussions with Prof. Peter Rez on the manuscript. They also acknowledge the financial support from the U.S. National Science Foundation (grant no. CHE-1508667) and the use of (S)TEM at John M. Cowley Center for High-Resolution Electron Microscopy in the Eyring Materials Center at Arizona State University.


 Open access