Introduction
The turn of the year has brought with it wild gyrations across global equity markets. The price of oil has declined to lows last seen in the first five years of this century and the prices of oil companies have led many bourses downward. Supply conditions certainly have a role to play in weighing on the oil price, however, there is also heightened discussion of a renewed global economic downturn. Certainly emerging market economic growth has slowed noticeably, be it the moderation in rate of growth in China or outright recession in Brazil and Russia. Conversely, there is an uptick in the growth of advanced economies; we estimate the economic growth of OECD economies accelerated from 1.8 per cent in 2014 to 2.1 per cent in 2015. This compares with growth, on average, of 1¼ per cent in 2012 and 2013.
At present the moderation in emerging market growth dominates, albeit marginally, suggesting an overall softening in the world GDP growth outlook (on a PPP adjusted basis). While there are clearly significant risks to the downside for the global economy, our modal forecast is for world GDP growth of 3.2 per cent in 2016, increasing to 3.8 per cent in 2017, the latter year supported by the return of growth to Brazil and Russia, but also through the continued increases in demand in advanced economies.
These developments matter for a small open economy such as the UK. Crucially, the distribution of growth throughout the global economy is important. While global growth remains subdued, growth in demand from the UK's major export markets is expected to accelerate over the next few years, most noticeably in the Euro Area. Despite robust growth in the volume of exports to emerging markets in recent years, they still account for approximately 20 per cent of total UK exports and so the UK's exposure to an emerging market slowdown is limited. This does not preclude the possibility of second round effects as other trade partners could be affected, especially in an era of fragmented supply chains.
Focusing solely on the trade channel when discussing the propagation of a shock, such as an emerging market slowdown, misses the importance of the financial sector transmission mechanism. The financial market linkages and exposure through the banking system are very relevant, especially for a country with a large financial sector, such as the UK. Figure 1 shows that this is relatively limited when compared to the assets of the banking sector as a whole, even when aggregated. However, the size of the UK's banking sector means, relative to annual GDP, these exposures are rather large. Bank of England (2015a) highlights these exposures relative to common equity Tier 1 capital. Even here we should put concerns over the exposure of the financial system to emerging markets in an appropriate context.

Figure 1. UK banking exposures to emerging markets
Importantly though, the distribution of this exposure is not uniform, nor the individual institution vulnerabilities. The Bank of England's recent stress test exercise included a sizeable slowdown in China and other emerging market economies (see Bank of England, 2015b). All UK banks involved in the exercise passed, including Standard Chartered and HSBC, both of whom have significant exposures to counterparties in Asia. While this is not a guarantee that tensions in emerging markets will not translate into difficulties for the UK banking sector, it does highlight the more resilient position the sector finds itself in.
Our modal GDP growth forecasts for this year and next are largely unchanged from those published just three months ago (figure 2). The global developments discussed have led to a softening of the outlook for UK export growth over the near term. Indeed, we expect export growth to ease from 5.4 per cent in 2015 to around 4 per cent this year. Offsetting this is the significant support generated by further falls in the oil price and easing of domestic policy. Domestic demand growth is expected to accelerate from 2.4 per cent in 2015 to 3.3 per cent this year, with consumer spending growth, the key driver, bolstered by the improved purchasing power from lower oil prices. Overall we expect GDP growth to remain at about the same rate as last year, expanding by 2.3 per cent per annum. The rapid pickup in GDP growth in 2017, to 2.7 per cent per annum, occurs through a combination of buoyant domestic demand, but most importantly a rapid pickup in export volumes due to further improvements in demand from advanced economies.

Figure 2. GDP growth forecasts
There are also a number of domestic risk factors. Abstracting from the debate over the long-run impact of the EU on the UK's economic performance, the referendum and its aftermath, in the event of a vote to exit, pose short- to medium-term downside risks. It is largely expected that the referendum on EU membership will take place this summer. As we approach this date, there is likely to be an increase in uncertainty leading firms to delay investment plans until the result in known (see Box A, UK chapter in the August 2015 Review). Our baseline projections assume that the status quo is maintained; we therefore have a more muted path for investment in the lead up to the referendum and an increase thereafter as firms implement their delayed investment plans. In the case of exit from EU membership, amongst other effects, this increased uncertainty is likely to remain throughout the two-year negotiation period set out in Article 50 of the Lisbon Treaty. This would lead to a longer period of subdued investment and remains a key downside risk to our forecast, irrespective of one's belief about the economic impact of EU membership (for a fuller analysis see Bank of England, 2015).
One potential danger that is not captured by our model is that the recent focus on downside risks generates a degree of pessimism among economic agents which weighs on growth via the confidence channel and becomes self-fulfilling. This need not be based in any change in the fundamental outlook, but nonetheless could have significant consequences for how the economy subsequently evolves.
Productivity growth is the key domestic judgement in determining the economy's outlook. Rising living standards hinge on a workforce delivering outputs more efficiently. It is a concern, then, that the economics trade has not converged on a clear ordereing of the reasons behind the ‘productivity puzzle’. The future productivity performance poses the most acute of domestic risks to the forecast. Changes in assumptions about future productivity performance have the ability to dramatically change our view of the appropriate stance of macroeconomic policies.
Output per hour worked increased by 0.8 and 0.6 per cent per quarter in the second and third quarters of 2015, respectively. Speculation as to whether this indicated the start of a sustained improvement in the UK's productivity performance was rife. However, we have experienced a couple of quarters of reasonable sequential productivity growth in this lukewarm recovery before (the first half of 2013 and during 2011, for example). Available data suggest the final quarter of this year disappointed. But as figure 3 shows, we expect this drop to be a ‘blip’ as sustained productivity growth resumes.

Figure 3. Whole economy gross value added per hour
Viewed from the perspective of the labour market, the past few years have seen a sharp decline in the unemployment rate. We estimate the rate of unemployment reached 5 per cent at the end of last year, its lowest level since 2005. Looking ahead, our forecast is little changed (figure 4). We expect the unemployment rate to hover around the 5 per cent mark over the next couple of years as the rapid pace of employment growth, that has been the corollary of weak productivity growth, eases. Consistent with poor productivity performance, however, is that employees’ real consumer wages are currently only at the level they were in 2005. With a sustained period of growth and acceleration in productivity growth, as we assume in this forecast, it will still take approximately five years for real consumer wages to return to the recent peak level of 2007.

Figure 4. Unemployment rate forecasts
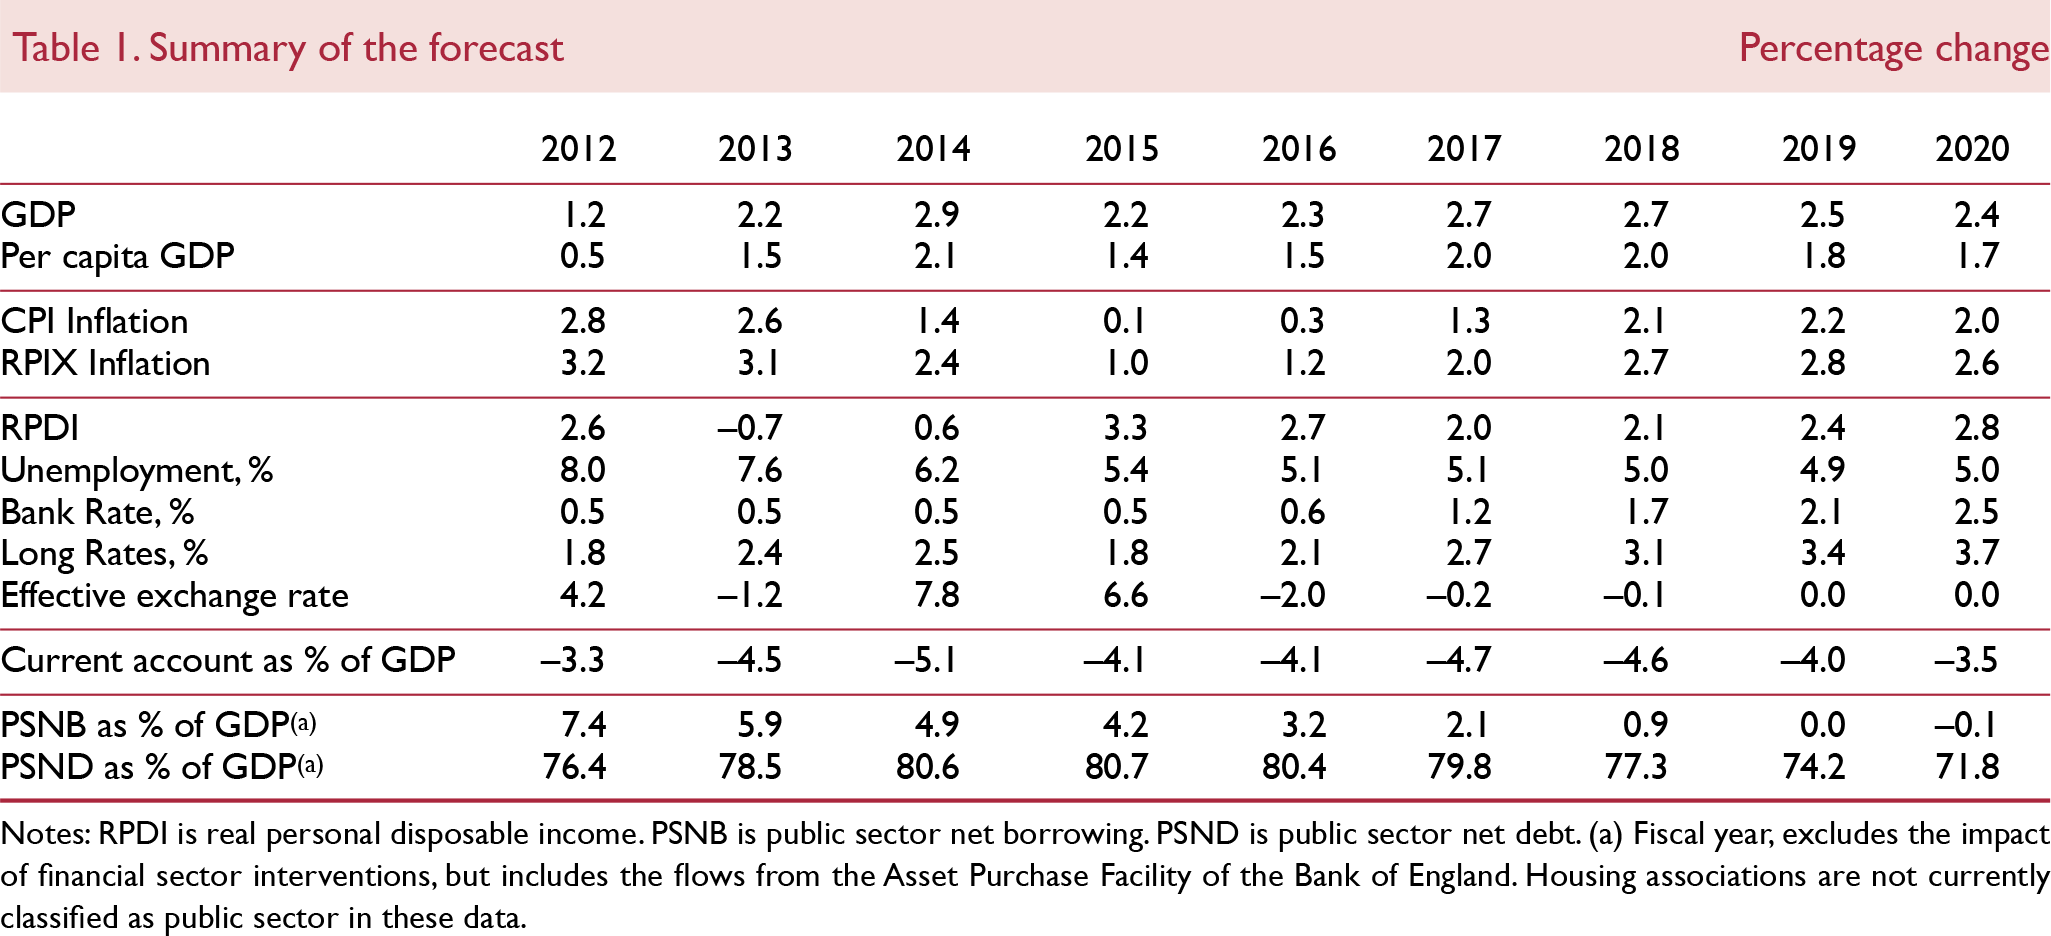
The Autumn Statement\Comprehensive Spending Review set the spending plans for the next five years across government departments. The surprise from this was the significant increases in government consumption planned, relative to that presented in the Summer Budget and most starkly, the last Budget of the coalition government. The Autumn Statement, building on the Summer Budget has presented a loosening of fiscal policy relative to coalition plans, something that was expected (see Reference KirbyKirby, 2015). The official forecasts suggest the government will hit their primary fiscal target of an absolute surplus in 2019–20 with a marginal degree of room to spare, despite the fiscal loosening introduced. As we discuss in the public finances section, this is predicated on a more accommodating macroeconomic outlook as viewed by the OBR, which is based on a combination of corrections to models underpinning key tax revenues forecasts, and their assumption about the path for Bank Rate, which provides significant fiscal space within the constraints of the Fiscal Mandate.
We have made neither these revenue forecast adjustments nor do we impose the mean of market expectations for interest rates on our forecasts. As such our forecast suggests the public sector will continue to borrow, albeit a modest £600 million, in 2019–20, before reaching absolute surplus in 2020–21. Given the uncertainties around the outlook, such sums do not warrant too much focus; as a per cent of GDP, the public finances are in balance. However, it does highlight the inflexibility of the new Fiscal Mandate. Were the OBR to present this projection to the Chancellor in the run-up to any future fiscal statement, he would be left with little choice but to announce a tightening of policy, even though an absolute surplus would be achieved in the subsequent year.
Monetary conditions
We have moved our central projection for Bank Rate back so that it now remains at ½ per cent until August 2016.Footnote 1 By the end of this year Bank Rate is expected to reach 1 per cent and over the medium term it rises gradually to 1½ per cent by the end of 2017 and just 2¾ per cent by the end of 2020. From November 2016 onwards, this is a near identical path for Bank Rate to what we had assumed in our forecast published three months ago.
The change in the first rate rise, from February to August 2016, has been motivated by a number of factors, not least a recent series of speeches by members of the MPC, see for instance Reference ShafikShafik (2015a), Reference VliegheVlieghe (2016) and Reference CarneyCarney (2016). While the central outlook for the economy appears little changed compared to three months ago, there has been an increased focus on the risks around it, with sentiment becoming more cautious following volatility in financial markets and also a number of UK data releases that disappointed relative to market expectations. The MPC's more recent communication would seem to be driven more by this uncertainty than a fundamental shift in its modal view.
Market expectations for Bank Rate derived from the forward OIS curve have fallen back even further since November 2015 and now price in a first interest rate rise in early 2018 (figure 6). As discussed by Reference ShafikShafik (2015b) there may be additional market features which mean these rates are not currently an accurate reflection of expectations, but at around 25 months ahead, this represents the most extreme market view on the distance from the turning point in the monetary policy cycle to date. Survey measures of expectations place the turning point closer to our own view (see for instance Financial Times, 2016a).

Figure 5. Unemployment rate fan chart (per cent of labour force)

Figure 6. Interest rate expectations
As we illustrated with simulations in November's Review, the decision to push back the timing of the first interest rate rise has little material effect on our forecast for GDP growth or inflation. The key is rather that the subsequent pace of tightening remains slow and gradual (see also the OECD, 2015, for a similar exercise on the US economy). However, there remain a number of factors which indicate that commencing with interest rate rises soon would not be inconsistent with meeting the MPC's remit over the medium term.
According to the Bank of England's November 2015 Inflation Report, the spare capacity in the economy is likely to have been fully absorbed sometime in 2016. Given a forecast for GDP growth at or marginally in excess of that of potential output over the next couple of years, and inflation expected to be close to 2 per cent at the 2-year horizon, this would be consistent with a real interest rate currently equal to the natural rate.Footnote 2 The implication would then seem to be that the natural rate is currently close to zero. But, as the inflation rate accelerates, were policy to remain unchanged, this would represent a lowering of the real interest rate. Implicitly what the MPC is then advocating is an endogenous loosening of policy, or that the natural rate itself will fall over the forecast horizon. Crucially, even if the policy rate were to rise, if inflation were to rise by more, then the stance of policy would, in fact, be looser.
Box A. Key forecast developments since November 2015
by Simon Kirby and Jack Meaning
Since the publication of our previous forecast in November 2015's Review a number of the variables at the heart of our forecast have undergone notable shifts which have potentially significant consequences for inflation and output.
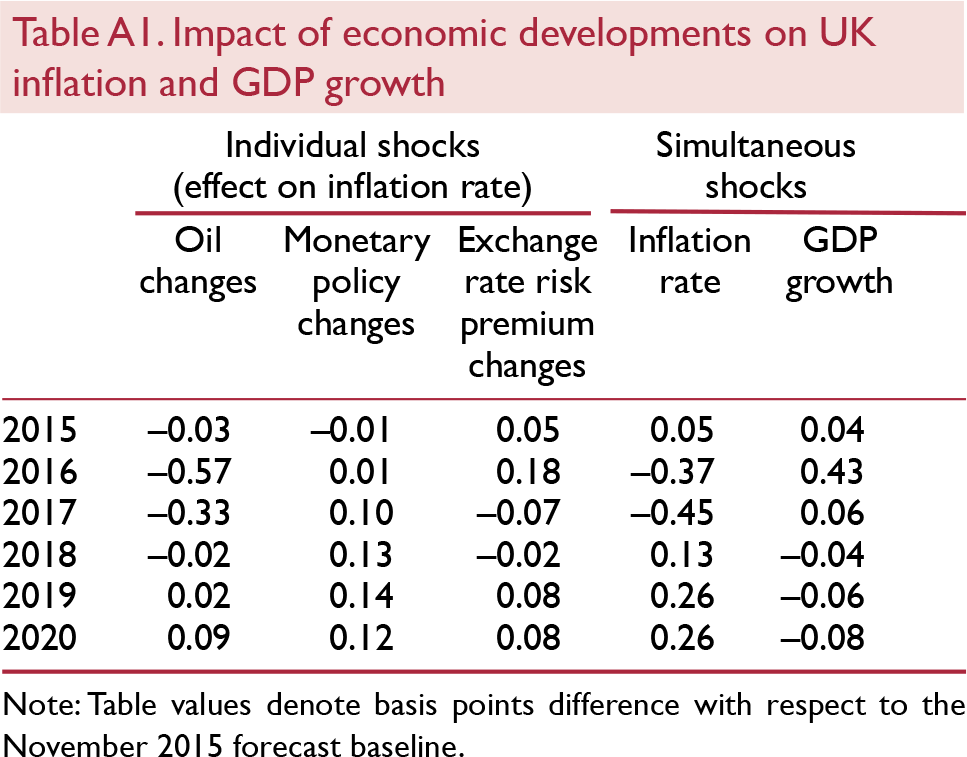
Dollar oil prices have fallen by more than 15 per cent since the start of the year and are forecast to be over 35 per cent lower this year than previously was the case. However, in 2017 they are now projected to increase more sharply. To quantify the impact of this change, we impose the updated path for oil prices on to the November forecast baseline in our in-house model, NiGEM. The resultant shock can then be traced through all variables in the model.
The first column of Table 1 shows that oil price developments since November have lowered the average rate of consumer price inflation in 2016 by almost 60 basis points and 30 basis points in 2017. By 2018 the impact is zero, and from 2019 onwards inflation is actually higher than the counterfactual.
Monetary policy expectations are another key determinant of our forecast and since November we have seen shifts in expectations across the UK and her two major trading partners; the United States and the Euro Area. As with the oil price shock, we can impose the new expected paths for policy rates in these three economies on to our previous baseline to see what the shifts imply for inflation. Table 1 shows little impact this year as markets’ expectations of policy in the near term were already extremely flat. From 2017 onwards though, the looser view of policy in the UK relative to the other two economies adds 10–14 basis points to the average inflation rate.
The third factor we analyse is the opening up of a risk premium on sterling, possibly due to uncertainty surrounding the impending referendum on the UK's membership of the European Union. By matching the observed exchange rate movements over the last 3 months to those the uncovered interest rate parity condition in our model would predict given economic fundamentals, we can isolate the unexplained element of sterling's recent depreciation. We then use this to calibrate a shock to the nominal sterling exchange rate. This widens the risk premium until the middle of 2016,Footnote 2 and then decays at a rate of 30 per cent per quarter from the third quarter of 2016 onwards. The outcome is a depreciation of the sterling effective exchange rate of around 2½ per cent on impact. This generates additional inflationary pressure in 2016, raising consumer price inflation by an average of 0.2 percentage point, the implied pass-through multiplier being −0.08 in this case.Footnote 1
Combining the shocks
Looked at in isolation, these shocks, whilst interesting, provide only a partial picture of the implications for the rate of consumer price inflation. In reality these factors will interact through the numerous transmission mechanisms within the economy, which we try and capture within NiGEM. Therefore we run a final simulation in which all three sets of shocks are applied simultaneously. The results for inflation can be seen in the final columns of Table A1 and in Figure A1.

Figure A1. Impact of economic developments since November on UK inflation and output growth
What we see is that the defining developments in the last 3 months combine, all else equal, to lower consumer price inflation by around 40 basis points this year. This intensifies to 50 basis points in 2017 as oil prices changes continue to feed through. It is noteworthy that the combined effect is less severe in 2016 than the isolated oil price shock as the depreciation of sterling and looser monetary policy offset the dollar oil price revisions.
In 2018 the implication is that, again all else equal, inflation should be marginally higher than we forecast back in November. This is of particular importance when thinking about the appropriate setting of monetary policy, which is concerned with inflation at around the two-year horizon. This exercise suggests that, over the past three months, little has changed for the inflation outlook 2 years ahead, and the extent to which it has, it has added inflationary pressure to what was already forecast to be a mild overshoot of the 2 per cent inflation target.
Looking at GDP, the simulation suggests a significant upward revision to the near-term outlook for GDP growth. The growth rate is boosted by around 45 basis points in 2016 and 10 basis points in 2017. This acceleration is unsurprising as, unlike with inflation, where some factors were acting as offsets to others, in this case all factors are working in the same direction. Weaker sterling boosts the competitiveness of UK exporters, lower oil prices reduce production costs and boost consumer purchasing power and looser policy expectations decrease the interest burden on debtors and spur investment. The intertemporal substitution inherent in some of these actions leads to a minor weakening of growth from 2018 onwards, but it should be noted that the level of GDP is permanently higher in this simulation.
It is likely that this represents an upper bound on estimates of the output gain from recent macroeconomic developments as we do not take account for the negative influence on investment and consumption that might occur as a result of the EU referendum, and which drives the risk premium shock on the exchange rate. Additionally, equity price falls will depress consumer spending through a negative wealth effect. This would be more pronounced if we were to assume that this also changed economic agents’ expectations about the future. In the absence of such an effect, the impact from the fall in equity prices is expected to be fleeting. However, it does still serve to highlight that, although a number of risks have increased in prominence, the last 3 months have not been a period of consequential downgrading for the prospects for the UK economy.
Note
1 See Reference Kirby and MeaningKirby and Meaning (2014) for more on the sensitivity of short and medium term exchange rate pass-through and the associated multipliers, to the nature of the shock to exchange rates in NiGEM.
2 At the time of writing this is when it is most widely believed the referendum will take place.
Many MPC members have commented on their desire to see sustained wage growth before they feel secure enough in moving policy. However, real average weekly earnings are growing at 2 per cent. Accounting for very weak near-term inflation expectations, nominal wage settlements of around 2 per cent seem consistent with the forward-looking decision making process in a tightening labour market. Thus, one would expect nominal wages to begin to rise with inflation as temporary factors weigh down on the headline figure less, generating additional inflationary pressure. Inflation expectations at the two-year horizon have dropped by less than shorter-term variants, indicating the MPC's commitment to 2 per cent inflation two years ahead is seen as credible.
A key indicator of the underlying inflationary pressure is core inflation. This has accelerated in recent months from 0.8 per cent in June to 1.4 per cent in December, equal to the average between January 2001 and January 2008.
Given this outlook, it would seem implausible that Bank Rate should stay at its current level for a further 25 months, as such a course of action would push up on inflation and increase the risk of the MPC overshooting its mandated target (figure 7).

Figure 7. The impact on our inflation forecast of delaying the timing of monetary tightening until March 2018, as per current market expectations
The argument for delaying monetary tightening hangs predominantly on heightened uncertainty. It is evident that there exist a number of large downside risks to the economic outlook, and were one or more of these to materialise then the ability of policy to respond effectively may be limited. In this sense the decision of the MPC to “wait and see” rather than begin tightening is justified. The balancing act facing the committee members is how much they can let underlying inflationary pressure build in order to give themselves time to see how these risks play out, especially given the transmission lags inherent once tightening begins.
Once they have delayed beyond the first quarter of 2016, the picture is complicated by the timing of the UK's referendum on membership of the European Union.Footnote 3 The large uncertainty around even near-term forecasts given the wide range of possible outcomes should be more than enough to stay the hand of the MPC until the result is known. Hence our updated view that rates will not rise until the second half of 2016. The possibility that the referendum is held later, or that the result is detrimental to the UK's economic performance in the medium term, represent significant downside risks to our forecast.
An often overlooked risk is that the MPC's caution and hesitancy serves to ‘talk down’ markets and the economy more broadly, leading to a self-fulfilling dynamic which ultimately validates holding rates lower. Such causality would be almost impossible to disentangle from other factors, but the point highlights the complex and endogenous nature of modern policy communication.
The Bank of England's other monetary policy instrument, the Asset Purchase Facility, continues to be held at £375bn. This represents a reduction in the publicly available supply of UK government securities of around 25 per cent. The MPC's clarification in November that it does not envisage unwinding the APF until Bank Rate has reached roughly 2 per cent implies on our forecast that they will not begin to reduce the size of their balance sheet until at least the second quarter of 2019. Over this period some £110bn of gilts on the Bank of England's balance sheet will mature, requiring them to re-invest the principal received, along with additional funds, and purchase new gilts.Footnote 4 This represents a sizeable ongoing intervention in UK government debt markets. In fact, the current Parliament would withdraw a sum equal to more than 75 per cent of the £197bn of gilts the Debt Management Office expects to issue, reducing the net issuance to the private sector considerably, figure 8.

Figure 8. Planned gilt issuance by the DMO compared to re-investment purchases by the APF
Prices and earnings
Twelve-month consumer price inflation has remained weak in the past three months, reaching just 0.2 per cent in December following rates of 0.1 per cent in November and −0.1 in October. The outlook has been further complicated by the renewed falls in global commodity prices, movements in sterling and increasing uncertainty around prospects for world output and trade growth. The recent external developments are behind much of the downward revision to our inflation forecast for 2016. We expect the rate of CPI inflation to reach only 0.3 per cent, rising to just 1.3 per cent in 2017. Further out, the rate of inflation is expected to be marginally above target as temporary disinflationary effects dissipate.
Dollar oil prices have fallen significantly since the start of the year with Brent crude dropping below $30 a barrel. The latest price projections from the Energy Information Administration, which form the basis of our own forecast, show oil prices falling by almost 30 per cent this year, compared to an 8 per cent increase underpinning the forecast published in November 2015.Footnote 5 However, the profile for 2017 is for a more aggressive snap back in prices than was previously expected, with a 25 per cent rather than 3 per cent rise, although the net effect is a permanently lower level of the oil price than we had factored into our last forecast (figure 10).

Figure 9. CPI inflation rate fan chart (per cent per annum)

Figure 10. Change in the projected oil price profile
As a consequence, the inflationary effect stemming from recovering oil prices is delayed, weighing down more on consumer prices this year and in the first half of 2017, but contributing more in the second half of 2017 and through 2018.
In foreign exchange markets, sterling depreciated against a trade-weighted basket of currencies by roughly ½ per cent in the final quarter of 2015 and is expected to fall by approximately 3 per cent more in the first quarter of 2016. This leaves the effective exchange rate lower than in our November forecast as diverging monetary policy paths and building uncertainty around the UK's referendum on exiting the European Union weigh on the attractiveness of the currency.
Sterling is forecast to fall 5.5 per cent against the dollar this year compared to a modest appreciation in our last baseline. This has the consequence of offsetting some of the disinflationary impact of recent oil price moves, as in sterling terms they have moved by less than the dollar price would suggest (figure 11). Against the euro, sterling is expected to fall 3½ per cent this year as expectations of monetary tightening in the UK fall back by more than markets’ views on ECB loosening. The ECB's December move widely disappointed markets, undoing some of the depreciation that had been built in prior to the policy announcement. However, recent communications have suggested that further loosening may be imminent and markets have begun to price this back in. Were this to materialise it would lessen the forecast depreciation of sterling and remove some inflationary impetus in our baseline at around the 18-month horizon.

Figure 11. US dollar and sterling oil price developments
Abstracting from the effects of oil prices, core inflation, which excludes energy and other volatile components such as alcohol and tobacco, has strengthened, rising from 0.8 per cent in the middle of 2015 to 1.4 per cent in December. This most recent outturn was boosted by a large increase in air fares, but even without that, core price growth since October 2015 has averaged the same as it did through the 2001–7 period when the economy was in the upswing of the economic cycle. This suggests that underlying inflationary pressure remains strong. A risk to our forecast is that this underlying pressure builds, masked in the headline number by temporary factors, and policy fails to respond appropriately so that when the temporary factors wash out, inflation accelerates more aggressively than on our current baseline.
The picture for earnings has become more uncertain in recent months. On the one hand, nominal earnings growth, as measured by the ONS’ regular average weekly earnings series, has fallen back slightly to 2.1 per cent in November from 2.9 per cent in July 2015.Footnote 6 However, with a lowering of one year ahead inflation expectations in recent months, this does not necessarily indicate a lessening of wage pressure. Real average weekly earnings grew 2 per cent in the year to November, and adjusting current wage growth for our one-year ahead inflation forecast shows a much more modest fall in the final quarter of 2015 than the nominal data would suggest. Looking at 2-year inflation expectations, they have fallen by much less and so we expect nominal wage growth to pick up over that horizon as workers and firms negotiate nominal contracts based on these higher expected inflation values. We think it is likely that the recent softening is due to a combination of this changing expectations effect and simple volatility in earnings data, with average earnings growth forecast to pick up to 2.3 per cent in 2016. Should this judgement prove wrong, and the softening prove more persistent, or even to be a retrenchment of earnings growth, then this would have significantly disinflationary consequences for our current forecast.
The nexus of earnings and price developments is the unit labour cost; the labour portion of the cost of producing one unit of output. If wages increase faster than the productivity of workers then the labour input for a given level of output becomes more expensive. This either hits the profitability of firms as they reduce their margins to absorb the additional cost, or is passed on to consumers via higher prices, stoking inflation. Weak productivity growth has seen unit labour cost growth picking up since early 2014, even with relatively anaemic wage growth. In the third quarter of 2015 unit labour costs increased by 2 per cent compared with twelve months earlier. At the heart of our forecast is a view that productivity growth returns at a pace marginally below that of nominal wages so that unit labour cost growth moderates but continues to exert inflationary pressure over the medium term.
Components of demand
Recent revisions to the components of GDP left the 2014 annual average unchanged, but led to a reduction in the rate of growth in the second and third quarters of 2015, largely due to changes to the pattern of consumer spending through the year. The ONS’ preliminary estimate for the final quarter of 2015 gives a rate of growth of 0.5 per cent per quarter (figure 12), broadly consistent with our previous forecast, published in the November 2015 Review. Nonetheless, the revisions to estimates earlier within 2015 mean the 2.2 per cent growth outturn for 2015 is slightly lower than we had previously expected (figure 2).

Figure 12. Real GDP growth (per cent per quarter)
Domestic demand is expected to be the primary driver of economic growth over this year and next. Consumption and investment are expected to contribute 2.3 and 1.0 percentage points towards overall growth in 2016, respectively. As we note in the Household Sector section of this chapter, the purchasing power of households improved throughout the course of last year due to a temporary fall in the rate of consumer price inflation. These temporary factors (energy price movements in particular) will continue to weigh on the rate of inflation this year, allowing household real disposable incomes to rise, even though nominal wage growth is only expected to be marginally above 2 per cent per annum. We have left our forecast for 2016 unchanged at 2.3 per cent and revised up marginally to 2.7 per cent per annum next year from 2.6.
The most significant change to our forecast for the domestic sector is as a result of November's Autumn Statement/Comprehensive Spending Review where it was announced that the government would be increasing total managed expenditure across the five years to £4tn, up from £3.85tn from the Summer Budget. This implies a faster expansion of government consumption in real terms, which we now expect to grow by an average of 0.4 per cent per annum for 2016 to 2019, compared with 0.3 per cent from the Summer Budget. However, the overall contribution to growth remains historically small, adding just 0.1 percentage point to GDP between 2016 and 2019, compared with an average contribution of 0.6 percentage points in the pre-crisis years 1998 to 2007.
The external sector has continued to subtract from GDP throughout 2015 with growth in the volume of imports continuing to outpace those of exports. Exports accelerated in the final quarter of 2014 and robust growth continued throughout 2015; in the third quarter exports grew 6.4 per cent on a year-on-year basis. We estimate the final quarter to be somewhat softer with growth of 2.7 per cent year-on-year, due to weaker growth in goods exports, especially to EU countries. This weakness is the reverse of the recent trend which has seen a pickup in goods exports. However, we expect that the forecast softening in the fourth quarter will persist through this year and we have therefore revised down our expectation of the contribution of exports to overall GDP growth for 2016 to 1.2 percentage points from 1.8. This in turn moderates the negative contribution from imports to 2.2 percentage points, down from 3.2, and implies that net trade will subtract 1 percentage point from GDP in 2016.
The trade balance widened further in the third quarter of 2015 to 1.9 per cent of GDP from 1 per cent in the previous quarter. To indicate the general trend of the trade balance, which is a notoriously volatile series, figure 14 shows the moving average of the quarterly value. From the late 1990s there was deterioration in the trade balance from surplus to deficit, which reached its nadir in 2008. From then onwards the trade deficit began to shrink. And the general trend since 2011 has been stability at around pre-crisis levels. From the late 1990s the UK saw the proportion of the value of oil within total imports increase from around 2 per cent in 1998 to 10 per cent in 2012. Since the sharp decreases in oil prices which began at the end of 2014 and have recurred more recently, this share has reduced to 5 per cent, the lowest since the first quarter of 2005. As the UK is a net importer of oil this should help to reduce the trade deficit all else equal although it is likely to be partially offset by the depreciation of sterling against the dollar. We expect the trade deficit to reach 3.3 and 3.7 as a percentage of GDP in 2016 and 2017 respectively.

Figure 13. The evolution of government consumption plans

Figure 14. Trade balance
Since 2013, the UK real effective exchange rate has appreciated by 15 per cent, which may have reduced the price competitiveness of UK firms and added downward pressure to export volumes. However, this is far from the whole story. Figure 15 plots the difference between the effective exchange rate and the relative price of UK exports compared to her competitors. It shows that the onset of the global financial crisis led to a depreciation of around 25 per cent between 2007 and 2009. Less than half of this was passed through to relative price competitiveness; slightly less than suggested by benchmark estimates from IMF (2015), who find that around 60 per cent of real effective exchange rate movements are passed through to export prices in the first year, falling to around half in the long run. One cause of this result could be that exporters took advantage of the depreciation to build up their margins, especially given the large economic uncertainty associated with that period. As sterling has regained some of the ground it lost in 2007–9, the reverse looks to have happened and firms have been able to reduce their expanded margins, insulating them to some extent from the competitiveness loss a strengthening pound would have inflicted otherwise. It should be noted that sterling remains around 10 per cent below its pre-depreciation level and many of the UK's current exporting firms existed and operated profitably at that price for sterling.

Figure 15. Real effective exchange rate and price competitiveness
Household sector
Despite a weaker data outturn for the third quarter of 2015 than we had pencilled in three months ago, real personal disposable income of UK households (real income henceforth) is projected to grow at 3.3 per cent, the fastest rate since 2001. As figure 16 shows, the pick-up in growth has been fuelled by a moderation in the rate of consumer price inflation, due to a fall in oil prices, and by higher growth rate in nominal incomes, explained by strong employment growth – now back at pre-crisis growth rates – and a resumption of real wage growth, which had been declining since 2010. This year, we expect real income growth to moderate slightly, despite the renewed fall in oil prices,Footnote 7 as labour market slack dissipates and the recent sterling depreciation decreases the purchasing power of UK households. From 2017 onwards we expect real income to grow at around 2¼ per cent as consumer price inflation gradually returns to the Bank of England's target of 2 per cent. Together with our population projections, our forecast implies real per capita income growth of 1¾ per cent between 2017 and 2021.

Figure 16. Contributions to growth in real income (in percentage points)
According to our preferred measure of house prices, a seasonally adjusted version of the ONS mix-adjusted index, house price inflation has recently picked up, with annual growth rates of 7 and 7.7 per cent in October and November of last year up from a 16-month low of 5.5 per cent in July 2015. The Halifax and Nationwide house price indices, which act as leading indicators for the ONS measure as they are derived earlier in the house purchase process, provide a similar picture: in the twelve months to December, house prices increased by 4.5 per cent according to Nationwide, up from a two-year low of 3.2 per cent in August 2015, and by 10 per cent according to Halifax, up from 8.5 per cent in September 2015.
We expect house prices to accelerate in the coming months as demand is brought forward in response to the announcement in November 2015's Autumn Statement that stamp duty tax rates for buy-to-let property will increase in April 2016. From 2017 onwards we expect a moderation in house price inflation as demand becomes more subdued following increases in Bank Rate. The underlying assumption in our forecast is that there will not be any drastic changes in supply. This view is supported by various measures such as the average house stock per surveyor, reported by RICS, which has been declining since April 2015 and hit in December a 37-year low of 44½, down from its peak of 196 in 1990.
Despite the recent pickup in house price inflation over the past two years, activity in the housing market remains subdued from a historical perspective. Data on mortgage approvals from the November 2015 Money and Credit report produced by the Bank of England shows that we stand at around one third of activity when compared to the 2002–7 period. After reaching a two-decade low of 90,000 in June 2012, approvals have been gradually increasing to around 120,000 in August 2015 and stayed around this level throughout the remainder of that year. Given the likely increases in Bank Rate this year and the introduction of the new stamp duty tax, we maintain a view of subdued activity, which limits the potential for credit growth of UK households. In fact, while recently gross mortgages to households have increased at a faster rate than increases in capital repayments, the gap between the two flows remains small from a historical perspective (figure 17).

Figure 17. Monthly mortgage loans and capital repayments (£billion)
Households’ debt-to-income ratio has remained stable at around 141 per cent since the second half of 2013 after a period of deleveraging that brought down the ratio from a peak of almost 170 per cent in early 2008. Despite the deleveraging process, the UK's household debt-to-income ratio is second only to Canada within the G-7 group of countries.
High levels of indebtedness pose a risk. Sudden increases in interest rates can weigh on consumption decisions of households as income gearing – the share of income diverted to interest repayments – rises. Income gearing has been historically low thanks to low Bank Rate (see figure A5 in the appendix). Although income gearing is bound to rise, our view is that the risk this poses via weaker than expected consumption growth or households resorting to debt restructuring, is contained as Bank Rate is expected to increase in a very gradual fashion. In addition, as a recent survey commissioned by the Bank of England (Reference Bunn, Drapper, Rowe and ShahBunn et al., 2015) shows, the balance sheet position of UK families has been improving over the past few years: the share of individuals that should take actionFootnote 8 in case of a sudden rise in Bank Rate of 2 percentage points has decreased over the past two years from 44 to 31 per cent. We expect household indebtedness to remain stable at the current level given the moderate pace of credit expansion and the pick-up in nominal income growth.
As has generally been the case for the past two years, private consumption was strong, with a quarter on quarter growth rate of 0.8 per cent in the third quarter of 2015. Consumption growth has been supported by the pickup in real incomes, wealth effects stemming from house price inflation and the appreciation of sterling which increases the purchasing power of UK households. Data on retail sales until December 2015, which constitute a timely monthly indicator of consumer spending and represents around a third of the total, increased 1.1 per cent during the fourth quarter of last year, a rate of growth very similar to the previous three quarters, suggesting that consumer spending will remain strong in the current quarter. We expect consumer spending to peak in 2016 and to moderate thereafter, as house price inflation moderates, consumer price inflation returns to the Bank of England target of 2 per cent and income gearing increases following the tightening of Bank Rate.
The saving ratio, that which includes the adjustment for changes in net equity of households in pension funds, has reached a historical low of 4.4 per cent on the third quarter of 2015. Although the adjustment has been making negative contributions to the saving rate of households for the past year, perhaps unsurprisingly given the recent turmoil in equity markets, it is dwarfed by the negative contribution coming from the rise in consumption expenditure of households. In addition, it does not appear that households are running down assets given that net financial wealth in 2015 (given data up to the third quarter) has registered the highest growth rate since 2010. Our view is that the recent favourable dynamics of the labour market, with unemployment rate close to equilibrium, has spurred consumers to implement consumption plans that might otherwise have been delayed. In addition, given the expectation of a Bank Rate rise this year, there is an incentive to delay saving and bring consumption forward.
Supply conditions
The working age population employment rate reached a record high of 74.2 per cent in the three months to November 2015 with the level of employment of those aged 65 and over showing a particularly large increase of 7.3 per cent in the year ending November 2015. Unemployment fell to 5.1 per cent in the three months to November 2015, its lowest level since 2005. Labour market participation and average hours worked are approaching their equilibrium levels and rising wages are a further indicator of a tightening labour market. Real producer hourly wages increased by 2.7 per cent in the third quarter of 2015 compared to the same quarter one year earlier.
However, all is not well in the UK labour market. Signs of underemployment persist. The Bell-Blanchflower underemployment indexFootnote 9 measures the excess supply of hours in the economy. It sums the hours that the unemployed would work if they could find a job and the change in hours that those already in work would prefer. This is then expressed as a percentage of the sum of hours worked and surplus hours to give the underemployment rate. Although this measure has declined in recent years, it remains about 0.9 percentage point above the 2007 average. This is partly related to the proportion of part-time workers who say they would like but are unable to find a full-time job, which fell to 15 per cent in November 2015, down from a peak of 18.5 per cent in 2015. This is still much higher than the average of the ten years to 2007 of 9.1 (figures 18 and 19).
The self-employed tend to be less productive than employees due to reduced access to capital. High levels of self-employment may be an indicator of spare capacity if there are many temporarily self-employed workers who are seeking jobs in firms, thus it is important to differentiate cyclical changes from long-term trends. Self-employment as a proportion of total employment has been growing since the onset of the recession and is currently around 15 per cent, compared to 13.1 per cent in 2007, although the proportion has fallen slightly in the past eighteen months. The increase in self-employment since 2008 mostly reflects longer-term trends such as an ageing workforce and technological changes, however it is likely to be in part a response to the recession. Reference TatomirTatomir (2015) reports that growth in self-employment accounted for around a third of the 1.9 million increase in the number of workers in employment since 2010, much of which occurred during periods of subdued economic growth. In the third quarter of 2015, the number of employees increased by 1.7 per cent compared to the same quarter one year earlier, while the number of self-employed increased by only 0.8 per cent over the same period.
Population growth is expected to continue to boost labour supply as the UK population is projected to increase by 9.7 million over the next 25 years. These figures have been revised upwards compared to the 2012-based projections due to assumed longer life expectancies and higher rates of net international migration. Fifty-one per cent of the increase is due to net migration, with the remaining 49 per cent due to the birth rate exceeding the death rate. The effect on the size of the labour force will be partially offset by the continued ageing of the population, with the average age projected to rise from 40 in 2014 to 42.9 in 2039. Overall, our forecast is for the UK labour force to grow by around 0.7 per cent per year, on average, between 2016 and 2022.
Business investment volumes remain buoyant, rising by 5.8 per cent year-on-year in the third quarter of 2015 compared with an average growth rate of 4.9 per cent per year in the five years since its recent trough of −16.1 per cent. Data from the Deloitte CFO Survey for the fourth quarter of 2015 show that new credit for corporates has been increasing in availability and decreasing in cost since 2009 with 86 per cent of respondents reporting finding credit fairly or very cheap and 78 per cent of respondents finding credit somewhat or easily available in the final quarter of 2015. According to the Bank of England's Credit Conditions Survey 2015Q4, the availability of credit to the corporate sector was unchanged in the quarter and the credit environment remains relatively benign.
Methodological changes by the ONS to the estimation of capital stocks and consumption of fixed capital have resulted in small level increases in the capital stock data, while growth rates remain broadly similar, see ONS (2015) for further details. Our forecast for the growth rate of capital stock has been revised downwards since our November Review due to an increase in the rate of capital consumption. This rate decreased significantly in 2008 reflecting an increase in the average life of assets. As the economy has picked up it seems that assets are being replaced sooner, resulting in increased consumption of fixed capital. As a corollary, our business investment forecast has been revised upwards but not enough to offset this increased consumption. Our forecast is for capital stock growth of 1.9 per cent this year and then 2.3 per cent per year on average between 2017 and 2022.
The capital-labour ratio increased sharply at the onset of the crisis as firms reduced the size of their workforces. As capital stock depreciation exceeded investment, this ratio flattened before falling between 2011 and 2014. This is consistent with the hypothesis that firms were hoarding labour while wages were low instead of increasing their capital stocks, thus limiting productivity growth. The apparent recent tightening in the labour market seems to coincide with an increase in the capital–labour ratio, back to the pre-recession trend, which we expect to continue over the next few years (figure 20).

Figure 18. Unemployment and underemployment rates (seasonally adjusted)

Figure 19. Proportion of part-time workers who were unable to find a full-time job

Figure 20. Capital-output and capital-labour ratios
Public finances
The Autumn Statement 2015 introduced a significant increase in discretionary taxation to boost revenues over the forecast period. From 2017–18 to 2020–21 the OBR estimates tax policy changes will boost revenues by close to £5 billion a year, nearly half of which is expected to be generated by the apprenticeship levy, a payroll tax imposed on firms with wage bills over £3 million. Over the same period, nominal government consumption plans have been increased by £6.5 billion, £9.3 billion and £8.3 billion in 2017–18, 2018–19 and 2019–20, respectively. Capital and welfare spending have also been increased by significant amounts over the forecast period. The government has been able to introduce this fiscal loosening without exposing itself to a less than even chance of hitting its primary fiscal target through forecasting changes made by the OBR.
The OBR has a ‘bottom-up’ approach to its forecasts for tax revenues, relying on the inputs from models maintained and run by government departments. Since the Summer Budget, OBR staff have identified a number of errors in the models and assumptions used by HMRC to project future revenues. Overall, correcting these assumptions boosts projected revenues by £4.2 billion in 2016–17, rising to £9 billion by 2020–21. By 2020–21, the changes to revenue modelling and assumptions are expected to generate nearly twice the revenues from the discretionary tax policy changes announced by the Chancellor.
The OBR uses market expectations of the future path of Bank Rate to inform its forecast for interest rates over the forecast period, and the point at which the Bank of England starts to allow its balance sheet to shrink. With the yield curve flattening quite significantly since the Summer Budget, the path for interest rates underpinning the OBR forecast was lowered, and the point at which the Bank of England allows its holdings of maturing gilts to ‘roll-off’ was pushed back. This lowers government interest payments by between £4 and £5 billion per annum, half of which is through higher payments from the APF to HM Treasury as the APF remains at £375 billion, funded at Bank Rate for the whole of the forecast period.
These two sets of forecast changes allow the government to increase discretionary tax policy only marginally, but government spending substantially, without the OBR concluding that the government is no longer expected to hit the primary target of its Fiscal Mandate. We have noted in a number of previous forecasts that the government's fiscal consolidation plan for this parliamentary term was unnecessarily tight given its fiscal ambitions and that the spending plans of the previous coalition government would be difficult to achieve. The government would appear to have used the recent forecasting adjustments to address this issue.
This is not to say spending cuts are not planned for the rest of this parliamentary term. In volume terms government consumption is not expected to keep pace with population growth, suggesting reductions in the volume of per capita spending, while government investment as a per cent of GDP, though planned to rise, increases only modestly from a low level.
We build these spending assumptions into our forecast and then allow the components of expenditure, most notably social transfers to households and government interest payments to be endogenously determined by the model. With our assumption for the first increase in Bank Rate pushed back to the third quarter of 2016, the profile for government interest payments, has eased, but only by around £1 billion per annum.
Tax revenues in our global econometric model, NiGEM, are endogenously determined by the speed and composition of nominal demand growth. We introduce any discretionary policy change as an adjustment to the appropriate effective tax rate. As such the tax policy, but not tax modelling changes, are factored into our fiscal forecasts.
The minor weakening in the fiscal outlook is due to a combination of the higher government consumption planned and a weaker outlook for nominal demand, given, mainly external, disinflationary forces. We expect public sector net borrowing to ease from £90.5 billion (4.9 per cent of GDP) in 2014–15 to £61½ billion in 2016–17 (3.2 per cent of GDP). By 2019–20, the public sector is expected to borrow less than £1 billion, rather than be in an absolute surplus, as dictated by the current Fiscal Mandate. Such a modest amount of borrowing, compared to expected total managed expenditure of close to £800 billion, is well within the margins of forecast error. If this were to be the forecast presented by the OBR to the Chancellor, it would, in all likelihood, induce a modest policy change to ensure the target is projected to be met. With the absolute surplus achieved the following year, announcing additional tightening, even if modest, is probably sub-optimal. However, it does help to highlight the inflexibility of the current fiscal rule.
With borrowing, as a per cent of GDP, below the growth rate of nominal demand from 2016–17 onwards, we expect public sector net debt as a per cent of GDP to decline in every fiscal year of the forecast. At present we expect a marginal increase in the year 2015–16, from 2014–15. This marginal increase has little economic meaning, and there is a reasonable chance 2015–16 will see net debt falling, as a per cent of GDP. But such a change has been made more difficult by the downward revisions to GDP growth last year, and, at the time of writing, the decision to postpone a sale of a tranche of Lloyds shares.
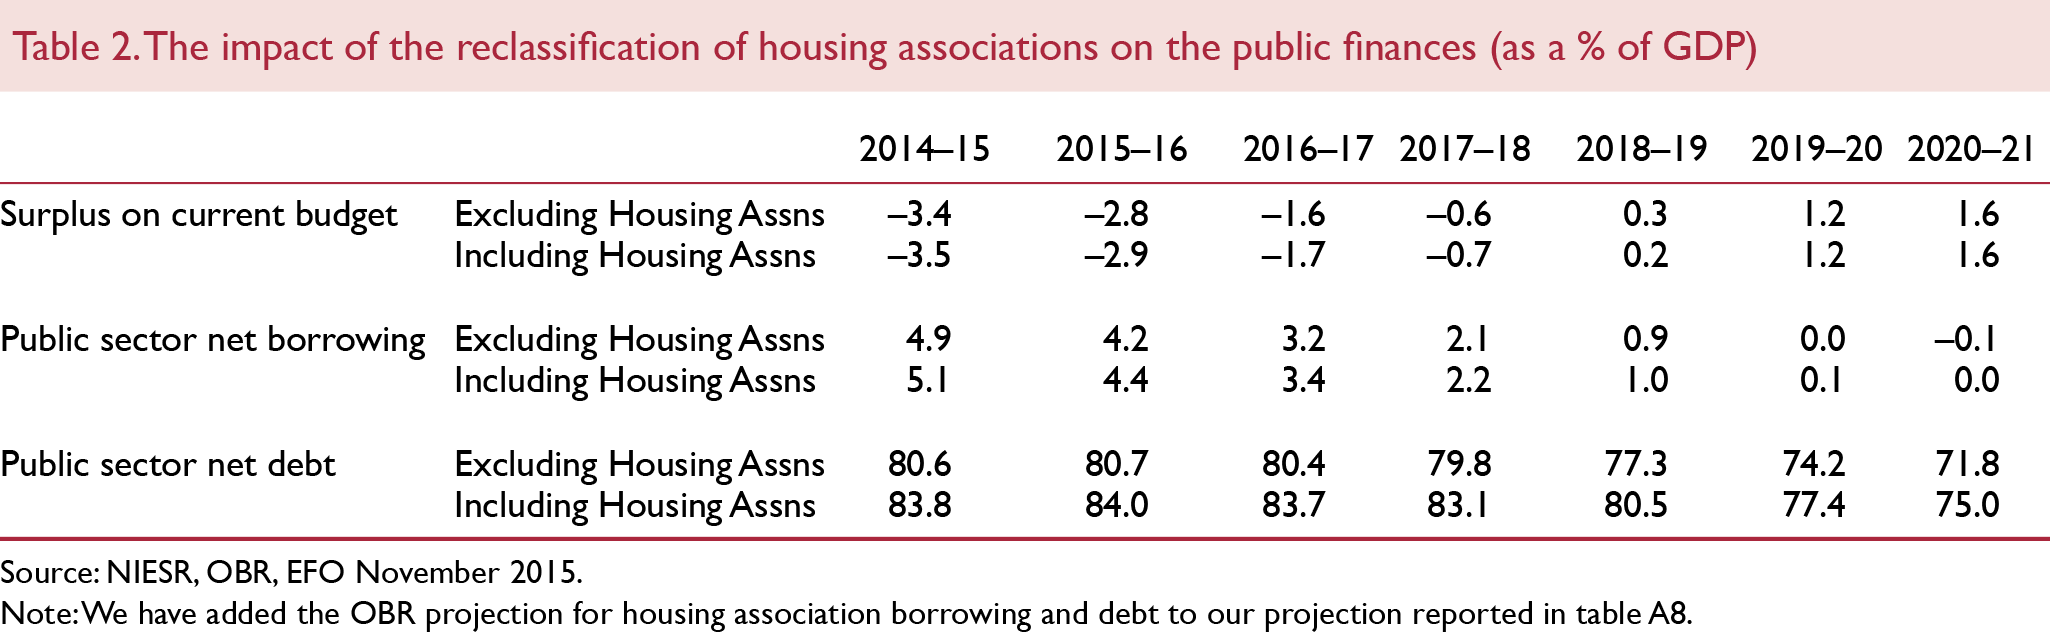
Interventions in the operation of housing associations announced in the Summer Budget caused a re-evaluation of their classification as private sector entities. The ONS concluded that the government's ability to intervene in their governance was enough to warrant a reclassification of housing associations to the public sector, at a stroke adding to both public sector net borrowing and debt stock. The forecasts presented here do not include the balance sheets and borrowing position of the housing association sector, since they have yet to be introduced to either the public sector finance statistics or the quarterly national accounts.
We use the recent forecasts of the OBR to provide an illustration of what the inclusion of housing associations might do to our forecast.Footnote 10Table 2 provides the historical data and forecasts for public sector borrowing and net debt, both as a per cent of GDP, including and excluding housing associations. The target of debt, falling as a per cent of GDP, is still expected to be met since the increased borrowing due to housing associations is modest. But modest increases in borrowing of around 0.1 per cent of GDP, still lower the probability of the government meeting the primary target of its Fiscal Mandate further.
A key part of the fiscal framework is the government's ability to issue debt via auctions conducted by the Debt Management Office. On 20th January 2016, one such auction was reported as being close to failure as it received bids only marginally in excess of the quantity being issued (see Financial Times, 2016b). However, looking at this particular auction in context, it would seem that fears that the DMO will regularly struggle to find demand for its auctions may be overstated. An 8-auction moving average of bid-cover ratios on gilt auctions shows that, whilst recent auctions have seen marginally less demand relative to supply than the historical average, bid-cover ratios remain robust and significantly distanced from unity, the point of failure (figure 21).

Figure 21. Gilt auction results: bid-cover and yield at average accepted price
It should also be noted that this has remained the case despite net gilt issuance reaching historically high levels over the period since 2008, implying a sizeable pickup in demand in absolute terms. What is more, this increased demand has been achieved with yields at average accepted prices well below historic averages.
Looking forward, as net gilt issuance diminishes, demand for safe securities is likely to persist and so we do not expect to see any sustained fall in bid-cover ratios which would impair the ability of the DMO to fulfil its obligations. This is not to say that no auction will fail in the future. Twice since the turn of the century gilt auctions have failed, both due to one-off and short-lived factors and neither having any significant repercussions.
They serve as reminders of the occasionally inexplicable and inconsequential volatility in financial markets. The most recent episode would appear to be another case in point.
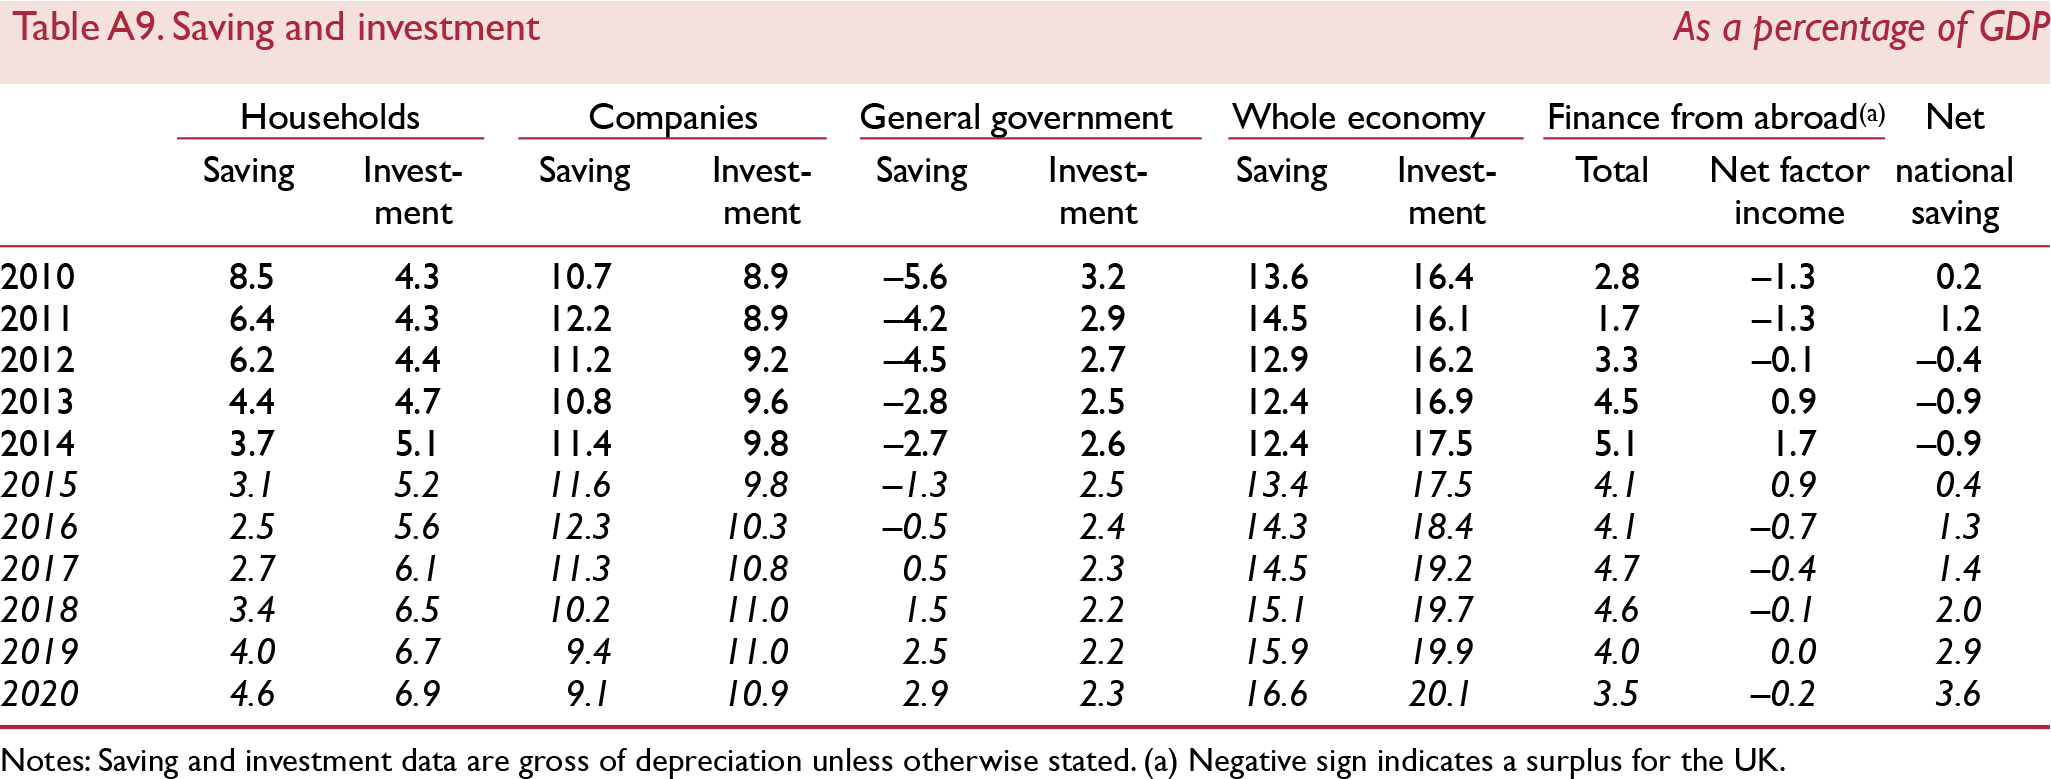
Saving and investment
In table A9 we decompose saving and investment positions for three broad sectors; household, corporate and government. For each of these sectors, if investment is greater than saving, then that sector is a net borrower and must finance the excess from the rest of the economy. The balance of payments on the current account is the summation of the net positions of these three sectors. Total capital formation greater than saving results in a deficit which must be externally financed. No optimality about the levels of investment and saving can be drawn from these sectoral figures or the position of the current account, rather just the immediate financing needs of the economy.
In the first quarter of 2008, immediately preceding the global financial crisis, household saving had reached its lowest level since 1964 of 3 per cent of GDP, after which it steadily increased and reached a peak of 8.8 per cent of GDP in the third quarter of 2010. Since then, as the economy has recovered, household saving has continued to fall, with the exception of a short period of retrenchment in the first three quarters of 2012 as a result of increased uncertainty surrounding spillovers from the sovereign debt crisis. In the third quarter of 2015 household saving fell to 3 per cent of GDP; we forecast that household saving will continue to decline in the near term, primarily due to a slight reduction in real consumer wage growth in comparison to our November forecast which reduces the growth of real personal disposable income in 2017 and 2018. We therefore predict that household saving will fall to an historic low of around 2½ per cent of GDP in 2016 and 2017. Increases in the average propensity to consume are expected to be only temporary, and in the long run consumer spending growth will moderate as households improve balance sheet positions that manifest as an increase in the saving ratio. By 2020 we expect that household saving will have reached 3.3 per cent of GDP, equivalent to the same proportion of GDP as in 2014.
Household investment for 2015 has remained broadly flat at 5.2 per cent of GDP when compared with 2014. Our profile remains unchanged from our November forecast with household investment increasing throughout our forecast period, and we expect that by 2020 it will be around 7 per cent of GDP. This implies that households will remain net borrowers from the rest of the economy, requiring the funding equivalent of between 3 and 3½ per cent of GDP in 2016 and 2017, respectively, to deliver these investments, given the magnitude of consumer spending we expect. Through to the end of our forecast period, the gap between saving and investment reduces gradually and by 2020 the household sector is expected to borrow 2 to 2½ per cent of GDP to fund its investment plans.
Since 2003, the corporate sector has been a net lender to the rest of the economy. Compared to our November forecast we now view that corporate net lending to the rest of the economy has increased to 1.8 per cent of GDP in 2015 compared with 1.3 per cent in our November forecast. This increase has primarily been driven by weaker investment, which is now expected to be 9.8 per cent of GDP as opposed to the 10.4 per cent forecast back in November, while corporate saving has remained broadly the same at 11.6 per cent of GDP. We expect for this year increases in both saving and investment; however, given the recent rise in the number of firms issuing profit warnings, especially amongst oil producers and retailers, we believe the proportion will be weighted towards saving. We forecast that the saving rate will peak at 12.3 per cent of GDP this year and subsequently fall gradually, while investment increases to just over 10 per cent and will steadily increase over our forecast period. This implies a widening of the net lending position to 2½ per cent of GDP in 2016, before excess saving reduces. We now expect the corporate sector to become a net borrower from the rest of the economy by 2019. By 2020 we forecast that the corporate sector will borrow between ¾ and 1 per cent of GDP from the rest of the economy.
Our fiscal policy forecasts for government consumption and investment are based on the spending envelopes and discretionary policy changes outlined in the Autumn Statement/Comprehensive Spending Review. The policy prescriptions in the Autumn Statement imply a looser path for fiscal policy than in the Summer Budget, primarily through increases in government consumption and investment funded through tax and welfare changes but imply an increase of £3.5bn in borrowing over the parliament. The new planned path of fiscal policy leaves government investment only marginally unchanged from our previous forecast of on average 2.3 per cent of GDP between 2016 and 2019, however government saving is lower throughout our forecast period. We expect government saving to be –½ and ½ per cent of GDP in 2016 and 2017, compared with −0.2 and 1 as a percentage of GDP from our November forecast. Given this we expect that the government will become a net lender to the rest of the economy by late 2019 rather than the middle of 2018 as we had previously suggested. By 2020 we expect the general government sector to lend around ½ per cent of GDP to the rest of the economy.
In 2015, 4.1 per cent of GDP was required to finance domestic investment plans from the rest of the world compared with the average for 1998–2007 of 1.9 per cent of GDP. The expected relative paths for the three sectors, imply that the economy will remain a net borrower from the rest of the world throughout our forecast period, requiring 4 per cent of GDP in 2016 which will increase to 4.7 per cent in 2017. After this, net borrowing will gradually reduce; by 2020 we predict that 3½ per cent of GDP will be required to finance investment plans.
In previous editions of the Review we have stressed that a key risk surrounding the current account is the recent sharp deterioration of the balance of the primary income account, and to what extent this is a temporary or permanent phenomenon. Reference LaneLane (2015) suggests this could be a consequence of financial engineering, where UK firms relocate their headquarters to a foreign country. If this hypothesis is correct, it poses less of a concern for the recent deterioration in the current account as it flags up the inability of the framework for balance of payment statistics to cope with how modern economies operate. After all, the redomiciling of a company's headquarters does not require a shift in economic activity across international boundaries. While, the underlying cause of this deterioration remains unclear, we assume that this is transitory, and that the balance of net factor incomes returns to surplus in 2016 of just over ½ per cent of GDP.
Medium term projections
Table A10 presents our projections for the medium term. This period will be dominated by the transition of the economy back towards its equilibrium. The current business cycle has been abnormally long. Reference Massmann and MitchellMassmann and Mitchell (2002) find the average length of a UK business cycle to be around 4–5 years since the post war period. Currently we find ourselves entering the 8th year after the most recent trough. It is therefore understandable that the assessment of the size of the current disequilibrium will differ between forecasters. In the November Inflation Report, the Bank of England suggested that spare capacity will be eliminated over the course of this year. Our view is that the negative output gap is larger and will take a number of years of above potential growth to close. The growth rates reported in table A10, therefore, do not represent our view of the potential growth rate of the economy; a rate that our estimates suggest is closer to 2 per cent per annum, on average.
We understand that the economy will not evolve exactly as we have forecast, shocks which are by nature unpredictable will move the economy away from our modal path. We chose to depict this uncertainty using fan charts. Figure 22 shows that there is a 10 per cent chance that GDP growth could be greater than 4 per cent by 2020 and a one in five chance that it could be less than 0.4 per cent.

Figure 22. GDP growth fan chart (per cent per annum)
A key assumption that underpins our economic projections is the return of meaningful productivity growth. This determines long-run growth in real consumer wages and therefore the associated improvements in living standard. We estimate whole economy productivity growth to average 1 per cent in 2015, up from 0.1 per cent in 2014, and then to increase slightly this year before growing at around 2 per cent per annum from 2017 onwards.
From 2012 to 2014 the labour input grew on average by 2.1 per cent on an annualised basis. This was driven by both increases in employment and hours supplied. We believe that 2014 represented the peak growth of the labour input and predict that it slowed to 1.1 per cent in 2015. We expect this declining trend to continue as unemployment approaches its long-run level of around 5½ per cent and the demand for hours stabilises. We forecast that the labour input will grow by 0.3 per cent per year on average between 2021–25. This is conditional on the assumption that the rate of increase in the participation rate of 65+ slows as the state pension ages of men and women are gradually equalised. Without this we would expect growth of the labour force to be more modest and a greater softening in the labour input.
In 2015 unemployment was 5.4 per cent, which we view to be close to its long-run level. In the near term we expect there to be some amount of overshooting, spurred by the robust growth in the economy. From 2021–25 we project that this will have returned back to its long-run level of 5½ per cent.
Announced in the Autumn Statement/Comprehensive Spending Review was a looser path of fiscal policy and more borrowing over the life of the parliament when compared with the July Budget. As a result our forecasts for the decline in public sector net borrowing are more gradual than in our November forecast. The government is expected to borrow 3.4 per cent of GDP in 2016 which reduces throughout our forecast period. In the second half of 2019 the government is expected to be a net lender to the rest of the economy. On average between 2021 and 2025 the government budget is expected to be broadly in balance. This implies that public sector net debt will also decrease throughout our sample period, from a peak in 2015 of 81.3 per cent of GDP. Between 2021 and 2025 we predict public sector net debt to average around 65 per cent of GDP.
In the near term consumer price growth is expected to remain weak with annual inflation of 0.3 and 1.3 per cent in 2016 and 2017 respectively. This is primarily a result of the sharp falls in global commodity prices; we expect that as the effects dissipate, inflation will return to a rate consistent with the Bank of England's target. We expect consumer price inflation to average 2.1 per cent between 2021–25. While this may suggest that there could be a marginally tighter stance for monetary policy: figure 8 illustrates that the target remains well within the bounds of the most probable outcomes.
Compared with our November forecast, we have pushed back the timing of the first increase in Bank Rate to August from February but also expect interest rates to increase more rapidly in 2016. This implies that the path over the medium term remains broadly unchanged and that interest rates will gradually normalise over our forecast period. On average we expect interest rates to be 3½ per cent over the years 2021–25.
Exchange rates in our forecast are determined by interest rate differentials globally, given our projections for monetary policy internationally; this suggests that, in general, the sterling effective exchange rate will remain flat throughout our forecast period. The deficit on the current account is expected to reduce gradually over the years 2021–25, from 4.1 per cent of GDP in 2015 to around 3 per cent. The key risk around this projection remains the underlying cause of the deficit in net factor income and whether this is permanent or transitory, perhaps as a result of financial engineering (see Reference LaneLane, 2015). Our underlying assumption is that this phenomenon is transitory, however if this is not the case we should expect a larger current account deficit.
Appendix – Forecast details
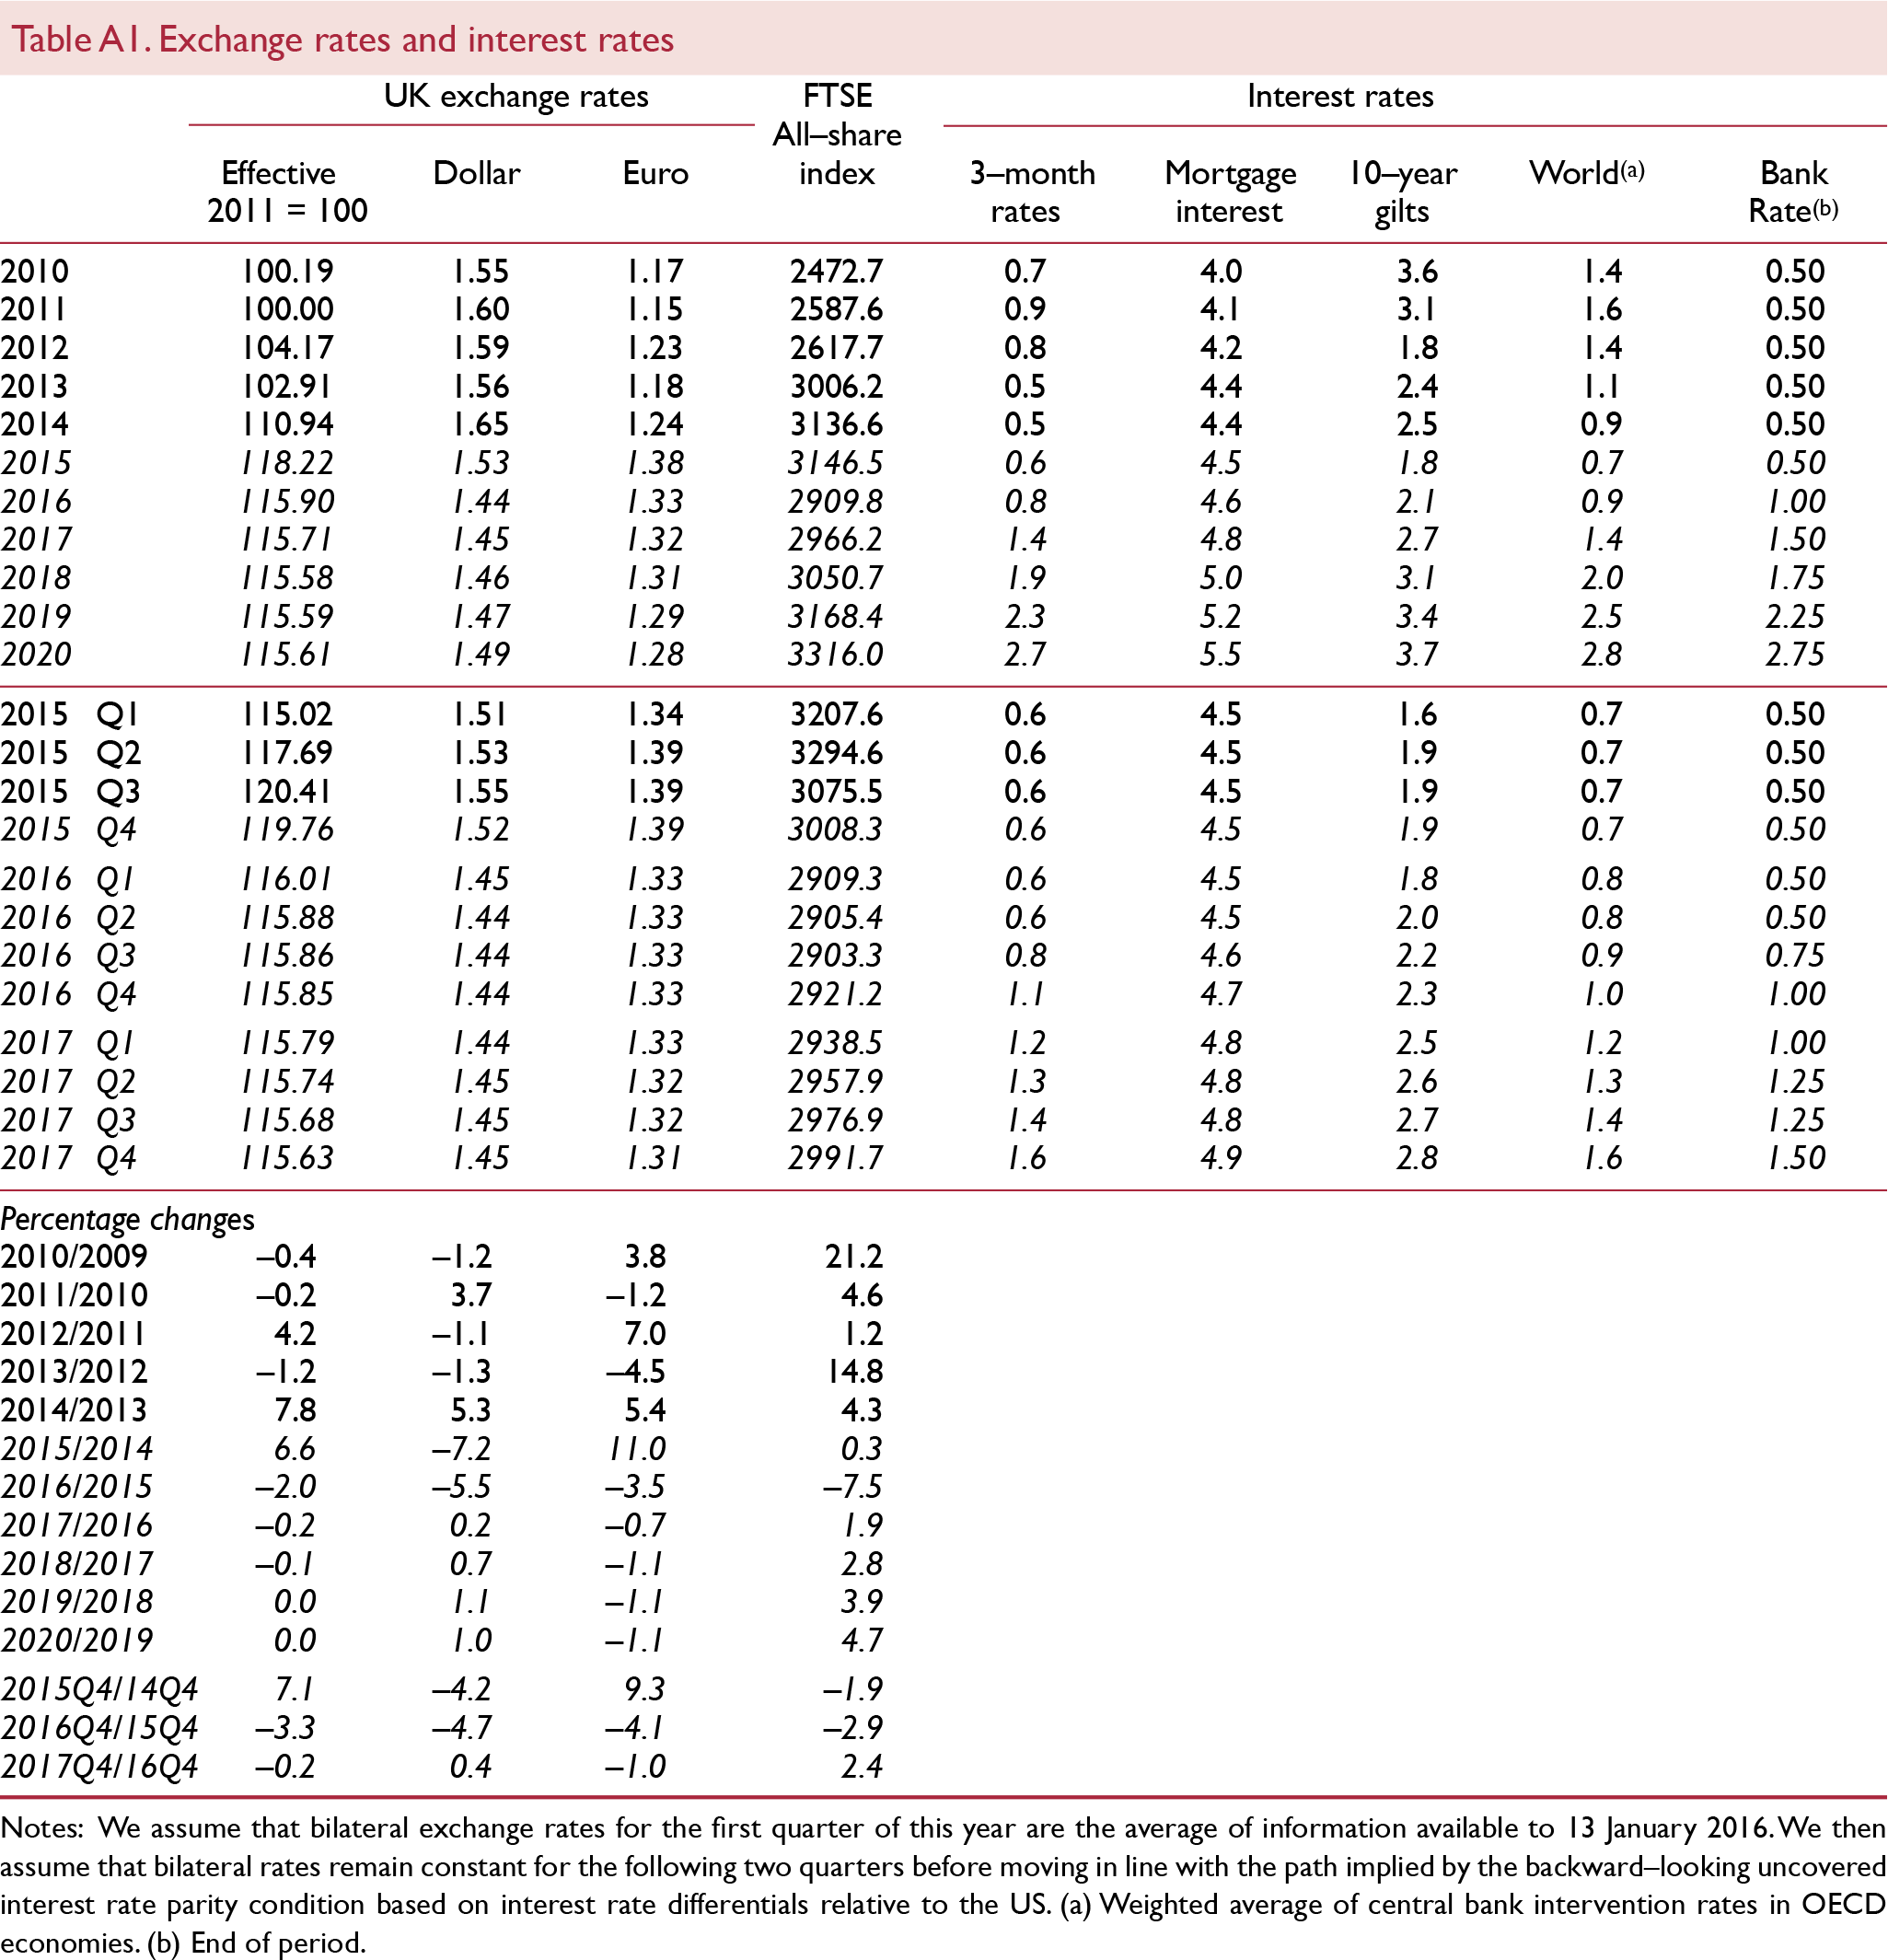
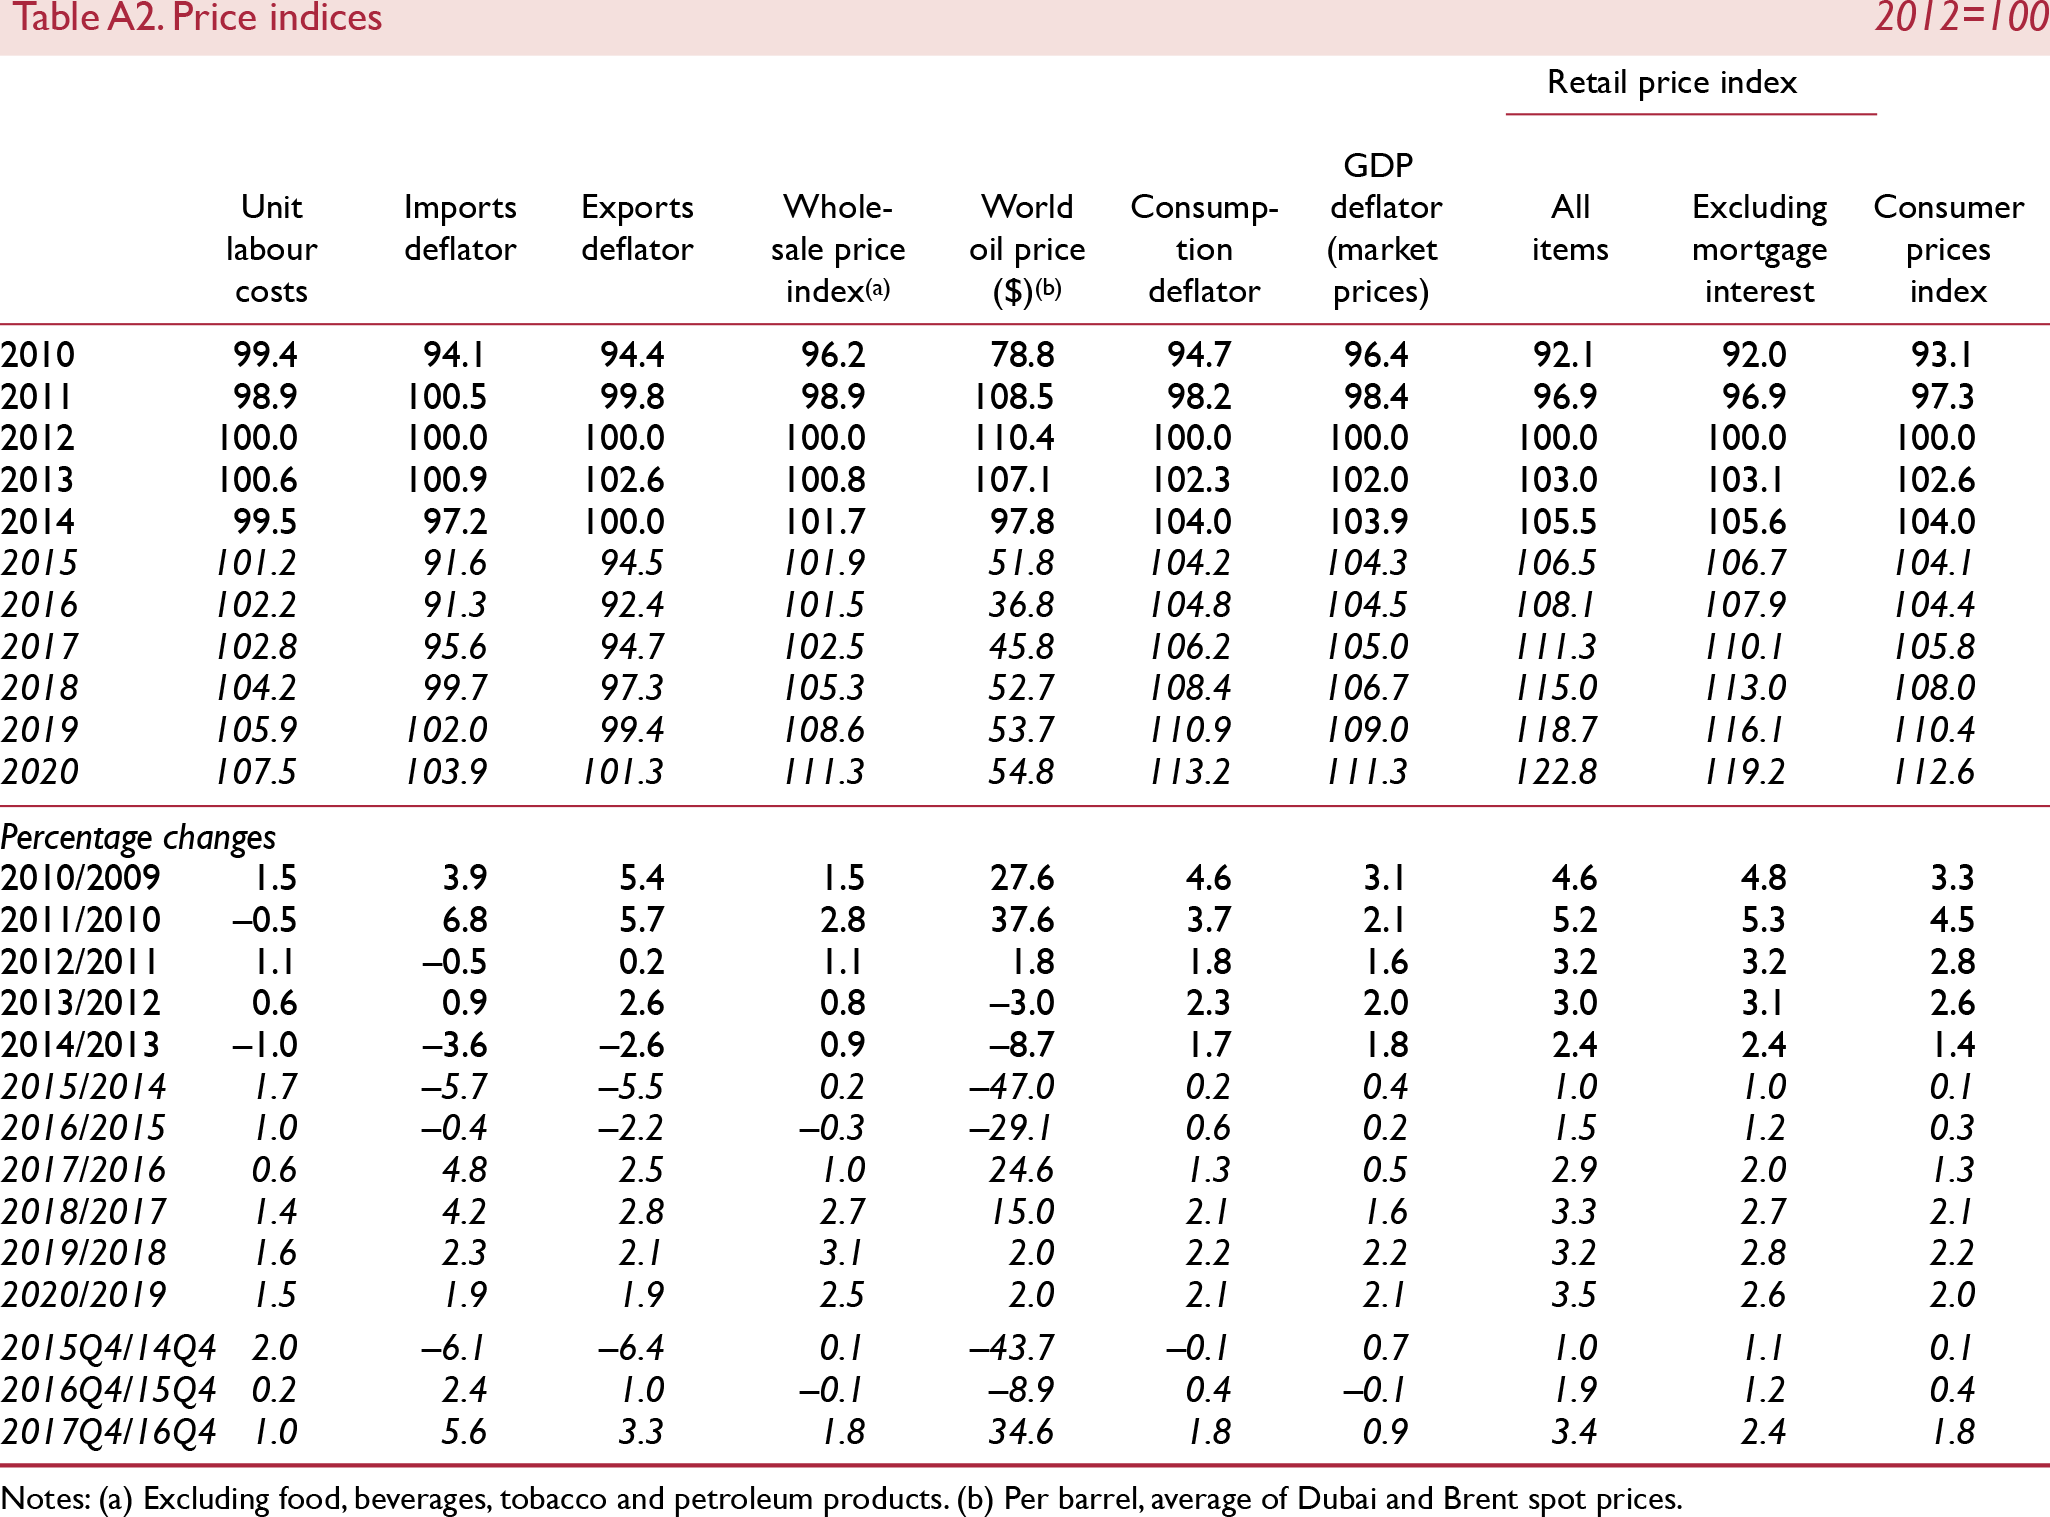

Figure A1. Inflation expectations have been stable in recent quarters

Figure A2. Private sector and public sector nominal wage growth
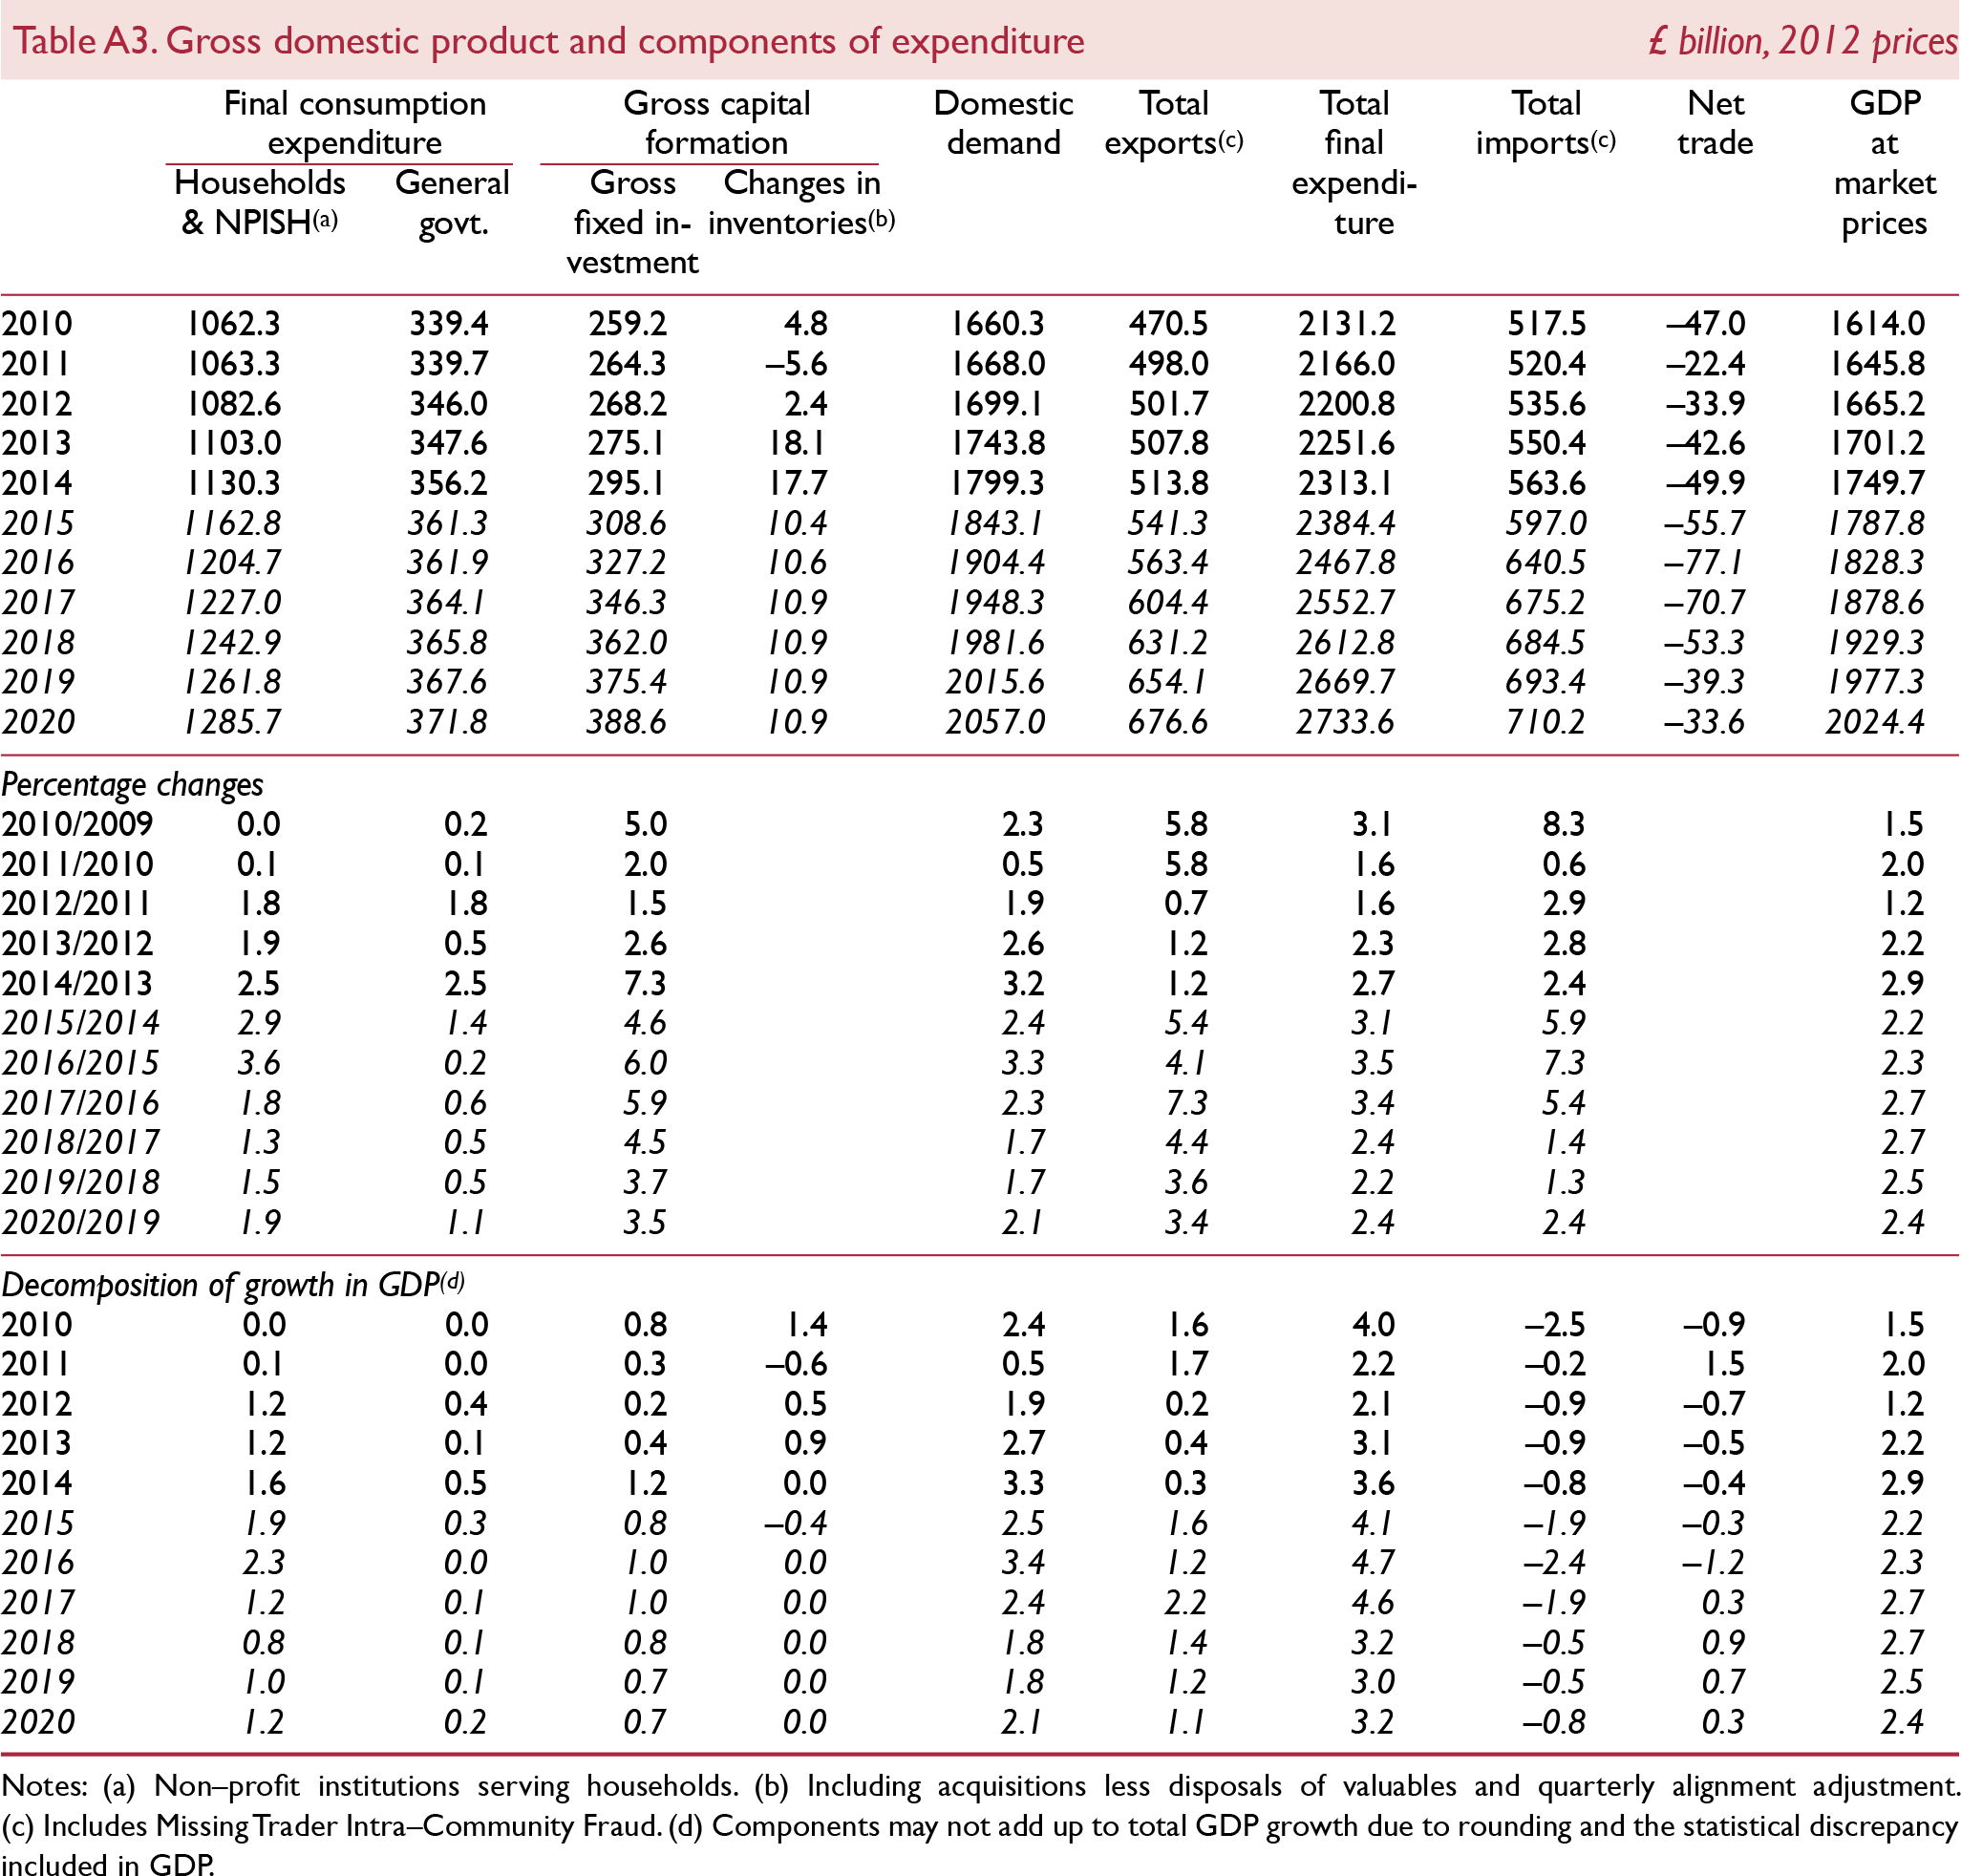


Figure A3. Exports to the EU remain close to pre-recession levels

Figure A4. Per capita consumer spending is expected to reach its pre–recession peak in 2016 (2007Q4=100)


Figure A5. Household income gearing

Figure A6. We expect households’ propensity to save to rise over the medium term (per cent of gross disposable incomes)


Figure A7. Productivity has returned to pre-recession levels

Figure A8. National saving is not expected to recover pre–crisis levels over our forecast horizon (per cent of GDP)
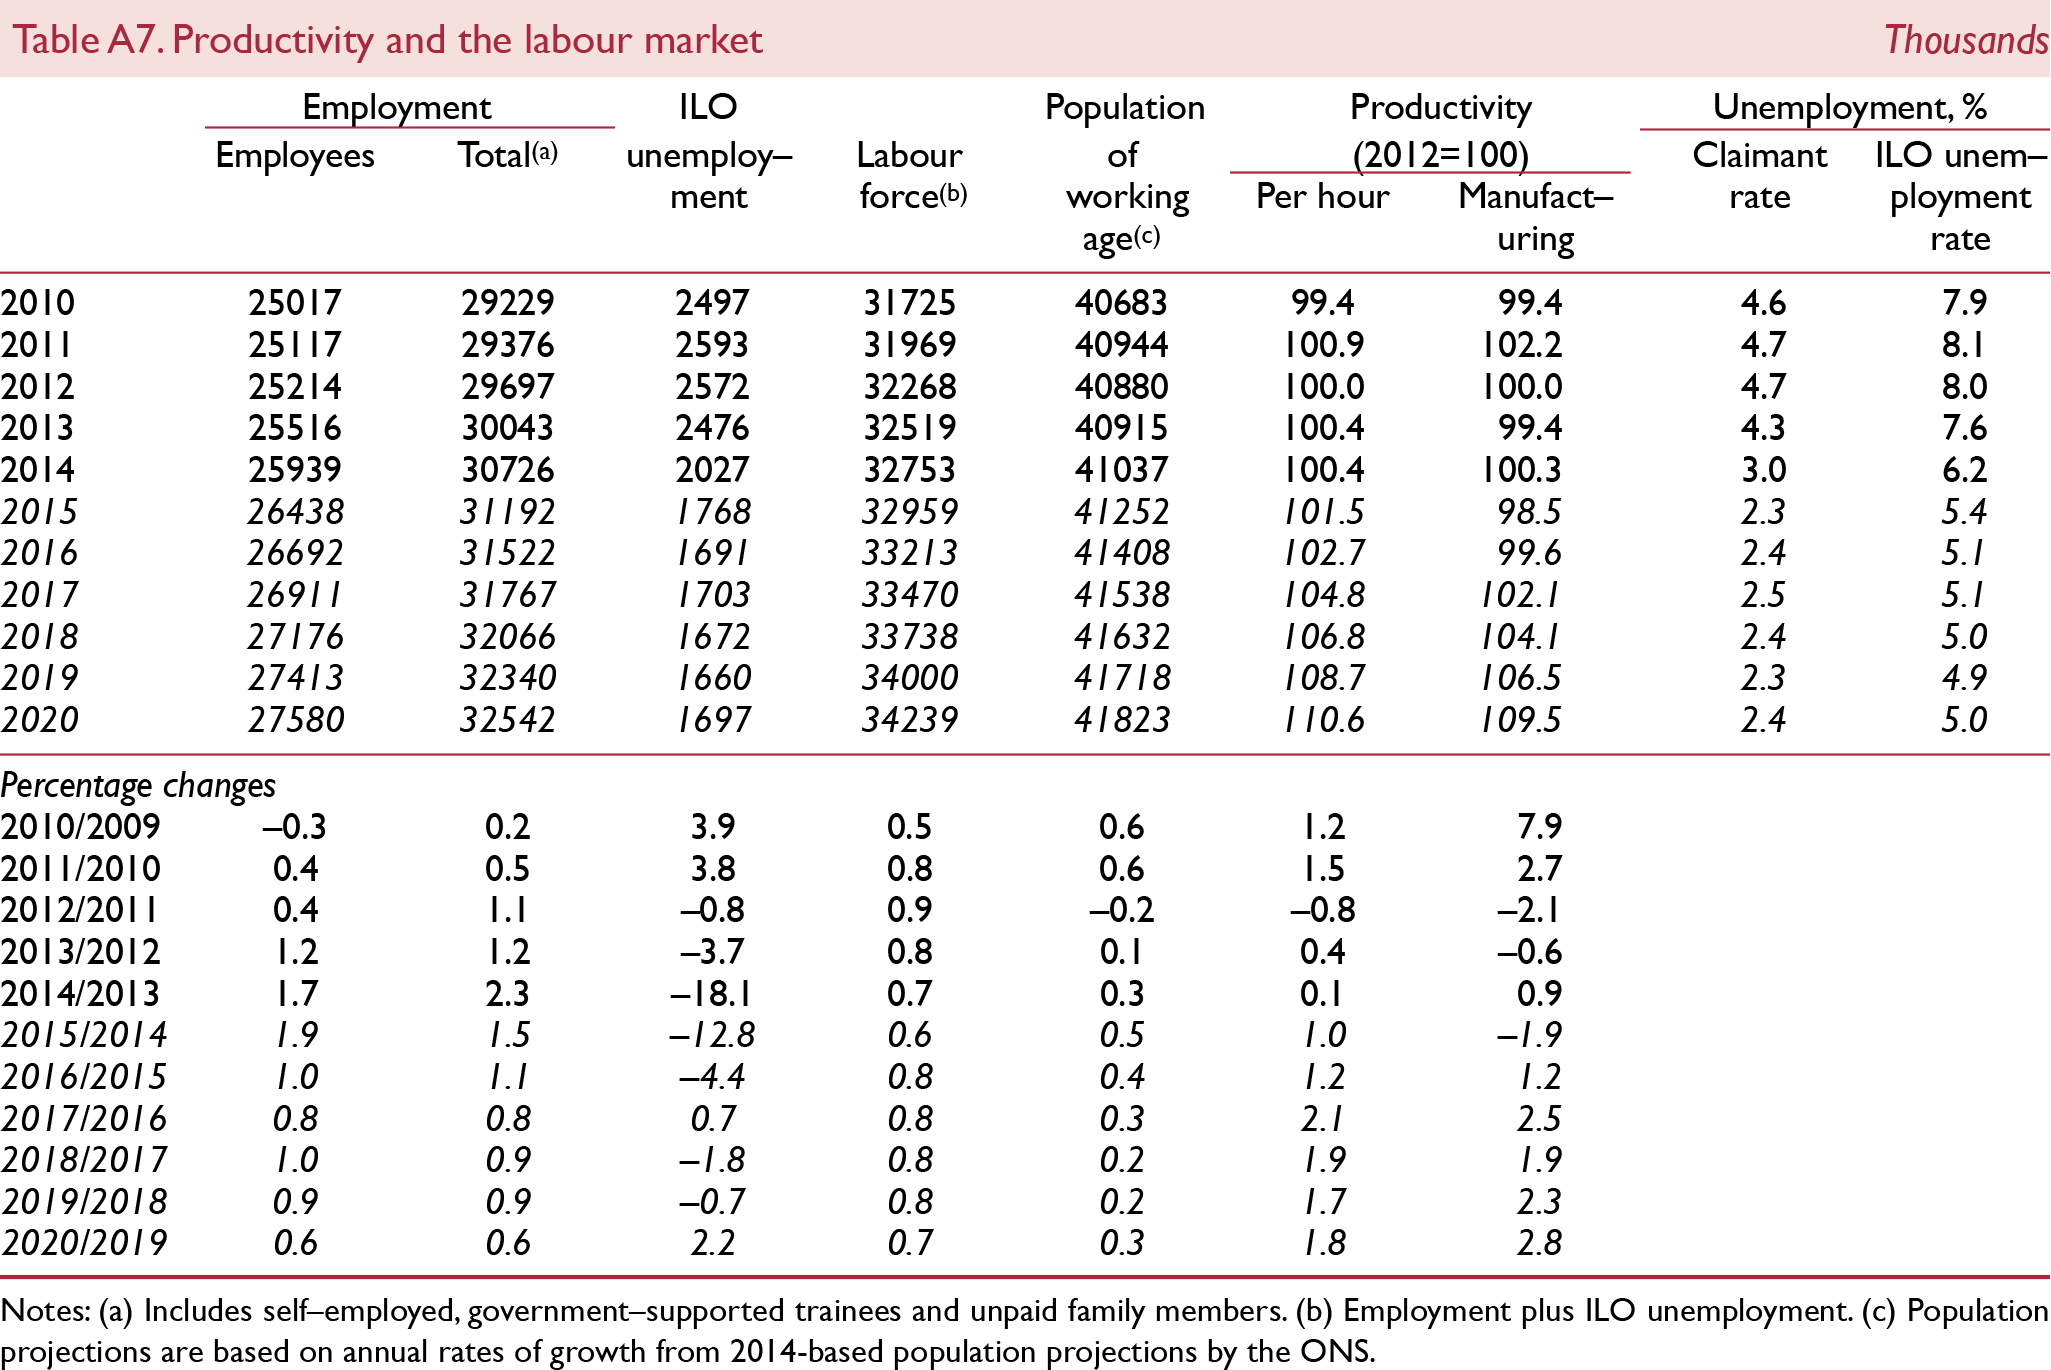

Figure A9. In 2015Q4 GDP was 6.6 per cent higher than its pre-crisis peak and employment is estimated to be 5.9 per cent higher

Figure A10. The Beveridge curve suggests continued improvement in the labour market matching process