


Survey research has expanded dramatically in the Arab world since the late 1980s.Footnote 1 Implemented first in authoritarian regimes undergoing political liberalization—including Morocco, Lebanon, Palestine, Algeria, Iraq, Yemen, and prior to the Arab Spring, Egypt—these studies, conducted as part of the World Values Survey (WVS) and Arab Barometer by Mark Tessler, Mustapha Hamarneh, Amaney Jamal, Mansoor Moaddel, Khalil Shikaki, and others, broke new ground. During the 2000s, a few Gulf countries—Bahrain, Kuwait, and Qatar—were added, and a regional survey-research hub, the Social and Economic Survey Research Institute (SESRI), was established in Qatar, joining similar institutes in Palestine and Jordan (appendix table A1).Footnote 2 At the same time, the growing body of surveys left many theoretical and policy questions unanswered. Due to their sensitivity, questions on voter choice and support for Islamist movements were not included in early questionnaires. Yet, over time, additional countries and topics were added. On the eve of the Arab Spring, more than 30 surveys had been fielded in 13 Arab countries, as well as Turkey and Iran—up from two in 1988 (figure 1).
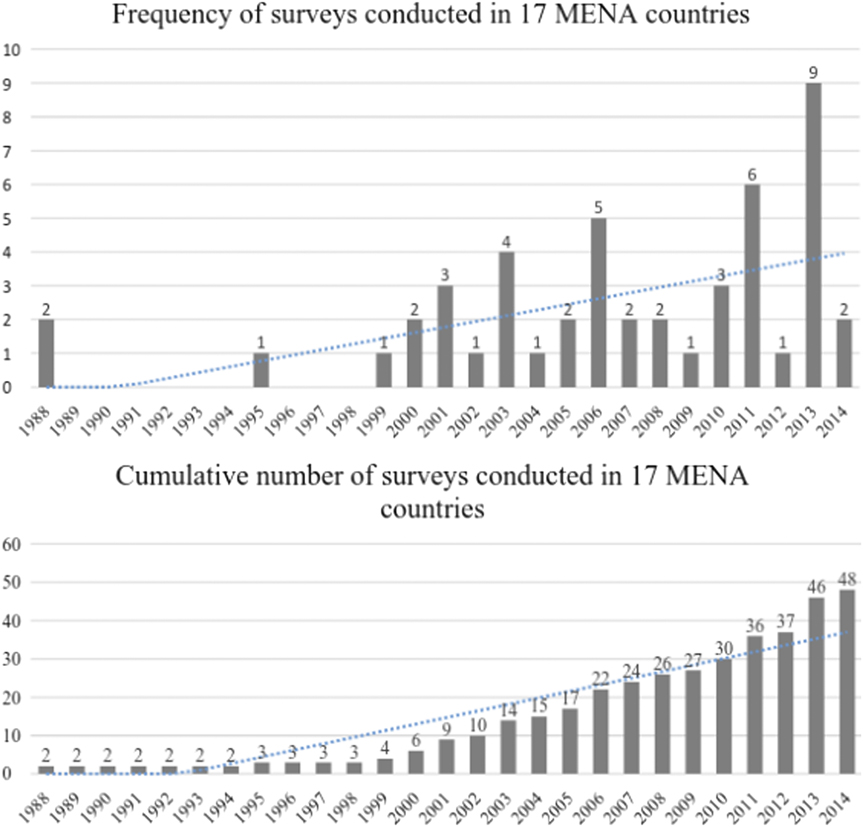
Figure 1 Growth of Surveys in the Middle East and North Africa (MENA)
Figure 1 shows survey research in the MENA, based on the Carnegie Middle East Governance and Islam Dataset (Tessler Reference Tessler2016), which includes 56 surveys and more than 80,000 interviews.
Yet, the Arab Spring marked a watershed for survey research, dramatically accelerating data collection and providing a suitable opportunity to reflect on past successes and future potential. Surveys were conducted for the first time in Tunisia and Libya following the 2011 uprisings. Due to its political openness and expanding survey capacity, Tunisia became rich terrain for social scientists as it transitioned to a minimalist democracy. Morocco and Jordan experienced limited political reform, but public opinion reacted to regional events there as well. Support for democracy declined in several countries (Benstead and Snyder Reference Benstead and Snyder2016), and attitudes toward foreign-policy issues shifted in theoretically interesting ways as well (Benstead Reference Benstead2017b), encouraging new lines of research.
In some countries, however, opportunities to conduct surveys were fleeting. Egypt returned to authoritarian rule and Libya’s continuing civil war made further survey research difficult. In other countries, survey research has continued despite persistent instability. Although the WVS and Arab Barometer have not been conducted in Syria, for instance, many scholars and organizations are implementing surveys there and among its displaced population.Footnote 3
Three decades since the first cross-national survey in the Arab world, dozens of datasets now exist. As shown in table 1, almost every Arab country is included in the WVS, Afrobarometer, and Arab Barometer (Jamal and Tessler Reference Jamal and Tessler2008; Tessler, Jamal, and Robbins Reference Tessler, Jamal and Robbins2012). In addition, survey research conducted by the Transitional Governance Project,Footnote 4 the Program on Governance and Local Development,Footnote 5 and other researchers and projects has increased.
As shown in figure 2, the number of papers presented at Middle East Studies Association (MESA) annual meetings using survey data increased from 12 in 2009 to 33 in 2016—almost tripling—and presentations at the American Political Science Association (APSA) annual meeting increased from one in 2009 to 10 in 2016.
Table 1 Nationally Representative Surveys in the Arab World
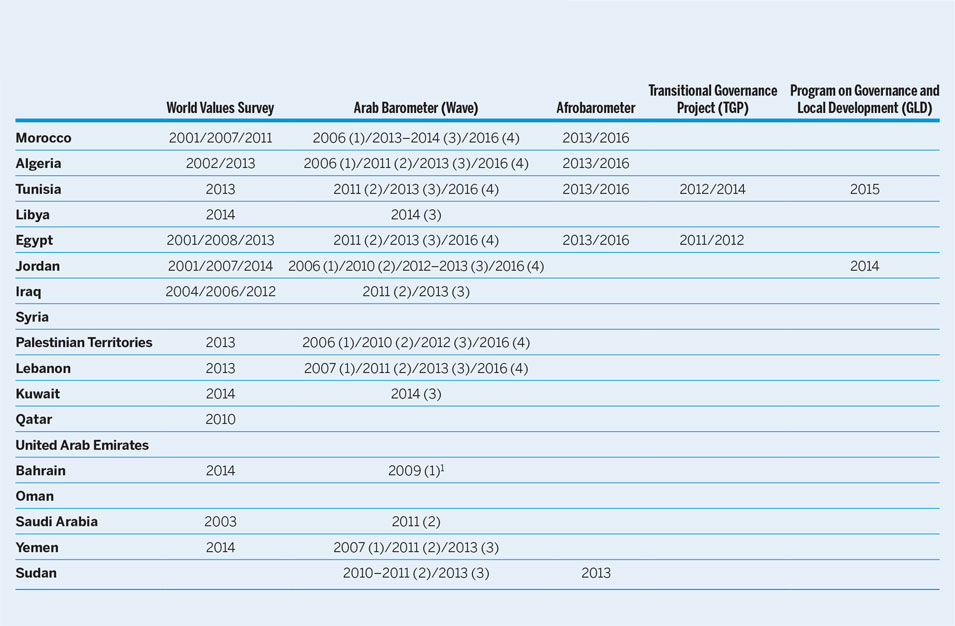
Note: 1500 respondents (Tessler Reference Tessler2016). See table A1.
Interest in survey research also is increasing among political scientists specializing in the Middle East. As shown in figure 2, the number of papers presented at Middle East Studies Association (MESA) annual meetings using survey data increased from 12 in 2009 to 33 in 2016—almost tripling—and presentations at the American Political Science Association (APSA) annual meeting increased from one in 2009 to 10 in 2016. Many presentations examined survey experiments that combine probability sampling with random assignment and vary photographs, the wording of questions, and frames to gain analytic leverage (Benstead, Jamal, and Lust Reference Benstead, Jamal and Lust2015; Bush and Jamal Reference Bush and Jamal2015; Bush and Prather Reference Bush and Prather2017a; Corstange and Marinov Reference Corstange and Marinov2012; Nugent, Masoud, and Jamal Reference Nugent, Masoud and Jamal2016; Shelef and Zeira Reference Shelef and Zeira2017).
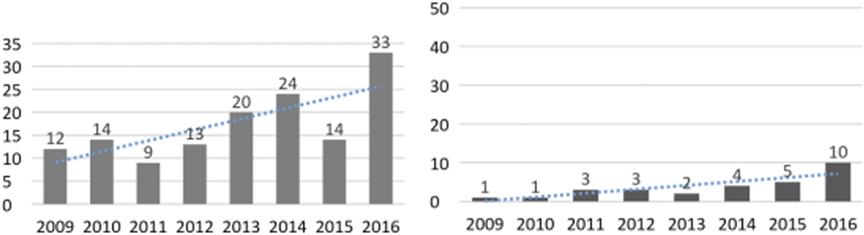
Figure 2 MESA (Left) and APSA (Right) Presentations
Figure 2 (left) shows papers presented at MESA annual meetings, based on a search for “survey” in abstracts, in which the term refers to opinion rather than archival or qualitative surveys. Figure 2 (right) shows papers and posters presented at APSA annual meetings based on titles (see table A2).
At the same time, the range of topics covered by surveys also expanded to include questions focusing on transitional politics in Tunisia, Libya, and Egypt. The questions that scholars can explore using the expanded data include the following:Footnote 6
1. How do regimes reconsolidate after transitions? Are the same voters politically engaged before and after revolutions?
2. Why did citizens protest during and following the Arab Spring? (Beissinger, Jamal, and Mazur Reference Beissinger, Jamal and Mazur2015)
3. What explains support for Islamist and non-Islamist parties? (Pellicer and Wegner Reference Pellicer and Wegner2015)
4. To what extent does vote-buying occur? Why do citizens respond to clientelistic and programmatic appeals?
5. Why do Arab citizens vary in their support for a two-state solution in Israel/Palestine?
6. Why do citizens support globalization, trade, and foreign direct investment? How do citizens respond to Western interference in internal politics? (Nugent, Masoud, and Jamal Reference Nugent, Masoud and Jamal2016)
To expand on existing research and answer these questions, it is important to address concerns raised by conference participants and reviewers about data quality in the Arab world. These concerns stem from the threat of preference falsification in authoritarian regimes (Kuran Reference Kuran1997) and, to a lesser extent and largely anecdotally, from worries about the difficult survey environment created by political instability.Footnote 7 Yet, based on WVS analyses, I found evidence of systematically missing data—a possible indicator of social desirability bias—not only in Arab cases but also in other regions (table A4). I argue that the assumption that the Arab world is an inherently more challenging survey context reflects biases of “Arab exceptionalism” more than fair assessments of data quality. Social desirability and other potential sources of bias should spur methodological research to better understand the data-collection process in the Arab world as well as other regions.
The remainder of this article discusses the Arab survey context, including the impact of authoritarianism on data quality, and it highlights ethical issues arising from Computer-Assisted Personal Interviewing (CAPI), which is one of several tools used to study and address bias.
THE ARAB SURVEY CONTEXT
A growing literature focuses on how observable interviewer traits, including religious dress and gender, and the apparent research sponsor affect survey participation and responses in the Arab world (Blaydes and Gillum Reference Blaydes and Gillum2013; Corstange Reference Corstange2014). This research shows that social desirability bias is at least as pronounced in the Middle East as in other regions, due to the politicization of issues such as religion and women’s rights. For instance, female interviewers receive more egalitarian responses to questions about gender equality in the United States and Mexico (Flores-Macias and Lawson Reference Flores-Macias and Lawson2008; Kane and Macaulay Reference Kane and Macaulay1993). However, effects are large and interact with interviewer religious dress and respondent traits in the Arab countries (Benstead Reference Benstead2014a, Reference Bensteadb; Blaydes and Gillum Reference Blaydes and Gillum2013).
Yet, whereas the nature and magnitude of interviewer effects vary cross regionally, social desirability impacts survey data in all world regions (Flores-Macias and Lawson Reference Flores-Macias and Lawson2008; Gmel and Heeb Reference Gmel and Heeb2001; Streb et al. Reference Streb, Burrell, Frederick and Genovese2008; Sudman and Bradburn Reference Sudman and Bradburn1974). As in many other international contexts, instability, poor infrastructure (e.g., electricity and Internet), and difficulties drawing a representative sample also are challenges in some Arab countries (Seligson and Morales 2017).
It is important that authoritarianism in many Arab countries also raises concerns about whether respondents will answer honestly (Kuran Reference Kuran1997).Footnote 8 In authoritarian regimes, citizens may feel compelled to participate in surveys and, when answering, to conceal their opinions for fear of retaliation or a loss of benefits if they do not support the regime. Moreover, concerns about preference falsification do not disappear in democratic transitions. In a polarizing transition such as Tunisia’s, respondents may no longer fear criticizing the authoritarian regime, but they may hesitate to admit that they did not vote for the governing party (Benstead and Malouche Reference Benstead and Malouche2015).
Concerns about preference falsification in authoritarian survey contexts appear to be widespread among political scientists. For instance, one anonymous reviewer wrote in 2017 about a manuscript that used Gallup data from several Arab countries, including Tunisia, Egypt, Jordan, Morocco, Syria, and Bahrain, as follows:
The study is based on survey data, collected two years prior to the uprisings, from citizens who live under authoritarian regimes with no freedom of expression and hefty penalties for speaking up. Therefore, I don’t believe that the people surveyed were telling the truth with no fear of retribution from the government, given the abundant number of informants lurking everywhere.
Yet, preference falsification is not limited to the Arab region. Studies of authoritarian regimes, including Russia (Kalinin Reference Kalinin2016), China (Jiang and Yang Reference Jiang and Yang2016), and Africa (Tannenberg Reference Tannenberg2017), found that respondents commonly misrepresent their views on sensitive issues (Kuran Reference Kuran1997). It therefore is critical to conduct methodological research to understand when and why social-desirability shapes participation and responses. Rather than jettisoning survey research, scholars should use list experiments, interviewer-effects studies, and mode studies to understand where and why preference falsification occurs.
Despite these concerns, research on preference falsification in the Arab world has examined the phenomenon only obliquely and found mixed results. In transitional Tunisia, Bush and Prather (2017b) found that opposition members did not report more favorable views of the majority party, Ennahda, when the enumerator used CAPI rather than Paper and Pencil Interviewing (PAPI)Footnote 9—even though tablets may induce fears of government surveillance. Bush et al. (Reference Bush, Erlich, Prather and Zeira2016) also found no effect of authoritarian iconography on compliance or support for the regime in an experiment in the United Arab Emirates. However, interviewer-effects studies suggest possible preference falsification in Morocco and Tunisia, where secular-appearing male interviewers—who are more likely to be associated with the state than female or religious-appearing enumerators—received higher participation and lower item-nonresponse rates (Benstead Reference Benstead2014a, Reference Bensteadb; Benstead and Malouche Reference Benstead and Malouche2015).
Yet, in an analysis of missing data, the Arab world does not stand out dramatically from other regions in terms of the amount of missing data or the extent to which it is systematically related to dependent variables of interest (e.g., attitudes about democracy or gender equality).
DATA QUALITY ASSESSMENT
Comparison of response distributions across surveys conducted at similar times and an examination of missing data provided a reasonable if not wholly satisfying approach to assessing data quality. Poor feedback and probing, mistakes in questionnaire application (e.g., skip patterns), and imprecise response recording all lead to missing data and can produce inefficiency and bias in statistical analyses. Missing data also stem from question sensitivity and indicate social desirability or conformity bias.Footnote 10
Yet, in an analysis of missing data, the Arab world does not stand out dramatically from other regions in terms of the amount of missing data or the extent to which it is systematically related to dependent variables of interest (e.g., attitudes about democracy or gender equality). For instance, the overall proportions of missing data for support for democracy in cross-national surveys in the Arab world are shown in figure 3. More than half of the surveys had 10% or fewer cases missing for this question. More than 20% of the observations were missing in some Tunisian, Saudi Arabian, Iraqi, and Algerian surveys, whereas 36% of responses were missing in Morocco in 2011 and 30% in 2005.
Figure 3 Mean Support for Democracy and Proportion Missing
Figure 3 shows mean and proportion of responses missing: “Despite its problems, democracy is the best form of government. Strongly disagree = 1; strongly agree = 4.” Tessler (Reference Tessler2016), GLD (2017), and TGP (2017). Data unweighted. Not asked in the Afrobarometer (2017).
There are many possible reasons why the proportions of missing cases for support for democracy vary across time and between the WVS and the regional barometers. These include increasing or decreasing political tension (e.g., the Arab Spring) and changes in survey capacity across different research groups or firms. Although there is no standard for how much missing data is acceptable, missing data can be reduced through improved monitoring and interviewer training, including training on standardized survey-interviewing techniques (i.e., probing nonresponse and giving feedback) (Benstead Reference Benstead, Atkeson and Michael Alvarez2017a).
Moreover, as shown in figure 3, surveys conducted by different research groups found similar estimates of support for democracy in all Arab countries in which surveys were conducted within a one-year period, giving increased confidence in data quality. The 2007 Arab Barometer in Yemen found mean support for democracy of 2.1, whereas a year earlier, the WVS estimated 2.2. The 2006 Arab Barometer estimated mean support of 2.5 in Morocco, while a year earlier, the National Science Foundation survey estimated 2.3 (Tessler Reference Tessler2016). Similarly, the 2014 GLD survey estimated mean support of 2.0 in Jordan, shortly after the Arab Barometer found a mean of 2.1. Public opinion can shift during the course of a year. Yet, these comparisons are encouraging, given the myriad systematic and unsystematic errors that can affect survey estimates.
When asking another highly utilized survey question—whether men make better political leaders—levels of item-missing data in the WVS were similar in the Arab world and other regions: Sub-Saharan Africa (4%), West Asia (5%), North and South America (5%), Europe (6%), East Asia (7%), and Oceania (8%). In the Arab world, only 4% of the responses were missing, but rates were high in two Moroccan waves (17%; see table A4).Footnote 11
The same is true of the regional barometers (table A5). On average, 1% of responses to the question of whether “Men make better political leaders” were missing in the Afrobarometer (2017), 2% were missing in the Arab Barometer (2017), and 5% were missing in the Latinobarometer (2017).
SYSTEMATICALLY MISSING DATA
Item-missing data were also systematically related to respondent gender, education, and religious practice in numerous WVS countries. For instance, in the 212 WVSs (2017) conducted worldwide, missing data were systematically related to respondent gender in 48 surveys (23%), education in 81 surveys (38%), and religiosity in 54 surveys (25%). (For a full analysis, see table A4.)
Data most often were missing for women and less-educated respondents in surveys worldwide. However, data were no more likely to be systematically missing in the Arab world than in other regions. About half of the surveys in all regions had systematically missing data related to respondent gender, education level, or religiosity. For instance, in East Asia, 47% of surveys were systematically missing data for at least one variable (i.e., gender, education, or religiosity). In Oceania, 50% of surveys had systematically missing data for at least one of the three respondent variables, compared to South America (53%), Sub-Saharan Africa (53%), West Asia (57%), Middle East (57%), North America (59%), and Europe (65%).
There also was variation within the Arab world in terms of the extent to which missing data were systematically related to these variables. In the Levant (i.e., Jordan, Palestine, and Iraq), which boasts a long history of survey research, only 25% of surveys had systematically missing data for one or more of the respondent variables, compared to 70% of surveys in North Africa and 80% in the Gulf.
The extent of systematically missing data worldwide—including the higher rate observed in the Gulf and North Africa—underscores the need for global methodological research to understand the survey interaction and address potential bias. However, the analysis provided little evidence that the Arab world is exceptional in this regard.
Although CAPI has important benefits for reducing errors, they must be weighed against potential risks to participants posed by the tablet’s GPS function, especially in authoritarian regimes.
ETHICAL ISSUES
Use of CAPI is increasingly common and has been shown to improve data quality by reducing data-recording errors, especially with skip patterns and randomization (Benstead et al. Reference Benstead, Kao, Landry, Lust and Malouche2017; Bush and Prather Reference Bush and Prather2017b; Caeyers, Chalmers, and De Weerdt Reference Caeyers, Chalmers and Weerdt2012). Unlike standard PAPI, in which the interviewer records responses on paper and manually codes them into a computer, interviewers using CAPI record answers onto a digital device.
Although CAPI has important benefits for reducing errors, they must be weighed against potential risks to participants posed by the tablet’s GPS function, especially in authoritarian regimes. For instance, in any setting—but especially in unfree countries—recording GPS locations to measure neighborhood effects, locate sampling units, or take photographs of streets or housing units to measure socioeconomic status could expose participants to risk if electronic files were obtained by authorities or data were released with identifying information. Although no such breaches of participant anonymity or confidentially are known, it is important to be cognizant of heightened risks presented by CAPI, not only for political science but other fields as well.Footnote 12 It also is important to be aware that similar risks exist in PAPI, in that some survey firms record personal information on paper forms to monitor interviewers and sampling; therefore, PAPI also could put confidentiality at risk. When identifying information is captured in the form of a GPS location, it may be copied, intercepted, or released more easily without researchers’ or respondents’ knowledge than when paper copies are used and destroyed (i.e., following typical human-subjects protection protocols). Accordingly, the necessity of recording and downloading identifiable information should be assessed carefully in human-subjects protocols and avoided whenever possible.
To address confidentiality concerns, CAPI users can disable GPS functionality or view it to verify only that the unit is in the correct sampling area but not to record the location on the device. If the GPS location is recorded, the added benefit versus risk must be established through human-subjects protocols. Researchers also can consider using two practices to protect research subjects. First, they should download data without GPS coordinates, unless they are needed for a specific research or monitoring reason. Files containing GPS coordinates should be handled and safeguarded only by members of the research team. Second, researchers can use applications such as CS Pro (US Census Bureau 2017), which allow data to be accessed by the study team but no one else. In contrast, data stored by many commercially available programs such as SurveyToGo may be accessed by non-study members, including those who manage data storage. Other best practices include bolstering content about respondents’ rights in introductory scripts (e.g., emphasizing that participation is voluntary); removing GPS locations before public data releases; and specifying in survey-provider agreements that governments cannot access data before files are anonymized. In collaboration with researchers, repository managers should ensure that deposited files do not contain identifiable information.
Best practices for protecting individual participants and their communities are not in and of themselves sufficient, however. As a research community, we must engage in critical conversations about what constitutes truly informed consent, which type of information is ethical to collect (e.g., photographs of research sites), and additional safeguards that we can develop and deploy to better protect vulnerable research participants.Footnote 13
CONCLUSIONS: TOWARD A NEW WATERSHED FOR SURVEY RESEARCH IN THE ARAB WORLD?
This article highlights the progress that survey researchers have made in the Arab world in recent decades. Researchers continue to improve training and monitoring. Increasingly, they add sampling weights to correct for higher refusal rates among less-educated citizens. Yet, this analysis shows that bias arising from preference falsification is likely to be present in authoritarian and transitional environments in the Arab world, just as it is in other regions and regime types. Rather than reflexively discounting surveys from the Arab world or any other region, scholars should conduct more methodological studies to better understand the data-collection process and address different forms of survey bias. With its free political context, Tunisia provides a particularly useful example to investigate a range of political science research questions and to design and implement innovative methodological research. In this sense, the Arab Spring represents a watershed moment in applied research, as long as this unique opportunity also is met with renewed discussion about the underlying ethics of survey and other research methodologies. As the number of Arab countries represented in cross-national surveys increases with time, there is growing promise of advancing a collective understanding of important ethical, theoretical, and policy questions.
SUPPLEMENTARY MATERIAL
To view supplementary material for this article, please visit https://doi.org/10.1017/S1049096518000112
ACKNOWLEDGMENTS
I thank Lonna Atkeson and two anonymous reviewers for helpful feedback and Serra Gunaydin, Jonathan Millar, Anna Murphy, Jim Mignano, and Zelin Wei for research assistance.


