


Scientific evidence suggests that regular fruit and vegetable (F&V) intake may exert a protective effect against micronutrient deficiencies and chronic diseases, the main risk factors for death and diseases worldwide( Reference He, Nowson and MacGregor 1 – 5 ). As part of a public health strategy for chronic disease prevention, five portions of fruits and vegetables (F&V) daily (approximately 400 g/d) have been recommended( 4 ).
Assessing the adequate consumption of F&V in children is critical since the development of unhealthy food habits may lead to health problems such as growth impairment, nutritional deficiencies and overweight( Reference Filho and Rissin 6 , Reference Wang, Monteiro and Popkin 7 ). Little is known about estimates of F&V consumption among children in Brazil or many other developing countries( Reference Lock, Pomerleau and Causer 8 ). Results from the Brazilian Household Budget Survey for children under 10 years old estimated a national per capita F&V consumption of 153 g/d, with the lowest consumption (109 g/d) found in the Brazilian Amazon area( 9 ).
Despite the complexity involved in dietary assessment, screening tools can be useful for nutritional risk assessment in community settings. Among the parameters considered in these instruments, food consumption constitutes an important factor for the maintenance of healthy nutritional status, it being both simple and fast to identify food features associated with nutritional disturbances( Reference Lillegaard, Overby and Andersen 10 – Reference Lazarou, Panagiotakos and Spanoudis 12 ). FFQ for food groups are examples of brief dietary assessment tools, and since the 1990s they have been used as nutritional screening tools in monitoring studies and programmes for promotion of F&V consumption( Reference Lillegaard, Overby and Andersen 10 , Reference Subar, Heimendinger and Krebs-Smith 13 – Reference Cappuccio, Rink and Perkins-Porras 15 ), such as the Behavioral Risk Factor Surveillance System (BRFSS), developed by the Centers for Disease Control and Prevention, to provide estimates of health behaviours related to the leading causes of death among US citizens( Reference Remington, Smith and Williamson 16 , Reference Serdula, Coates and Byers 17 ).
Nutritional screening tools evaluate habitual consumption but may lead to systematic errors intrinsic to the methods used for evaluating food consumption( Reference Horner, Patterson and Neuhouser 18 , Reference Subar, Dodd and Guenther 19 ). Considering this aspect, nutritional biomarkers, such as circulating carotenoids, folate and vitamin E, represent an additional measure to guarantee the quality of dietetic information since they do not depend on memory and are not prone to the same type of measurement errors( Reference Hunter 20 , Reference Freedman, Kipnis and Schatzkin 21 ). Plasma concentrations of carotenoids and folate are associated with recent F&V intake( Reference Thurnham and Northrop-Clewes 22 – Reference Block, Norkus and Hudes 24 ), and vitamin E status has been considered a good indicator of healthy food choices( Reference Morrissey and Sheehy 25 ).
In the present study, we examined associations between the frequency of F&V consumption using an FFQ for food groups and nutritional status indicators (stunting, obesity, anaemia, vitamin A and folate deficiencies, vitamin E and D insufficiencies) in children aged 4–10 years from a Northern Brazilian city.
Methods
Study area and population
A population-based, cross-sectional study on children’s nutrition and health was carried out in December 2007 in Acrelândia, a frontier town located 112 km east of Rio Branco, the capital of the state of Acre, in the Western Brazilian Amazon region. Acrelândia is a town inhabited by migrants from Southeast and South Brazil engaged in commercial agriculture and cattle raising. The human development index in Acrelândia was estimated at 0·680 according to data from 2000 (ranged from 0·359 to 0·919 for other Brazilian cities)( 26 ). Sampling strategies and field procedures have been described elsewhere( Reference Cardoso, Scopel and Muniz 27 ). Briefly, a census of all households in the urban area of Acrelândia was performed and 749 households with children younger than 10 years of age were identified. A questionnaire was administered by trained fieldworkers (nutritionists, physicians and local teams from the Family Health Program of the Brazilian Ministry of Health), through face-to-face interviews, to the mothers or guardians of the children. The questionnaire was pilot-tested previously and covered the following topics: demographic characteristics, socio-economic status, environmental conditions (water supply, sewage disposal and garbage disposal), reproductive health variables, nutritional history and morbidities. After the interview, mothers and children were invited to visit the local family health clinic, where research assistants carried out a physical examination and obtained a venous blood sample. For the present analysis, the short FFQ was used only among children over 4 years old (n 702) based on logistical reasons and ability of reporting habitual food consumption.
The study was conducted according to the guidelines laid down in the Declaration of Helsinki and written informed consent was obtained from all parents or guardians of participating children. The study protocol was approved by the Ethics Committee of the School of Public Health, University of São Paulo.
Anthropometry assessment
Height and weight were measured by trained research assistants employing standardized procedures on calibrated equipment( Reference Lohman, Roche and Martorell 28 ). Birth date was recorded directly from birth certificates or child health cards. Height-for-age Z-scores (HAZ) and BMI-for-age Z-scores (BMIZ) were calculated according to WHO child growth standards( 29 ) for children aged <5 years and WHO Growth Reference Data( Reference de Onis and Lobstein 30 ) for children aged ≥5 years. The cut-offs for stunting (HAZ<−2) and obesity (BMIZ ≥ 2) were defined according to WHO child growth standards( 29 , Reference de Onis and Lobstein 30 ).
Laboratory procedures
Fasting venous blood samples (approximately 5 ml) were collected by trained nursing assistants. At the field laboratory in Acrelândia, Hb concentrations were measured on an ABX Micro60 automated cell counter (Horiba, Montpellier, France). The cut-off value used for anaemia was Hb<110·0 g/l for children under 5 years and Hb<115·0 g/l for children aged 5–10 years old( 31 ). A separate blood sample was protected from light and centrifuged within 1 h of collection; serum samples were shipped to São Paulo on dry ice and frozen at −70°C until further analysis. In São Paulo, serum concentrations of β-carotene, lycopene, retinol, tocopherol and 25-hydroxyvitamin D were measured by standard HPLC methods( Reference Vuilleumier, Keller and Rettenmaier 32 ). Carotenoid peaks under the limits of quantification were set to zero (nineteen samples for β-carotene and eighty-four for lycopene). Vitamin A deficiency (VAD) was defined as serum retinol<0·70 µmol/l( 33 ); vitamin D insufficiency (VDI) as serum vitamin D<75 nmol/l( Reference Dawson-Hughes, Heaney and Holick 34 ) and vitamin E insufficiency (VEI) as serum tocopherol <11·6 µmol/l( Reference Looker, Underwood and Wiley 35 ).
Folate concentrations were measured using commercial fluoroimmunoassays (Perkin Elmer, Wallac Oy, Turku, Finland); values <10 nmol/l were taken to indicate folate deficiency (FD)( 36 ). Children with anaemia or nutrient deficiencies detected during the survey received adequate treatment prescribed by the medical team involved in the project, in accordance with WHO guidelines( Reference Vuilleumier, Keller and Rettenmaier 32 ).
Food Frequency Index for fruit and vegetable consumption
A short FFQ for food groups was used as a brief dietary assessment tool to estimate the frequency of food group consumption (fruit, green vegetables, root vegetables, dairy, beans, meat, eggs and fish) within the last month, with the following response options: never, 1–3 times/month, 1–3 times/week, 4–6 times/week, 1 time/d, 2–3 times/d and ≥4 times/d. The short FFQ was applied by health community workers to the children’s mother or caregiver. Based on a validation study in this area, the short FFQ did not collect information on portion sizes considering that: (i) the frequency of consumption tends to have a greater bearing on dietary intake than portion sizes; and (ii) the inclusion of portion sizes could make the questionnaire more difficult to answer( Reference Scagliusi, Garcia and Indiani 37 ).
A Food Frequency Index (FFI) for F&V consumption was created based on the frequency of consumption of vegetables and frequency of consumption of fruits reported in the short FFQ, as shown below.
-
1. Vegetables: due to the low consumption of vegetables, frequencies of intake for both green and root vegetables were grouped and the result was classified into three categories, i.e. ‘0’=low (no consumption or ≤3 times/month), ‘1’=intermediate (1–6 times/week) and ‘2’=everyday consumption of vegetables (≥1 time/d).
-
2. Fruits: the never intake category was grouped with other options (≤3 times/month and 1–3 times/week) and classified as ‘0’=low consumption since only 6·1 % of children did not consume any fruit; the other options of response were classified as ‘1’=intermediate (4–6 times/week) and ‘2’=everyday consumption of fruits (≥1 time/d).
Finally, the values attributed for F&V consumption were summed for each child to obtain an FFI ranging from 0 (FFI0, lowest category, including children who did not consume vegetables or consumed ≤3 times/month, but consumed fruit ≤3 times/week), 1 (FFI1, consumption of vegetables 1–6 times/week and fruits ≤3 times/week), 2 (FFI2, consumption of vegetables 1–6 times/week and fruits 4–6 times/week), 3 (FFI3, consumption of vegetables ≥1 time/d and fruits 4–6 times/week) and 4 (FFI4, highest category, including children who consumed vegetables ≥1 time/d and fruits ≥1 time/d).
Statistical analysis
Sociodemographic characteristics were described and compared according to the FFI for F&V consumption using Pearson’s χ 2 test. Means and standard deviations were calculated; medians and interquartile ranges were used for variables with non-normal distributions. Values of serum concentrations of β-carotene, lycopene, retinol, vitamin D and tocopherol were square-root-transformed, and serum folate was log-transformed in order to improve normality.
We evaluated the ability of the short FFQ to discriminate individuals according to categories of FFI for F&V consumption. Thus, using linear regression models, we compared the mean values of F&V consumption indicators, carotenoids (β-carotene plus lycopene), tocopherol and folate according to FFI categories, adopting the lowest consumption as reference.
The prevalence and 95 % confidence interval were estimated for each nutritional status indicator (stunting, obesity, anaemia, VAD, FD, VEI and VDI) by the FFI. Poisson regression models were used to compare the prevalence of nutritional disorders for no consumption of F&V (FFI0: consumption of vegetables ≤3 times/month and fruits ≤3 times/week) with usual consumption (FFI1 to FFI4: vegetables ≥1 time/week and fruits ≥4 times/week). All multiple models were adjusted for sex and age.
In order to distinguish those children with multiple nutritional disturbances, a nutritional disorder (ND) was defined and attributed to children who had at least one nutritional problem (with the exception of vitamin D status which was evaluated according to the FFI categories separately, since both an inadequate diet and low exposure to sun are strongly associated to low levels of vitamin D). The means of the FFI for children at nutritional risk were compared with those for children without ND using Student’s t test. A P value ≤0·05 was considered statistically significant. All statistical analyses were conducted with Stata statistical software package version 11·0.
Results
A total of 1225 children living in 734 households (98·0 % of those identified in the census) agreed to participate in the study; mothers or guardians declined participation in thirteen households and two houses were empty. Overall, 1151 children completed the survey. Of them, 702 (61 %) aged more than 4 years and who reported the short FFQ were considered in the analysis.
The mean age of children was 7 (sd 2·0) years (range 4–10·4 years), 50·5 % were female and the majority was mixed race (91 %); 49·5 % of their mothers were <30 years and 43·0 % of them had less than 5 years of schooling. No statistically significant difference was found between children who consumed F&V regularly and children who did not consume F&V and the socio-economic and demographic characteristics (Table 1). Overall, 40 % of the participants did not consume vegetables, 20 % reported fruit intake >2 times/d and only 5 % reported to consume F&V ≥5 times/d (data not shown).
Table 1 Characteristics (%) of the study population according to the Food Frequency Index (FFI) for fruit and vegetable (F&V) consumption; Brazilian children aged 4–10 years (n 702), Acrelândia, Western Brazilian Amazon, December 2007

* FFI0, consumption of vegetables never or ≤3 times/month and fruits ≤3 times/week; FFI1–4, consumption of vegetables ≥1 time/week and fruits ≥4 times/week.
The overall prevalence of nutritional risks was as follows: VDI 30·9 %, VAD 14·8 % and VEI 8·8 % (Table 2). The prevalence of anaemia, stunting, obesity and FD was less than 10 %. Approximately 33 % of children had at least one nutritional disorder. Almost half of those children (45·2 %) were in the lowest category of F&V consumption. The lowest median values of the selected biomarkers were observed in the lowest category of F&V consumption (FFI0). In general, for biomarkers, Hb and HAZ, we found no significant differences across the FFI categories of usual consumption (FFI1, FFI2, FFI3 and FFI4). Thus, we grouped in one category (FFI1–4) children who consumed F&V regularly for comparison with children who did not consume F&V (FFI0) to examine associations between the F&V consumption and nutritional status indicators. Higher prevalence rates of stunting, anaemia, VEI, VDI and ND were observed among children in the lowest category of F&V consumption (FFI0).
Table 2 Serum biomarkers, Hb and anthropometric variables, and prevalence of nutritional disturbances according to the Food Frequency Index (FFI) for fruit and vegetable (F&V) consumption; Brazilian children aged 4–10 years (n 702), Acrelândia, Western Brazilian Amazon, December 2007

IQR, interquartile range; HAZ, height-for-age Z-score; BMIZ, BMI-for-age Z-score; VDI, vitamin D insufficiency; ND, nutritional disorders; VAD, vitamin A deficiency; VEI, vitamin E insufficiency; FD, folate deficiency.
* FFI0, consumption of vegetables never or ≤3 times/month and fruits ≤3 times/week; FFI1–4, consumption of vegetables ≥1 time/week and fruits ≥4 times/week.
† VDI defined as serum vitamin D<75 nmol/l; ND defined as having at least one of the nutritional disturbances except for VDI; VAD defined as serum retinol<0·70 µmol/l; VEI defined as serum tocopherol<11·61 µmol/l; anaemia defined as Hb<110·0 g/l for children under 5 years and Hb<115·0 g/l for children aged 5–10 years; FD defined as serum folate<10 nmol/l; stunting defined as HAZ<−2; obesity defined as BMIZ>2.
The β coefficients of circulating carotenoids, tocopherol and folate (Table 3) between children who did not consume or rarely consumed F&V (FFI0) and each category of consumption of F&V, including the grouping FFI1–4, showed statistically significant differences for carotenes and tocopherol in all FFI categories (except for FFI4). Regarding serum folate concentration, differences according to categories of F&V consumption were not observed.
Table 3 The β coefficients of serum biomarkers for dietary intake of fruits and vegetables (F&V) according to Food Frequency Index (FFI) for F&V in the study population; Brazilian children aged 4–10 years (n 702), Acrelândia, Western Brazilian Amazon, December 2007

Adjusted for sex and age using β coefficient as the mean difference between FFI1–4 categories and FFI0 (reference category).
* Square-root-transformed.
† Log-transformed.
‡ P≤0·05 (compared with FFI0).
Figure 1 describes the prevalence ratio and 95 % confidence between FFI0 and FFI1–4 categories for each nutritional risk or nutritional disorder. The prevalence ratio of children in the FFI0 category was 2 times higher for stunting and VEI, almost 2 times for anaemia and 1·5 times higher for VDI and ND when compared with children in the FFI1–4 category. No statistically significant difference was observed for VAD. The means of FFI categories were significantly lower for children with VEI, VAD, VDI and ND compared with children with no nutritional disorders (Table 4).
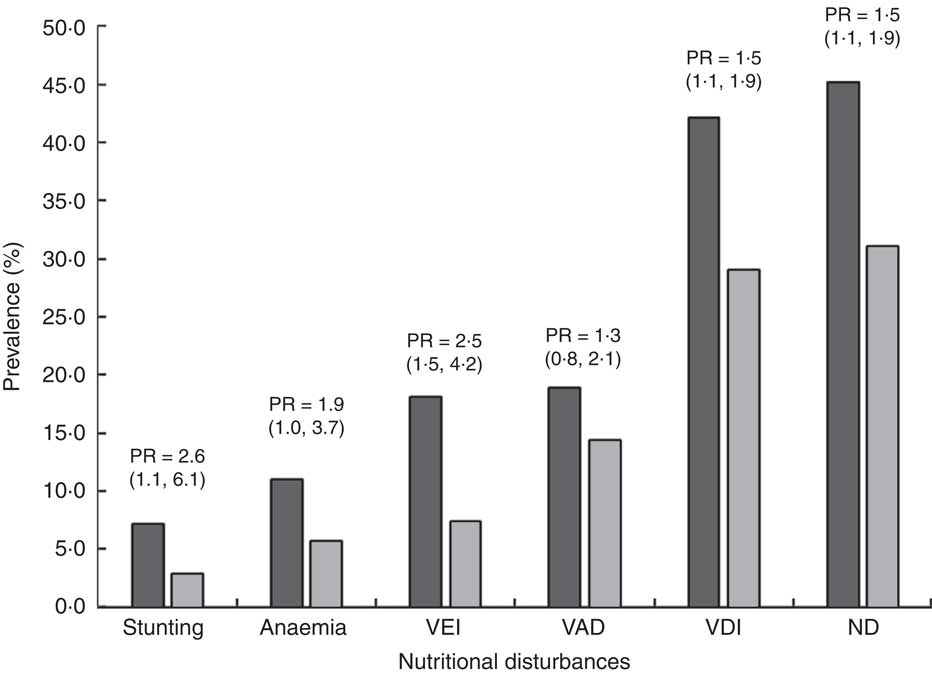
Fig. 1 Prevalence of each nutritional disturbance and prevalence ratio (PR; with 95 % confidence interval in parentheses) for children with no/rare consumption of fruits and vegetables (FFI0; ![]() ) compared with children with regular consumption of fruits and vegetables (FFI1–4;
) compared with children with regular consumption of fruits and vegetables (FFI1–4; ![]() ); Brazilian children aged 4–10 years (n 702), Acrelândia, Western Brazilian Amazon, December 2007. Stunting defined as height-for-age Z-score<−2; anaemia defined as Hb<110·0 g/l for children under 5 years and Hb<115·0 g/l for children aged 5–10 years; VEI, vitamin E insufficiency, defined as serum tocopherol<11·61 µmol/l; VAD, vitamin A deficiency, defined as serum retinol<0·70 µmol/l; VDI, vitamin D insufficiency, defined as serum vitamin D<75 nmol/l; ND, nutritional disorders, defined as having at least one of the nutritional disturbances except for VDI; FFI, Food Frequency Index for fruit and vegetable consumption; FFI0, consumption of vegetables never or ≤3 times/month and fruits ≤3 times/week; FFI1–4, consumption of vegetables ≥1 time/week and fruits ≥4 times/week
); Brazilian children aged 4–10 years (n 702), Acrelândia, Western Brazilian Amazon, December 2007. Stunting defined as height-for-age Z-score<−2; anaemia defined as Hb<110·0 g/l for children under 5 years and Hb<115·0 g/l for children aged 5–10 years; VEI, vitamin E insufficiency, defined as serum tocopherol<11·61 µmol/l; VAD, vitamin A deficiency, defined as serum retinol<0·70 µmol/l; VDI, vitamin D insufficiency, defined as serum vitamin D<75 nmol/l; ND, nutritional disorders, defined as having at least one of the nutritional disturbances except for VDI; FFI, Food Frequency Index for fruit and vegetable consumption; FFI0, consumption of vegetables never or ≤3 times/month and fruits ≤3 times/week; FFI1–4, consumption of vegetables ≥1 time/week and fruits ≥4 times/week
Table 4 Means and standard deviations of the Food Frequency Index (FFI) for fruit and vegetable consumption according to the presence of nutritional disturbances (yes or no); Brazilian children aged 4–10 years (n 702), Acrelândia, Western Brazilian Amazon, December 2007

VEI, vitamin E insufficiency; VDI, vitamin D insufficiency; VAD, VAD, vitamin A deficiency; ND, nutritional disorders.
* VEI defined as serum tocopherol<11·61 µmol/l; VDI defined as serum vitamin D<75 nmol/l; VAD defined as serum retinol<0·70 µmol/l; ND defined as having at least one of the nutritional disturbances except for VDI.
Discussion
In our study, children who did not consume F&V had greater nutritional risks when compared with children who frequently consumed F&V, with significantly higher prevalence of VDI, VAD, VEI, anaemia and stunting, as well as the lowest median values for serum vitamins D and E, and HAZ.
We also observed that the median values of serum biomarkers were significantly lower among children who did not consume F&V. However, these values were not different across the FFI categories of usual F&V consumption, suggesting that the short FFQ was able to identify nutritional risks for children with very low F&V consumption, but it could not rank individuals according to F&V usual intake. Previous studies that used short FFQ with children also found similar results( Reference Lillegaard, Overby and Andersen 10 , Reference Vereecken, Rossi and Giacchi 38 ).
Some authors( Reference Cade, Thompson and Burley 39 , Reference Marks, Hughes and Van der Pols 40 ) believe that short FFQ may overestimate F&V intake, due to the bias of ‘socially acceptable’ consumption. Despite the possibility of occurrence of this type of error, it does not preclude the use of the short FFQ since this error is common to all children, independent of the amount of F&V consumed. Therefore, considering the analysis and interpretation adopted in the present study, the use of the short FFQ was feasible, since the use was limited to its ability to distinguish individuals who do not consume or rarely consume F&V. Despite the nutritional status of most children in our study requiring attention, the screening provided by the short FFQ indicates that priority should be directed to the health of children who do not consume/rarely consume F&V, since the occurrence of nutritional deficiencies (VDI, VEI, anaemia, stunting and ND) was generally twice that in children who consume F&V with some regularity.
Few studies measuring the association between F&V intake and nutritional risk in children have been conducted, and most of them have weight status as the main outcome( Reference Miller, Moore and Kral 41 ), which makes difficult the comparison with other results.
Serum folate is also considered a biomarker of usual F&V consumption( Reference Brevik, Vollset and Tell 42 ). In the present study, we observed a low prevalence of FD and no significant associations were found between serum folate and FFI categories. One hypothesis to explain the low rate of FD without associations between serum folate and FFI categories is that other dietary sources of folate such as beans, meat and fortified flours (in Brazil, flours are fortified with folic acid and Fe) supply the required amount of this vitamin. In populations who consume fortified foods, folate is not considered a good indicator of F&V consumption( Reference Brevik, Vollset and Tell 42 ). Data on consumption of flours were not collected in the present study but more than 80 % of children had consumed beans and meat daily. Similarly, the consumption of beans, meat and flour may explain the low prevalence of anaemia, especially among children who consumed F&V (prevalence of 5·6 %), since these foods contain substances that facilitate absorption of Fe. Few studies on the prevalence of FD and anaemia with representative samples of schoolchildren are available in Brazil, precluding national comparisons. Global estimates( 43 ) in children aged 5–14 years indicate prevalence of anaemia of 25·4 % that is four times higher than was found in our study (6·3 %). Nevertheless, the screening performed by the short FFQ highlighted differences in the prevalence of anaemia, which was found to be twice as high in the group with the lowest consumption of F&V (11·0 %).
Regarding vitamin A, the WHO( 33 ) considers VAD a public health problem at prevalence of <10 % (low), 10–20 % (moderate) and ≥20 % (severe). In the present study, VAD was considered a moderate public health problem and it was close to reaching a severe level among children with the lowest consumption of F&V (19·0 %). The global estimate of VAD in children of pre-school age is approximately 33 %, constituting a moderate or severe problem in 70 % of countries worldwide( 33 ). Few studies in schoolchildren are available, but the WHO( 33 ) states that the deficiency in many cases extends into adulthood. A literature review by Singh and West found a VAD prevalence of 23·4 % in South-East Asia among school-aged children( Reference Singh and West 44 ). Fares et al.( Reference Fares, Chahed and Feki 45 ) found that 19·3 % of children 5–7 years of age had VAD in Northern Africa. These prevalence rates are close to the rates found in the present study among those children with the lowest consumption of F&V. This finding demonstrates the urgent need for nutritional interventions in Brazil, given the fact that South-East Asia and Africa are regions associated with the highest prevalence of VAD in children worldwide( 33 ).
VAD is caused by low consumption of foods rich in vitamin A, and also by poor absorption and high excretion due to disease. In addition, VAD compromises growth and lowers resistance to infection, while recurrent infections can contribute to the deficiency( 33 ). This is a concern, particularly among children residing in the Brazilian Amazon region, where there is high exposure to aetiological agents. According to the Pan American Health Organization( Reference McLaren and Frigg 46 ), the main dietary sources of carotenoids in developing countries are vegetables (provitamin A). The association found in our study between serum carotenoids and retinol indicated a positive linear relationship, i.e. high carotenoids levels were associated with high serum retinol levels (data not shown), justifying the importance of F&V consumption. We did not find an association between the consumption of F&V and VAD. The explanation might be due to the fact that serum retinol is not considered a good biomarker for dietary intake or nutritional status, because it is tightly regulated by the mobilization of hepatic reserves.
For vitamin D levels, risk factors for insufficiency in children include inadequate intake, low sun exposure, dark skin, lack of physical activity, obesity and low socio-economic level( Reference El-Hajj Fuleihan, Nabulsi and Choucair 47 , Reference Absoud, Cummins and Lim 48 ). Although the study area has high amounts of sunshine, a large number of children (~31 %) had vitamin D levels below 75 nmol/l while 8 % had levels <50 nmol/l. However, it should be noted that 91 % of children in the current study were not white, a fact that could increase the risk of deficiency since people with dark skin synthesize less vitamin D when exposed to sunlight than those with white skin( Reference Holick 49 ). In Brazil, few studies have investigated the nutritional status of vitamin D in all age groups. Mansbach et al. ( Reference Mansbach, Ginde and Camargo 50 ) found prevalence of 60 % for vitamin D levels <75 nmol and 30 % for <50 nmol/l, respectively, in American children despite fortified food. Their finding may be explained by the low exposure to the sun and high prevalence of obesity in that area. In our study, children were generally from low-income families, had no access to foods fortified with vitamin D, took no vitamin supplements and had low consumption of foods rich in vitamin D. The association observed between serum vitamin D and consumption of F&V is most likely related to the better overall quality of diet in children who consumed F&V.
In relation to vitamin E levels, data from the first National Health and Nutrition Examination Survey (NHANES I) showed mean values of 17·1 µmol/l and a 9·7 % prevalence of VEI (<11·6 µmol/l) for Mexican children aged 6–11 years living in the USA( Reference Looker, Underwood and Wiley 35 ). In 2000, results from NHANES III in children aged 4–8 years found a mean vitamin E level of 18·4 µmol/l( 51 ). The overall prevalence of VEI found in our study was similar to those values reported in NHANES data, but higher frequency of VEI was found among children in the lowest category of F&V consumption (18·1 % VEI for FFI0). These results are close to data from a cross-sectional study in African school-aged children (25·6 % VEI)( Reference Fares, Chahed and Feki 45 ).
Some limitations need to be considered when interpreting our results since our study design is not appropriate for causal inferences. Thus, although socio-economic conditions and long-term exposure to inadequate diet are important determinants of nutritional status during childhood, in the present cross-sectional analysis associations between consumption of F&V and socio-economic variables could not be detected. Although recent improvements have been reported in child health in Brazil( Reference Victora, Aquino and do Carmo Leal 52 ), it is noteworthy that in our study the prevalence of stunting among children who do not consume F&V is 2·6 times greater than among other children and the occurrence of ND is 50 % higher. This nutritional scenario identified in our study imposes the need for immediate actions of public health interventions in the local context, as these children live in a region of high social vulnerability, with a low human development index and poor sanitation conditions (sewage treatment where approximately 40 % of the population lacks clean water for consumption), which may predispose children to a poor nutritional status. The region offers a broad variety of fruits such as mango, papaya, acerola, starfruit, tamarind, pineapple, cupuaçu, soursop and jackfruit, among others. F&V production by family farms, in conjunction with interventions for disease prevention and the appreciation of local food, should be encouraged to increase the sustainable consumption of F&V. The World Bank estimates that the cost of not intervening to overcome nutritional deficiencies is ten times greater than the cost of intervention programmes( Reference Horton, Shekar and McDonald 53 ).
In many developing countries, regional data on F&V consumption from representative samples, as well as on the prevalence of nutritional deficiencies is scarce in children. These data are necessary for the planning and development of public policies and also intervention programmes for the prevention, treatment and screening of nutritional deficiencies in high-risk populations.
Conclusion
In conclusion, low F&V consumption assessed by the short FFQ was shown to be associated with greater nutritional risks. Effective actions in public health and local agriculture promoting greater consumption of and access to healthy foods, especially fruits and vegetables, are necessary.
Acknowledgements
Financial support: This study was funded by the National Council for Scientific and Technological Development of Brazil (CNPq; grant numbers 551359/2001-3, 502937/2003-3, 307728/2006-4 and 470573/2007-4); the Fundação de Amparo à Pesquisa do Estado de São Paulo (FAPESP; grant number 2007/53042-1); and by the Coordenação de Aperfeiçoamento de Pessoal de Nível Superior (CAPES; Ministry of Education of Brazil, grant number 0091081). F.C. and R.A.A. received post-doctoral scholarships from CNPq (grant number 159636/2010-8) and CAPES (grant number 009108), respectively. The funders of this study had no role in the design, analysis or writing of this article. Conflict of interest: None. Authorship: R.A.A. analysed and interpreted data and wrote the initial manuscript draft; F.C. and M.A.C contributed to data analyses and to the initial draft of the paper; M.A.C. implemented and supervised all study protocols and data collection and was responsible for project management. All authors reviewed the manuscript and approved the final version submitted for publication. Ethics of human subject participation: The study protocol was approved by the Ethics Committee of the School of Public Health, University of São Paulo. The study was conducted according to the guidelines laid down in the Declaration of Helsinki and written informed consent was obtained from all parents or guardians of participating children.
Appendix
The ACTION (ACre nutriTION) Study Team
Pascoal Torres Muniz, Orivaldo Florencio Souza, Cristieli Sergio de Menezes Oliveira and Thiago Santos de Araujo (Department of Health Sciences, Federal University of Acre, Rio Branco, Brazil); Suely de Godoy Agostinho Gimeno and Luciana Yuki Tomita (Department of Preventive Medicine, Federal University of São Paulo, São Paulo, Brazil); Marcelo Urbano Ferreira (Institute of Biomedical Sciences, University of São Paulo, São Paulo, Brazil); Kézia K.G. Scopel (Department of Parasitology, Immunology and Microbiology, Federal University of Juiz de Fora, Juiz de Fora, Brazil); Barbara Hatzlhoffer Lourenço, Pablo Secato Fontoura, Fernanda Serra Granado, Fernanda Cobayashi, Rosangela Aparecida Augusto and Marly Augusto Cardoso (Department of Nutrition, School of Public Health, University of São Paulo, São Paulo, Brazil).


