


South Asians have a higher risk of developing obesity and type 2 diabetes (T2DM) than other populations(1–Reference Zahid, Claussen and Hussain5). Early life conditions, genetics and lifestyle factors, such as dietary habits, physical inactivity and obesity, have been suggested to explain this higher disease rate(Reference Misra, Misra and Wijesuriya6). In Norway, people from Pakistan constitute the largest ethnic minority group(Reference Blom and Henriksen7). Pakistani women living in Oslo are at higher risk of developing obesity and T2DM than the men(Reference Jenum, Holme and Graff-Iversen8, Reference Kumar, Meyer and Wandel9).
Earlier studies, both quantitative and qualitative, have been carried out to determine the intake of foods and nutrients in South Asian populations after immigration to Western countries(Reference Wandel, Raberg and Kumar10–Reference Mellin-Olsen and Wandel13). The main dietary changes reported are reduction in fibre intake and increased consumption of animal fats and processed carbohydrates. Such changes are associated with an increased predisposition of T2DM(Reference Hu, van Dam and Liu14–Reference Meyer, Kushi and Jacobs17). The food changes reported by Pakistani immigrants in Western countries are increased consumption of meat, oil, fruits, sugar, dairy products, fish and boiled potatoes and reduced intake of traditional foods, such as legumes and vegetables(Reference Wandel, Raberg and Kumar10, Reference Mellin-Olsen and Wandel13, Reference Misra and Vikram18, Reference Wandel19).
In Norway, nutrition information has generally been given with the ethnic Norwegian population in mind. Norwegian health personnel often encounter challenges when offering nutrition information to immigrants(Reference Mellin-Olsen and Wandel13, Reference Fagerli, Lien and Wandel20). Many immigrants with a Pakistani background living in Norway have a low level of education(Reference Blom and Henriksen7). Illiteracy is one of the most significant barriers to health, as it makes it hard to access health care and health information(21). In Pakistani communities in Europe, illiteracy tends to be more frequent when the person is female, older and Punjabi speaking(Reference Hawthorne and Tomlinson22). Nutrition information programmes adapted to the culture and life situation of the participants are more likely to have positive effects in terms of lifestyle changes(Reference Fagerli, Lien and Wandel20).
The present study reports results from an intervention study among Pakistani women, which included a combination of group sessions, individual counselling and organised exercise groups. The sessions and counselling focused on prevention of diabetes through diet and physical activity, and were culturally adapted for the participant group. Here, the objective is to present the effect of the intervention on the participants’ intentions to change dietary behaviour as well as changes in the intake of selected foods.
Methods
Study design
The InnvaDiab study was an intervention conducted in Oslo. Data collection started in April 2006 and ended in May 2008. Demographic data were collected right before the start of intervention (baseline). Height was measured at baseline, whereas weight was measured at baseline and right after the 7-month intervention (follow-up). Data on dietary intake and factors that may influence dietary choices were collected at baseline and follow-up through an interview carried out by Urdu- and/or Punjabi-speaking interviewers with the help of a questionnaire. The questionnaire contained FFQ and questions related to their intentions to change the intake of selected foods.
The present study was conducted according to the ethical principles as per the World Medical Association Declaration of Helsinki. The Norwegian Data Inspectorate approved the study and it was cleared by the Regional Committee for Medical Research Ethics.
Recruitment and participants
A multirecruitment strategy was carried out to invite women to participate – general practitioners (GP) were contacted, staff members visited mosques and language courses and participants spread the word. The women were given a verbal invitation to participate in the project. As many women in this group have a low level of literacy, oral information is much more comprehensive and reaches more people.
Inclusion criteria were women living in Norway and born in Pakistan or women born in Norway by two Pakistani parents and 25 years or older. Exclusion criteria were a history of T2DM ≥ 6 months, cardiovascular complications, CHD, close relative included in the project, pregnancy or not physically able to walk for 1 h. One hundred and ninety-eight women were included in the present study and were randomised into an intervention and a control group.
The intervention
The intervention group was divided into nine subgroups of ten to twelve women. The women were successively assigned to the groups. Each subgroup had six sessions, lasting 2 h, during the 7 months of intervention. The group sessions were focused on the importance of diet and physical activity for blood glucose regulation. They were aimed at helping the women to incorporate knowledge acquired in the group sessions into their everyday lives. Culturally adapted audiovisual materials were used and discussions were encouraged. The participants were encouraged to reduce sugar and refined carbohydrates, and change to more complex carbohydrates, to eat more fatty fish, vegetables, beans, lentils and fruits in line with their traditional diet. The group sessions also included efforts to raise awareness with regard to the amount of fat used in cooking, and the participants were encouraged to change the type of fat from butter/margarine/vegetable oil to rapeseed oil. The participants were also given dietary advice individually, based on their blood tests. The control group did not receive lifestyle advice except for the advice that they might have received by their GP or at the health-care centre. They were offered one (short version) group session after the follow-up tests.
Questionnaires
The FFQ was based on earlier studies conducted in Norway(Reference Kumar, Meyer and Wandel9, Reference Mellin-Olsen and Wandel13, Reference Lorentzen, Ommundsen and Jenum23) as well as DE-PLAN(Reference Schwarz, Lindstrom and Kissimova-Scarbeck24). The dietary questions from the Norwegian study were validated for ethnic Norwegians(Reference Mosdøl25) and modified after pilot studies to the Pakistani population, as described by Wandel et al.(Reference Wandel, Raberg and Kumar10). The dietary questions from the DE-PLAN were validated for the Finnish population(Reference Schwarz, Lindstrom and Kissimova-Scarbeck24).
The participants were asked to report from their usual diet in recent months. To improve the reporting of portion sizes, the ‘Picture pamphlet with portion sizes’, developed by the Norwegian Food Safety Authority, the Norwegian Directorate of Health and the Department of Nutrition at the University of Oslo, was used to estimate the intake of drinks and amount of oil used in curries. In addition, selected pictures from ‘Matmalen’, developed by the Swedish National Food Administration, were used.
The stages of change construct from the Transtheoretical Model (TTM) was used to study the intentions to change dietary habits. It has been used to identify the most effective efforts for interventions, and to measure motivational change as the result of the intervention. According to this theory, change involves progress through a series of five stages(Reference Glanz, Rimer and Lewis26–Reference Verheijden, Bakx and Delemarre30). The participants were asked about their intentions to increase/reduce intake of certain foods (vegetables, legumes, fruit, sugar, white flour and amount of fat) and to change the type of fat used in curries. They could respond according five categories: (i) pre-contemplation: ‘I have not changed my behaviour for the past 6 months, and I am not planning to do for the next 6 months’; (ii) contemplation: ‘I have not changed my behaviour for the past 6 months, but I am considering doing so within the next 6 months”; (iii) preparation: ‘At the moment, I am trying to change my behaviour, but not on a regular basis’; (iv) action: ‘During the past 6 months, I have changed my behaviour’; and (v) maintenance: ‘I changed my behaviour ≥6 months ago’.
Analyses and variables
The Statistical Package for the Social Sciences statistical software package version 16.0 (SPSS Inc., Chicago, IL, USA) was used for data analysis. To explore and describe data and characteristics of the samples, frequency tables, estimation of means and medians with corresponding CI and/or percentiles were used. Differences in food intake from baseline to follow-up within the control and the intervention group, respectively, were tested by the Wilcoxon signed-rank test. Differences between groups were analysed by the Mann–Whitney U-test. Chi-squared tests analysed the differences in categorical variables between the groups, whereas the McNemar’s test was used to analyse differences in correlated proportions in the action stages between baseline and follow-up.
Both categorical and continuous variables were used to estimate the food intake. Intake of fruits and vegetables was collected as portions per day or week and converted into g/d by multiplying portion sizes with frequencies. Intake of drinks was collected as glasses per day or week and converted into dl/week. Intake of sweet bakery goods was collected as portions per day or week and was analysed in portions/week. Intake of white bread was collected as slices per day or week and converted into g/week by multiplying the number of slices with estimated weight. Oil was collected as litres purchased per week or month or decilitres per dish, and converted into g purchased/month and g/dish.
When analysing stages of change (differences in distribution or change in distribution from baseline to follow-up between groups), the categories were aggregated to (i) pre-action (pre-contemplation, contemplation and preparation) and (ii) action (action and maintenance). All outliers were kept. A significance level of P < 0·05 was chosen for the analyses.
Analyses were performed to compare the change in intake data from baseline to follow-up in the intervention and control group (intention-to-treat analyses). However, not all of the women in the intervention group came to the group sessions, and some came only to one or two sessions. Therefore, treatment received analyses (TRA) were performed to compare participants having attended at least 60 % of the group sessions (four out of six) with the control group.
Results
Participant profile
The participants’ profiles are shown in Table 1. The participants, aged 25–63 years, were all living in a suburb containing the highest proportion of Pakistani immigrants in Oslo. About one-quarter of the women reported ≤7 years of education, and 40–50 % reported poor or very poor Norwegian language skills. The prevalence of overweight (BMI > 25 kg/m2) was 83·7 and 76·0 % in the control and intervention group, respectively. In the control and in the intervention group, 62 and 60 %, respectively, scored above the Asian-specific cut-off (BMI ≥ 27·5 kg/m2) for high health risk(31).
Table 1 Baseline demographic and socio-economic status of the participants in control and intervention groups
*The WHO Expert Consultation Group has recommended the use of Asian-specific cut-off points for BMI in order to identify those at increased health riskReference Glanz, Patterson and Kristal(35).
Intention to change dietary behaviour
Regarding intentions to reduce the fat intake, there were small and insignificant differences between the control and intervention groups at baseline. At follow-up, there was a shift (P < 0·001) from the pre-action (pre-contemplation, contemplation and preparation) stages to the action stage in the intervention group (Fig. 1a), but not in the control group (Fig. 1b). The difference between the groups at follow-up was significant (P = 0·002). At baseline, there was no significant difference between the control and intervention groups regarding intentions to change the type of fat. At follow-up, there was a shift in the intervention group from pre-action to action (P = 0·007). This was not observed in the control group, and the difference between the groups at follow-up was significant (P = 0·004).
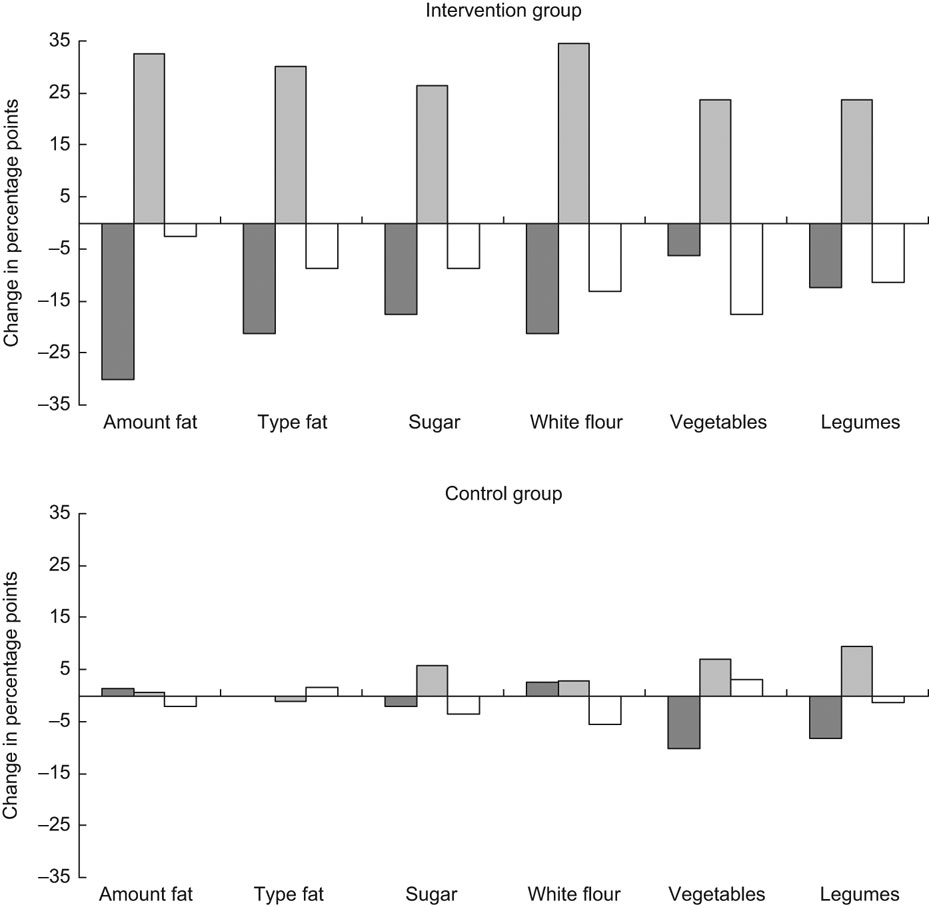
Fig. 1 Change in the distribution profile for the pre-action (![]() ) (pre-contemplation, contemplation and preparation), action (
) (pre-contemplation, contemplation and preparation), action (![]() ) and maintenance (□) stage between baseline and follow-up for intention to reduce fat intake, change type of fat, increase vegetable and legume intake, reduce sugar and white flour intake. Intervention group, n 78; control group, n 73. Differences in proportions in pre-action and action (action and maintenance) stages between the control and intervention groups were significant (P ≤ 0·001) at follow-up for intention to reduce the intake of fat and sugar and change the type of fat, and (P ≤ 0·02) to reduce the intake of white flour and increase the intake of vegetables and legumes. There was a significant (P ≤ 0·02) change from pre-action to action from baseline to follow-up for intention to reduce the fat intake, change the type of fat and to reduce the sugar and white flour intakes
) and maintenance (□) stage between baseline and follow-up for intention to reduce fat intake, change type of fat, increase vegetable and legume intake, reduce sugar and white flour intake. Intervention group, n 78; control group, n 73. Differences in proportions in pre-action and action (action and maintenance) stages between the control and intervention groups were significant (P ≤ 0·001) at follow-up for intention to reduce the intake of fat and sugar and change the type of fat, and (P ≤ 0·02) to reduce the intake of white flour and increase the intake of vegetables and legumes. There was a significant (P ≤ 0·02) change from pre-action to action from baseline to follow-up for intention to reduce the fat intake, change the type of fat and to reduce the sugar and white flour intakes
Regarding intentions to reduce the sugar intake, there was no significant difference between the control and intervention groups at baseline. At follow-up, there was a shift (P = 0·019) from pre-action to action in the intervention group. This was not observed in the control group, and the difference between the control and intervention groups at follow-up was significant (P < 0·001).
Regarding intentions to change the consumption of white flour, similar results were observed as those discussed above. No difference between the control and intervention groups was found at baseline. There was a significant shift into action from baseline to follow-up in the intervention group (P = 0·004), and at follow-up, there was a significant difference in intentions between the control and intervention groups (P < 0·001). Regarding vegetables and legumes, there were large shifts in both action and maintenance, positive for the former and negative for the latter. As some regressed from the maintenance stage, the movement from pre-action to the collective action stages (including action and maintenance) was not significant. There was a significant difference in distribution of pre-action and action stages between the control and intervention groups at follow-up (P = 0·003 for vegetables P = 0·020 for legumes). Regarding intentions to increase the intake of fruits, no differences between the control and intervention groups were found, at baseline, follow-up or for change.
Changes in the intake of foods and drinks from baseline to follow-up
Table 2 shows the results from baseline and follow-up regarding drinks with and without sugar. A significant reduction in the intake of soft drinks with sugar was found for the intervention group (P < 0·001), and the change in the intake varied significantly from the control group (P < 0·001). Furthermore, TRA revealed a significant reduction in the intake (P = 0·001), and the difference between the control and the ‘as treated’ groups was significant (P < 0·001). The intake of soft drinks without added sugar was reduced in both the control and intervention groups; however, no significant change or difference was found. TRA revealed no significant differences. The change in the intake of fruit drinks with sugar added was significantly reduced in the intervention group (P = 0·007), and the difference between the control and intervention groups was significant (P = 0·022). The ‘as treated’ group’s intake was significantly reduced from baseline to follow-up (P < 0·001), and the difference between the control and the ‘as treated’ groups was significant (P = 0·003).
Table 2 Intake of drinks with and without added sugar in the control and intervention groups at baseline and follow-up
TRA, treatment-received analyses.
*P25, 25th percentile; P75, 75th percentile.
†Wilcoxon’s signed-rank-sum test.
‡Mann–Whitney U-test for difference in change between intervention and control groups.
The total intake of vegetables, fruits and fruit juice increased by 46·5 g from baseline to follow up in the intervention group (P = 0·043; Table 3). This was not observed in the control group; however, the difference between the groups was not significant. The total intake of vegetables, fruits and fruit juice increased by 75 g in the ‘as treated’ group (P = 0·011). There was no significant difference in change between the control and ‘as treated’ groups. The intake of red meats was reduced significantly in the intervention group (P = 0·001), but not in the control group. However, the difference between the control and intervention groups was not significant. TRA revealed a significant reduction in the intake of red meats (P = 0·007), but the difference between the control and ‘as treated’ groups was not significant. The intake of chicken was reduced significantly in the control group (P = 0·028). This was not observed in the intervention group, but the difference between the groups was not significant. There were no significant differences between the control and ‘as treated’ groups. The total intake of fish increased in both groups, however, only significantly in the control group (P = 0·009), and there was no significant difference between the control and intervention groups. TRA showed a significant increase in the intake (P = 0·032), but the difference between the ‘as treated’ and the control groups was not significant.
Table 3 Intake of fruits and vegetables, meat, chicken and fish in the control and intervention groups at baseline and follow-up

TRA, treatment-received analyses.
*P25, 25th percentile; P75, 75th percentile.
†Wilcoxon’s signed rank-sum test.
‡Mann–Whitney U-test for difference in change between intervention and control groups.
The reported amount of oil used in curries was reduced in the intervention group and increased in the control group, but not significantly (results not shown). There was no difference between the groups. TRA did not reveal any significant change, and no significant difference between the ‘as treated’ and the control groups. The amount of oil purchased per month was reduced for both the control and intervention groups, however, not significantly. The difference between the control and intervention groups was not significant. TRA showed a borderline reduction (P = 0·089), but there was no significant difference between the control and the ‘as treated’ groups.
The intake of full fat milk and yoghurt was reduced in both groups from baseline to follow-up, but only significantly in the intervention group (P = 0·027). The difference between the control and intervention groups was not significant. TRA showed no significant change from baseline to follow-up, and no difference between the ‘as treated’ group and the control group.
Table 4 shows the reported type of oil used in deep-fries and curries at baseline and follow-up. There were no differences between the control and intervention groups at baseline. More women in the intervention group reported to use olive and rapeseed oil at follow-up (P ≤ 0·011), while the use of vegetable oil was reduced (P = 0·007). The difference between the control and intervention groups was significant for rapeseed oil at follow-up (P = 0·001). Regarding the changes in the use of sunflower and vegetable oil, there were borderline differences between the control and intervention groups at follow-up. TRA showed a significant reduction in the use of vegetable oil, and a significant increased use of olive oil from baseline to follow-up (P < 0·050). There was a significant difference between the ‘as treated’ and the control groups for the use of rapeseed oil at follow-up (P = 0·001).
Table 4 Type of oil used in deep-fries and curries in the control and intervention groups at baseline and follow-up
TRA, treatment-received analysis; NA, not applicable.
*McNemar’s test for difference in correlated proportions of matched-pair samples (baseline and post-test).
†χ2 for 2 × 2 table (continuity correction) at follow-up.
‡Control n 74; intervention n 75; TRA n 58.
Intake of other foods
The intake of white bread was reduced in the intervention group, however, not significantly. In the control group, there was an increased intake of white bread. The difference between the control and intervention groups was not significant. The daily intake of sweet bakery goods had increased in the control group (P = 0·022), while it was reduced in the intervention group. There was no significant difference between the groups. Regarding the intake of sugar, honey and sweets, the daily intake was reduced in the intervention group, however, not significantly, while it increased in the control group. There was no significant difference between the control and intervention groups.
Discussion
Studies have shown that reaching South Asian immigrant women with health information and health education is challenging due to several factors: illiteracy, low level of education and poor skills in the language of the host country(Reference Hussain-Gambles, Atkin and Leese32). Furthermore, some of the women experience restrictions imposed on them by their families such as going out alone or talking to health workers of the opposite sex without a chaperon present(Reference Hawthorne33). They may also have different health beliefs and behaviours than people in the host country. Thus, South Asians are often excluded from trials due to the increased cost and time associated with their inclusion. Therefore, there is a lack of research regarding this group.
A multirecruitment strategy has been recommended in order to reach South Asian population groups(Reference Hussain-Gambles, Leese and Atkin34), and this was followed in the InnvaDiab study. As random sampling was not used, there is a risk of selection bias. However, the participants’ profile is similar to that reported by Statistics Norway on Pakistani immigrants in Norway(Reference Blom and Henriksen7, Reference Kumar, Meyer and Wandel9). Around 80 % of the women were overweight (BMI ≥ 25 kg/m2), similar to the results from the Oslo Health Study(Reference Kumar, Meyer and Wandel9). After the inclusion, the women were randomised into a control and an intervention group. It is possible that, due to self-selection, participants in both groups may have been more motivated to change than the represented population.
In order to achieve dietary change, long-established patterns of eating habits and behaviour need to be changed or given up. Dietary behavioural change is a complex process, and it is believed that people’s intentions are important in this process(Reference Glanz, Patterson and Kristal35, Reference Kristal, Hedderson and Patterson36). Assessing stage of dietary change is challenging, as the validity of self-reported stage of change depends on people’s knowledge and awareness of their diet(Reference Curry, Kristal and Bowen37). People may move from one stage to the next and back, but may also be categorised into more than one stage at one point(Reference Povey, Conner and Sparks38).
The present study showed that some women in the intervention group regressed from the maintenance to the earlier stages. This might be due to an increased awareness of the gap between recommendations for healthy eating and their own diet. However, in spite of this regression, there was an overall increase in motivation to change in the intervention group. Moving from one stage to the next can be used as an indicator of the effectiveness of the intervention(Reference Glanz, Patterson and Kristal35, Reference Kristal, Hedderson and Patterson36). Findings from the present study suggest that the intervention succeeded in the motivation to change diet among the participants. However, there is a risk that the women ‘over-reported’ what stage they were in at follow-up in order to please the project personnel.
The use of FFQ to measure changes in food intake has some challenges. Firstly, the intake is self-reported, and is subjected to recall bias. Furthermore, the process of answering the FFQ may raise awareness about healthy eating, and thereby possibly influence the actual intake. Responses to the FFQ may also be subject to social desirability bias, especially in the intervention group. However, only some of the foods that were targeted in the intervention had changed. This increases the likelihood that differences stem from a real intervention effect. The successive start of group sessions following the recruitment of new women in the present study spread the timing of intervention and collection of data around the year, minimising the possibility that changes in intakes were due to seasonal variations.
Many of the women reported changes in dietary intake from baseline to follow-up. The intervention group reported a reduced intake of sugar-rich drinks, which was in accordance with their reported intentions. The mean intake of sugar-rich drinks was 7·3 dl/week at baseline and 3·3 dl/week at follow-up in the intervention group. Data on the general population in Norway show that women in the age group of 40–49 years have a mean intake of soft drinks of 13·2 dl/week, whereas the mean intake among women aged 50–59 years is about 7·2 dl/week(Reference Johansson and Solvoll39). The women in the present study were similar to the latter group; however, at follow-up, the intake was much lower. Under-reporting has been found to be more frequent in subjects with a high BMI(Reference Rasmussen, Matthiessen and Biltoft-Jensen40). As the majority of the women in the present study were overweight, under-reporting of unhealthy foods cannot be ruled out.
Favourable changes were observed regarding the purchase and use of oil. However, these changes were not significant. More women used oils rich in MUFA and PUFA after the intervention, and less used vegetable oil, which is a mix of different types of oils. Vegetable oil often contains palm oil, which has more SFA. These changes, together with the reduction in intake of full-fat milk and yoghurt and the reduction in intake of red meats, are in accordance with the results on the women’s intentions to change the intake of fat. However, only the change in the type of fat used and the reduction in the intake of sugar-added drinks resulted in significant differences between intervention and control groups after follow-up. Blood sugar regulation was the main theme of the group sessions. Due to this, reduction of sugar intake may have been perceived as the most urgent dietary change to the participants. Regarding the use of oil, reducing the amount of fat in food has previously been shown to be difficult, due to change in taste and appearance of dishes, which is not socially acceptable(Reference Mellin-Olsen and Wandel13). Changing the type of oil may cause smaller visible alterations or changes in taste, making this change easier to adopt than reducing the amount of oil.
The total intake of vegetables, fruits and fruit juice increased in the intervention group, in agreement with their intentions, except for fruits. It has been found that reporting portion sizes for both fruits and vegetables and the amount usually eaten is challenging(Reference Ashfield-Watt41–Reference Ma, Betts and Horacek43). Underreporting of vegetables is likely to occur in this group, as they may not have accounted properly for the vegetables used in curries. The women’s low educational level might also have affected their intake(Reference Ervin44).
The total amount of vegetables and fruits at follow-up added up to 392·1 g/d in the intervention group; 82·6 g of this came from fruit juice. In the control group, the total intake at follow-up was 328·3 g/d, where 57·9 g came from fruit juice. These amounts of vegetables and fruits are only half or less of the Norwegian recommendations, which is 750 g/d(45). It has been reported that Pakistani women living in Pakistan have a mean intake of vegetables and fruits, not including fruit juice, of about 350g/d(Reference Lock, Pomerleau and Causer46), indicating that the intake of vegetables and fruits is lower after the arrival in Norway, which has been reported elsewhere(Reference Mellin-Olsen and Wandel13). The women in the present study have explained the reduced intake by the higher cost, lower quality and freshness, and decreased availability in Norway compared with Pakistan(Reference Kårstad47).
In conclusion, our results imply that culturally adapted education has the potential to change Norwegian–Pakistani women’s intentions to make their diet healthier, and that the stages of change construct can be used to describe these intentions. Furthermore, such interventions may induce beneficial, however modest, self-reported changes in diet, according to the emphasis on dietary-favourable foods of the group sessions.
Acknowledgements
The study was supported by the Norwegian Research Council (166977/v50); the Diabetes in Europe – Prevention using Lifestyle, Physical Activity and Nutritional Intervention (DE-PLAN) Project (2004310); and the Throne Holst Foundation (2875). M.W. and G.H.-O. planned and supervised the project. B.B. and V.T.H. conducted the intervention and coordinated data collection. K.S.J. did the statistical analyses and the drafting of the article. All authors contributed in the final stage of the writing. Many people had contributed in different stages of the project. We want to especially thank Monica Morris and Aisha Asghar Ali, and all the participating women who spent their time and shared their knowledge and experiences with us. There is no conflict of interest to declare.


