


In the UK, 60 % of adults are overweight or obese, a condition associated with increased risk of chronic health conditions such as diabetes and heart disease( 1 ). With the prevalence of obesity expected to reach 70 % in the next 20 years( 1 ), it is important to develop solutions to counter this rising trend. The intake of energy-dense foods is one risk factor for obesity( Reference Swinburn, Caterson and Seidell 2 ), as energy intake exceeding energy expenditure leads to weight gain( Reference Jequier and Tappy 3 ). Therefore measures to curb obesity include interventions to improve people’s understanding of the amount of energy that is provided by food( Reference Storcksdieck genannt Bonsmann and Wills 4 ). Energy is consistently included as key information in nutrition labelling in Europe( Reference Storcksdieck genannt Bonsmann, Férnández Celemín and Larrañaga 5 ), highlighting that it should be a key consideration in making healthy food choices.
Studies suggest that providing information on energy content facilitates the making of healthy food choices( Reference Littlewood, Lourenço and Iversen 6 ). This information is readily available as ‘calories’ (i.e. kilocalories; 1 kcal=4·184 kJ) on most food labels internationally( Reference Wartella, Lichtenstein and Yaktine 7 ) and relied upon by consumers when considering nutrition( Reference Grunert and Wills 8 ). However, there is evidence that consumers often misunderstand energy information and do not in fact understand the meaning of a calorie or its contribution to their energy needs( Reference Cowburn and Stockley 9 , Reference Van Kleef, Van Trijp and Paeps 10 ). Further, calorie labelling can take different forms; for instance, physical activity labels that relate the energy concept to how it is used in daily activity, or percentage daily intake labels that place the energy quantity in the context of a daily dietary recommendation. There is mixed evidence about which type of calorie labelling is more effective than others( Reference Masic, Christiansen and Boyland 11 – Reference Ellison, Lusk and Davis 14 ). This suggests that consumers’ understanding of a label may have conceptual as well as quantitative components, but research has yet to combine the two types of understanding. The definition of food energy understanding and the measures used to capture this are varied, with each study offering information about a facet of the concept (e.g. Grunert and Wills( Reference Grunert and Wills 8 ), Watson et al.( Reference Watson, Chapman and King 15 )). The focus of the present paper is to integrate the different ways consumers may derive understanding about food energy information.
A new energy interpretation framework
The new framework proposed herein addresses the multifaceted processes involved in understanding food energy information. Ideally, a consumer’s understanding should match the meaning a communicator intended to provide( Reference Grunert and Wills 8 ). Consumers thus need to interpret the term ‘calories’ as representing energy provided by the food, as well as the quantity provided( 16 ). The concept of energy and its quantity have been separately investigated( Reference Grunert and Wills 8 , Reference Watson, Chapman and King 15 , Reference Vanderlee, Goodman and Sae Yang 17 ), but they have yet to be systematically examined in a unified framework. To provide a more holistic approach to the understanding of food energy labels, we developed an interpretation framework centred on these two pillars (see Fig. 1). Each pillar of interpretation (qualitative/conceptual and quantitative) was tapped into with two operational variables.
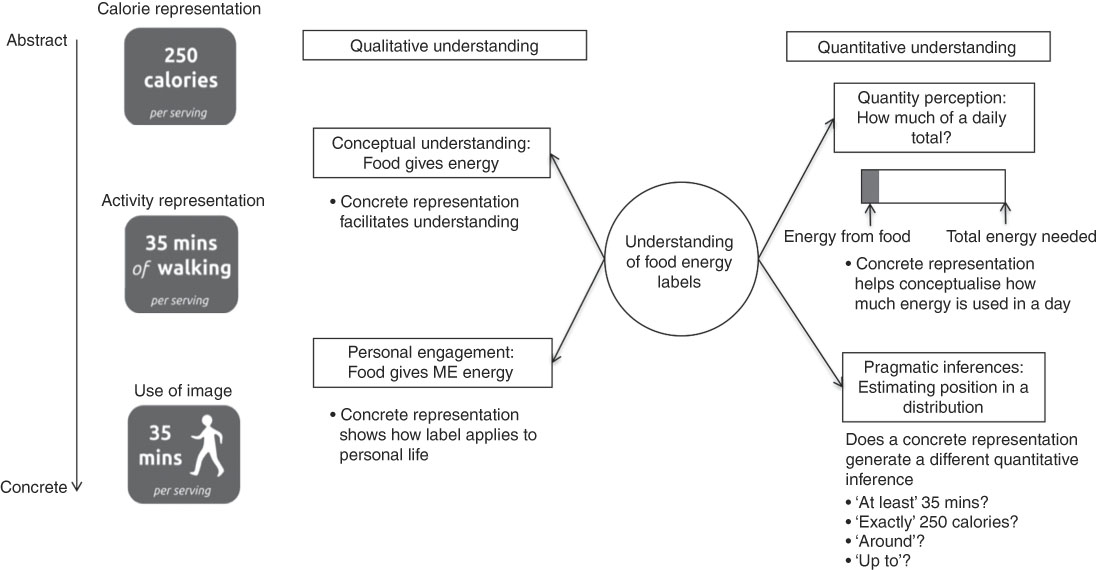
Fig. 1 A framework for energy interpretation
Conceptual understanding of food energy
To fully understand what food energy is, people must realise that it is fuel for the body and concretise this concept by placing the information in the context of their own lifestyle( Reference Watson, Chapman and King 15 ). Both these two ways in which food energy can be conceptually understood affect people’s use of the information. Being able to define what energy means allows consumers to understand its contribution to their health (and in particular, how excess energy intake leads to obesity( Reference Watson, Chapman and King 15 , 16 )). Further, associating this concept to themselves should create personal relevance that makes the message to reduce consumption more persuasive( Reference Petty and Cacioppo 18 ).
Quantitative understanding of food energy
There are two ways people can derive meaning about energy quantities, which contribute to how effectively they can use energy labels to make healthy choices. First, people can perceive quantities in terms of an estimation of a food’s contribution to a daily recommended total. This gives people a context in which to interpret otherwise meaningless numbers( Reference Auchincloss, Young and Davis 19 ) and allows them to ascertain whether they are in fact eating too much. Second, people can identify the position of the given quantity within a distribution (e.g. is it a minimal, maximal, exact or rough estimate?). This modifies the meaning people take away from a given estimate: ‘at least 100 calories’ presents a very different message from ‘up to 100 calories’.
To date, research on people’s understanding of the quantities indicated on food labels has focused on the first way: their ability to identify exactly how much energy one is consuming (e.g. as part of a daily recommended intake( Reference Grunert, Wills and Fernandez-Celemin 20 )). However, the literature on pragmatics (i.e. the practical meaning people derive from information) suggests that people do not process quantities so precisely; rather, they infer the position of a numerical estimate based on conversational conventions( Reference Grundy 21 ). In ordinary communication contexts, quantities are often used to refer to the extremes of a distribution, particularly when prefaced by modals such as ‘can’ and ‘will’( Reference Teigen, Juanchich and Filkukova 22 ). In general, lower-bound estimates seem to be the default( Reference Mandel 23 , Reference Halberg and Teigen 24 ), with people inferring that quantities are minimal amounts to be expected (e.g. ‘two of the cereals are unhealthy’ is taken to mean ‘at least two of the cereals are unhealthy’( Reference Horn 25 ); for a review, see Breheny( Reference Breheny 26 )). However, when people expect the speaker to dislike an option, people infer that quantities refer to a maximal amount (e.g. ‘you only get 5 g of fibre’ would be inferred to mean ‘up to 5 g’)( Reference Halberg and Teigen 24 ). These sorts of pragmatic inferences about energy quantities may affect people’s understanding. However, it is a matter that has yet to be investigated.
Identifying elements that facilitate food label understanding
The interpretation framework presented incorporates aspects of energy label understanding that were previously independently investigated and adds new facets to it. This integrative approach has an additional advantage in allowing us to assess more systematically the impact of specific variations in label types. One such variation in food energy labelling is a proposed ‘physical activity label’ (e.g. Royal Society for Public Health( 27 )), which presents food energy in terms of the activity time required to burn off the food.
It has been suggested that because physical activity time is more concrete, representing energy with these units makes it more easily understood than using ‘calories’( 27 ). In line with this hypothesis, presenting abstract concepts in concrete terms facilitates understanding of the concepts( Reference Barrio, Goldstein and Hofman 28 ). In addition, depicting energy in terms of physical activity may be more effective in prompting people to consider how the label applies to their own lifestyle and diet( Reference Swartz, Dowray and Braxton 29 ). Conversely, people are less likely to relate the calorie content of food to themselves( Reference Swartz, Dowray and Braxton 29 ). Representing energy in terms of activity time instead of calories is therefore posited to evoke a more accurate and personalised conceptual understanding of food energy( Reference Swartz, Dowray and Braxton 29 ).
How would a label’s energy representation affect the type of inferences made? We could expect that people would make the default inference that the energy quantity is a minimum to be expected whatever its representation or format( Reference Mandel 30 ). Alternatively, people might see calories as a warning but activity time as an encouragement for action, resulting in differing perceptions of two estimates of the same energy value( Reference Halberg and Teigen 24 ): a lower-bound interpretation of activity (e.g. ‘the food requires at least 35 min of walking’) infers a more energy-dense product than an upper-bound interpretation of calories (e.g. ‘the food provides up to 250 calories’). Inferences about quantity estimates may therefore be informative about how people view activity and calorie labels respectively: as cautionary or encouraging.
A further variation introduced by physical activity labels is the format of presentation used, whereby calorie labels present information in text-only form (e.g. using the word ‘calories’) but activity labels convey conceptual information using an image to depict physical activity( Reference Van Kleef, Van Trijp and Paeps 10 , 27 ). While past research comparing food labels that vary along more than one dimension (e.g. one label that presents fewer nutrients with verbal information v. another with more nutrients and numerical information( Reference Campos, Doxey and Hammond 31 )) allows conclusions to be drawn about how different labels affect food choice, the lack of systematicity limits our identification of what factors facilitate understanding. We overcame this limitation by manipulating orthogonally two aspects of a label. Given that images activate conceptual understanding better than words( Reference McBride and Dosher 32 ), and that labels with images such as graphic displays or summary symbols are more easily understood by consumers than text- or number-only labels( Reference Campos, Doxey and Hammond 31 ), we expected an image to reinforce conceptual understanding of food energy.
In the present work, we investigated experimentally whether representing food energy as activity time facilitated conceptual and quantitative understanding of energy compared with the calorie representation. We further tested whether the label’s depiction as an image reinforced this facilitative effect. We hypothesised that consumers would understand activity and image labels better than calorie and text ones, and that activity times would be perceived as minimal quantities while calories would be perceived as maximal quantities. The materials and data for our experiments are available on the Open Science Framework (OSF) at the link http://www.osf.io/d2ugf/.
Methods
Pilot study
The materials and design were first tested in an online pilot study on ninety-six participants obtained through snowball sampling. This study enabled us to gauge the type of responses participants might provide to open questions regarding what an energy label meant and develop a coding framework to better capture participants’ levels of understanding. In addition, it provided preliminary data that suggested participants would differ in their quantitative interpretation of energy estimates as minimal, maximal, exact or approximate quantities. A detailed report of this pilot study is available as supplementary materials on the OSF (https://www.osf.io/d2ugf/).
Participants
Using quota sampling to determine demographic parameters that would closely represent the UK population, we recruited 835 participants from a survey panel company. They completed the survey at the end of an unrelated questionnaire on how participants felt about seeing clusters of holes. After excluding incomplete data and careless responses (as specified in our preregistered experimental protocol, available on the OSF), we had 812 respondents (55 % female, age range 18–74 years). Participants’ mean BMI (27·72 (sd 7·62) kg/m2) indicated an overweight tendency. Participants had slightly favourable attitudes towards healthy eating( Reference Steptoe, Pollard and Wardle 33 ) (mean 4·74 (sd 1·09)). Fifty-one per cent reported using nutritional labels. Full demographic characteristics for the sample are reported in Table 1.
Table 1 Sociodemographic characteristics of the experimental sample of 812 participants (55 % female, age range 18–74 years) recruited through a national survey panel in the UK
Design and procedure
The experiment was conducted online using Qualtrics. Each participant was randomly assigned to one of four experimental conditions in a 2 (energy representation: calories or activity time)×2 (format: text or image) between-subjects design. Participants completed three tasks presented in a randomised order to each participant, followed by control and demographic questions.
Conceptual understanding and engagement task
To measure energy meaning, participants viewed a food label (see the top panel of Fig. 2) and gave open-ended responses about what the label meant. This qualitative answer was used to derive participants’ level of conceptual understanding and engagement with the label. The coding scheme is presented in Table 2.
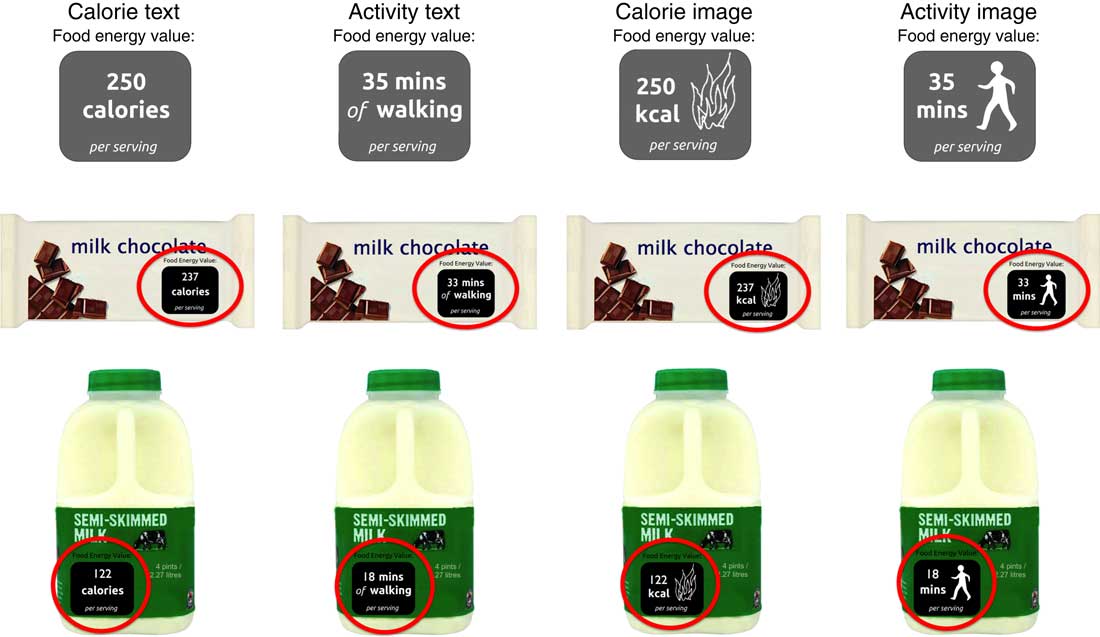
Fig. 2 (colour online) Labels used as stimuli combining the experimental conditions of energy representation (activity/calorie) and format (image/text).
Table 2 Coding scheme for levels of understanding and engagement
Note. Use of personal pronouns was coded as present only when they were applied with regard to the part of the description that actually explained the meaning of the label.
Quantity perception task
To measure quantity perception, participants viewed the label attached to two foods (milk and chocolate, presented individually; see Fig. 2) and estimated on a sliding scale (anchor points: 0–100 %) what percentage of their daily energy requirement the food provided.
Pragmatic inference task
To measure pragmatic inferences made, participants viewed the same foods with the label and were asked to pick the best choice to complete the following sentence (example for milk and within parentheses for chocolate):
Calorie condition: ‘If I consumed one serving (bar) of milk (chocolate), I would have consumed _____ 122 (237) calories of energy.’
Activity condition: ‘If I consumed one serving (bar) of milk (chocolate), I would have to walk _____ 18 (33) min to use up the energy.’
The choices to complete the sentence were ‘at least’, ‘exactly’, ‘around’ or ‘up to’.
Control and demographic questions
Participants estimated how many calories they were required to consume in a day and how much walking time this amount would confer. This allowed us to control for participants’ existing knowledge about recommended calorie amounts. On average, participants gave fairly accurate estimates of what their total calorie intake should be (mean 1787 (sd 1368) kcal/d), but underestimated the time needed to walk this amount off (mean 156 (sd 341) min). To control for experience with food labels, participants also indicated on a 7-point Likert scale (1=‘strongly disagree, 7=‘strongly agree’) whether they agreed with the sentence, ‘I often use nutritional labels to determine the healthiness of food.’
Label development
As shown in the top row of Fig. 2, four food labels were digitally designed to vary systematically the two independent variables (energy representation and format). We included only the energy information on these labels so as not to introduce other extraneous factors (e.g. additional nutrients). Text labels were chosen to convey the calorie and walking time information while keeping a consistent overall design. The full word ‘calories’ presented in the text-only calorie label corresponds with depictions in existing label systems( Reference Becker, Bello and Sundar 34 ). Graphic designs were based on proposed designs and stimuli that had been used in previous research for activity( Reference Van Kleef, Van Trijp and Paeps 10 , 27 , Reference Swartz, Dowray and Braxton 29 ) and calories( Reference Kiefer 35 ). For the quantity perception and pragmatic inference tasks, the values attached to foods (milk and chocolate) were calculated based on ballpark figures for the energy value of the food( 36 ) and the mean weight of someone living in the UK( 37 ). Figure 2 shows the four label designs, along with their presentation with the two foods used in the survey.
Data coding and preparation
Coding scheme for energy meaning
Participants’ responses to the question of what the energy label meant provided an indication of both their conceptual understanding of energy and the level of personal engagement with the energy information. We developed two categories of codes (presented in Table 2) to measure two components of meaning suggested by our proposed energy interpretation framework.
Level of understanding
Level of understanding was coded according to how well participants understood the labels to indicate that energy from food could be used by the body (a theme highlighted in Watson et al.’s( Reference Watson, Chapman and King 15 ) earlier work on consumer understanding of food energy). Based on the sample of responses provided in the pilot study, we derived three coding levels that corresponded to a weak, moderate or strong understanding of the energy information. The development of the coding scheme was first tested on the pilot data by two research assistants blind to the hypotheses, with disagreements resolved through discussion. The final coding scheme showed good inter-rater reliability on the pilot data (κ=0·805, P<0·001) and was subsequently applied to the experimental data by a research assistant blind to the hypotheses, with the first author coding 10 % of the cases to check reliability (κ=0·621, P<0·001). Disagreements were resolved through discussion.
Level of engagement
Level of engagement was coded according to the use of first- and second-person pronouns (i.e. ‘I’, ‘you’ v. ‘it’) because first- and second-person pronouns generally indicate a higher level of interactivity and engagement than third-person pronouns( Reference Yeo and Ting 38 ). This coding scheme was also tested on the pilot data before being applied to the experimental data. Inter-rater reliability on this criterion was good (κ=0·843, P<0·001 in the pilot data; κ=0·902, P<0·001 in the experimental data).
Quantity meaning
We measured the accuracy of participants’ energy estimates in terms of how far off they were from the actual percentage of a daily total the given energy figure indicated. Although a guideline daily calorific requirement is 2000 calories( 39 ), we based estimation accuracy on a range of 1500–2500 daily calories to accommodate for variation in people’s calorific needs. For example, the 122-calorie milk would provide 5–8 % of daily energy requirements. We measured errors in estimation as the absolute deviation from the respective upper or lower boundary for all estimates that fell outside this range. Estimation errors were averaged across milk and chocolate.
Analytical strategy
Energy meaning
The conceptual understanding and personal engagement variables were entered as outcome variables in a logistic regression using energy representation and format as predictors and eating attitudes, BMI and frequency of label use as covariates. The models showed a good fit (
 $\chi _{{(6)}}^{2} $
=45·53, P<0·001, Nagelkerke R
2=0·08 (ordinal logistic regression);
$\chi _{{(6)}}^{2} $
=45·53, P<0·001, Nagelkerke R
2=0·08 (ordinal logistic regression);
 $\chi _{{(5)}}^{2} $
=53·53, P<0·001, Nagelkerke R
2=0·13 (binary logistic regression)).
$\chi _{{(5)}}^{2} $
=53·53, P<0·001, Nagelkerke R
2=0·13 (binary logistic regression)).
Quantity meaning
Estimation errors were analysed in an ANCOVA with energy representation and format as between-subject factors, and BMI, eating attitude, frequency of label use, age, gender and daily calorie intake estimates as covariates. The type of pragmatic inferences participants selected was analysed in a multinomial regression using rough estimates (‘around’) as the reference value, energy representation and format as predictors, and eating attitudes, BMI and frequency of label use as covariates (model fit:
 $\chi _{{(15)}}^{2} $
=113·34, P<0·001, Nagelkerke R
2=0·09; see Table 3).
$\chi _{{(15)}}^{2} $
=113·34, P<0·001, Nagelkerke R
2=0·09; see Table 3).
Table 3 Parameter estimates from the ordinal, binary and multinomial logistic regression models for level of understanding, level of engagement and pragmatic inferences among the experimental sample of 812 participants (55 % female, age range 18–74 years) recruited through a national survey panel in the UK
ref., reference category.
Note. All Wald χ 2 values were calculated with df=1.
Results
Conceptual understanding of energy
Level of understanding
Overall, only 20 % of participants displayed a strong understanding of energy. Supporting our hypothesis, 29 % of participants who viewed activity labels had such an understanding (v. 11 % of those who viewed calorie labels). More participants also showed a strong understanding with image than text labels (22 % v. 17 %). Table 3 shows the parameter estimates obtained in the ordinal regression. Activity labels were about twice more likely than calorie labels to evoke stronger understanding (P=0·005). However, there was no indication that format (image v. text) affected participants’ level of understanding for calorie or activity labels. Stronger understanding was also predicted by healthier eating attitudes (P=0·001) and lower BMI (P=0·001), but not frequency of label use.
Level of engagement
Thirty-one per cent of all participants engaged with the labels. Those who saw activity labels engaged more than those who saw calorie labels (44 % v. 17 %). Participants also engaged more with text labels than image labels (33 % v. 28 %). The binary regression (see Table 3) showed that participants were four times more likely to use person-related pronouns to describe the meaning of activity labels than calorie labels (P<0·001). However format again did not have a significant effect on engagement level. The covariates also did not predict different levels of engagement.
Quantitative understanding of energy
Accuracy of quantity perception
Overall, participants overestimated the contribution of the milk and chocolate to their daily recommended intake (mean 12·14 (sd 18·02) %), and this was not affected by the energy representation of the label or its format (all P>0·40). Table 4 reports in full the P values and effect sizes obtained in the ANCOVA. Participants with higher BMI were more likely to overestimate the food’s contribution towards their daily requirement (P=0·003). Also, participants who recommended consuming fewer calories daily estimated foods as contributing more to their daily total (P<0·001). Therefore, how well participants could integrate energy information into their daily consumption was more influenced by their existing nutritional knowledge than by the features of the energy label.
Table 4 Effects of energy representation and format on errors in estimation of energy quantities (analysed in a between-subjects ANCOVA) by the experimental sample of 812 participants (55 % female, age range 18–74 years) recruited through a national survey panel in the UK
Note. All F values were calculated at df=1618.
Pragmatic inferences about energy values
Numbers on the label were inferred to be rough approximations (‘around’) about a third of the time. The multinomial regression (see Table 3) showed that participants perceived activity labels to be a minimal estimate twice more often as calorie labels, but inferred calorie labels to be exact estimates twice more often than activity labels (both P<0·001). This pattern was consistent across image and text formats (see Fig. 3).
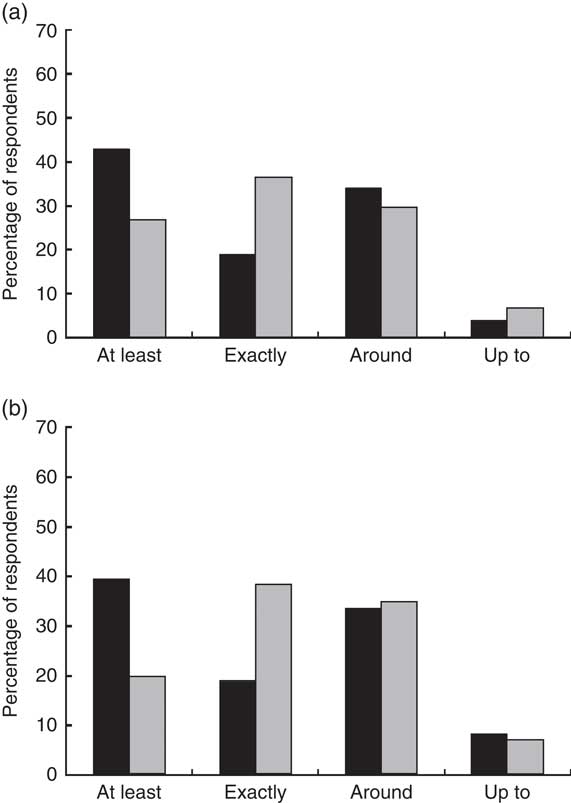
Fig. 3 Percentage of pragmatic inferences regarding energy label quantities (whether participants viewed food energy to be ‘at least’, ‘exactly’, ‘around’ or ‘up to’ the quantity given) by energy and format of the label among 812 participants (55 % female, age range 18–74 years) recruited through a national survey panel in the UK: (a) ![]() , activity text;
, activity text; ![]() , calorie text; (b)
, calorie text; (b) ![]() , activity image;
, activity image; ![]() , calorie image
, calorie image
Discussion
We investigated people’s understanding of food energy in a new framework that included two dimensions of understanding: understanding of the concept and of the quantity. Within this framework, we investigated how the representation of energy and its format of presentation affected people’s understanding of food energy. As we predicted, participants showed a stronger understanding and greater personal engagement for activity than calorie labels. However, activity labels did not help participants better estimate how much a quantity of food contributed to a recommended daily energy intake. Delving further into participants’ interpretation of quantities, we found that they inferred minimal estimates from activity labels and exact estimates from calorie labels, but format did not affect the type of inferences made.
Do people understand the concept of food energy?
Responses that spontaneously referred to energy, such as ‘the food gives you enough energy to walk 35 min’ and ‘for every serving of the food the energy value to your body is 250 calories’, reflected a strong understanding of what energy labels are communicating. Participants were more likely to report such understanding of food energy when shown activity labels as compared with calorie labels. Furthermore, based on activity labels, participants were up to four times more likely to apply this information to themselves. Our evidence therefore substantiates previous suggestions from focus group research that people’s interpretations of activity labels are more accurate and personal than calorie labels( Reference Swartz, Dowray and Braxton 29 ). However, we did not find further facilitating effects of image over text. While we posited from past research that images should improve conceptual understanding, it is possible ‘activity time’ is already clear enough in text format such that the additional benefit of using an image is minimal.
How do people perceive energy quantities?
Our interpretation framework included two elements of quantitative understanding. First was the ability to contextualise quantities as a proportion of a total, which has previously been relied upon as a measure of understanding (e.g. Grunert et al.( Reference Grunert, Wills and Fernandez-Celemin 20 )). Here, we found that activity labels did not provide a more accurate perception of the quantity of energy provided by food. Instead, how accurately participants were able to perceive a food’s contribution to their daily energy requirements was determined more by their knowledge of daily calorie recommendations. The second was the pragmatic inferences people drew about energy quantities: whether people infer the given quantity to indicate an exact estimate, an approximate one, or one that specifies the lower or upper bound of a range. Past work has assessed understanding of quantities by the ability to perform accurate computations using the numbers (e.g. Malam et al.( Reference Malam, Clegg and Kirwan 40 ), Rothman et al. ( Reference Rothman, Housam and Weiss 41 )); however, this assumes that people believe the quantities to be exact. In our study, more than 65 % of our participants did not consider the food label values to be exact estimates. This complements research from psycholinguistics that shows people apply communicative conventions when they interpret numerical quantities( Reference Mandel 23 , Reference Halberg and Teigen 24 ). It may also indicate some awareness that energy labels are in fact variable estimates of the true energy value of the food( Reference Jumpertz, Venti and Le 42 , Reference Urban, Dallal and Robinson 43 ). However, if people interpret quantities to represent a range of possible values, this may contribute to their confusion in performing nutritional calculations( Reference Campos, Doxey and Hammond 31 ).
The effect of the energy representation on participants’ inferences about quantities is a novel finding and one that merits further investigation. Participants were more likely to infer energy values to be minimal estimates (‘at least’) of activity time, but to be more often exact estimates of calories. For example, people believed they would have to walk at least 33 min to expend the energy in a chocolate bar, but they believed the chocolate had exactly 237 calories, although both referred to an equivalent amount of energy, which should be assumed to be equally vague. However, this did not result in a greater overestimation of how much activity-labelled food contributed more to their daily recommended total. It is thus uncertain whether participants were able to contextualise the food within their daily life despite seeing it as more calorific, or if they revised how much energy they thought they needed because they took the activity label as a sign that they required more energy in a day for their activities( Reference Watson, Chapman and King 15 ).
Practical applications
The study showed that compared with calorie labels, activity labels were able to produce stronger and more personal conceptual understanding about energy. This helps to contextualise energy information, which enhances usability of the information in selecting healthier foods( Reference Bleich and Pollack 44 , Reference Sinclair, Cooper and Mansfield 45 ). This suggests that activity labels are a promising intervention to improve food choices. However, the lack of a significant effect for the image format prompts the question of whether it is worthwhile to introduce images on food energy labels, especially since redesigning labels to include images can be twice as costly to manufacturers than implementing text changes( Reference Balazs-Horvath, Craddock and Morgan 46 ).
We did not find activity labels to be more beneficial than calorie ones in facilitating quantitative understanding. However, the change in energy representation affected the type of inferences people drew about energy quantities, with activity labels more often taken to be the minimal time taken to use up food energy, as opposed to calorie labels, which were taken as an exact energy quantity. From a communicative standpoint, if activity labels are to be used, it may be prudent to educate people about the distributions of the quantities so as to avoid misunderstandings about the quantity values. For instance, if people assume activity labels to be minimum walk times, they would be misinterpreting labels that intend to communicate the average time needed.
Limitations and future research
One limitation of the work is that with our focus on label understanding, we did not extend our measures to food choice. We focused on understanding because it is a precursor to label use( Reference Grunert and Wills 8 ) and thus it is important to first ascertain if people are indeed deriving meaning from information as it is intended. However, future research could consider whether different inferences about the quantities of energy provided are relied upon in food decision making.
A further question not yet answered by our research is also how an ‘activity time’ representation of energy might work when the representation of quantities is not absolute, such as on percentage daily value labels. We did not find an effect of energy representation on quantity perception for an absolute energy quantity; however, if the recommended amount is standardised for participants, it may be that the tendency to infer activity times to be minimum quantities would then carry over to their proportion estimates. On the other hand, the use of a standardised quantity could interfere with the facilitative effect of activity labels in personalising information, since the stronger conceptual understanding produced might then prompt the realisation that the quantity indicated is not based on one’s specific caloric requirements.
The landscape of nutrition labelling is highly complex, with many ways to present nutritional concepts and quantities. The challenge for public policy is to determine how to convey this information in an accurate and accessible way. Our study adds to the existing body of literature on the interpretation of information on food labels and offers greater insight as to how label design can be manipulated to fit the way people interpret the concept of energy and its quantity. In particular, communications about nutritional values need to consider not only how easy a conceptual representation or format is to understand, but also what people might infer from the manufacturer’s choice of that representation or format.
Acknowledgements
Acknowledgements: The authors thank Guyan Sloane, Anca Pop, Amalia Cerb, Jessica Ng and Erica Hall for their contributions to the coding. Financial support: This research received no specific grant from any funding agency in the public, commercial or not-for-profit sectors. Conflict of interest: None: Authorship: The research question was formulated by D.L. and the design was a collaboration between D.L. and M.J. Data collection and analysis and the writing of the article was done by D.L., with help and input from M.J. Ethics of human subject participation: This study was conducted according to the guidelines laid down in the Declaration of Helsinki and all procedures involving human subjects were approved by the Research Ethics Committee of the University of Essex. Written informed consent was obtained from all participants.


