


Traditionally, nutritional concerns in sub-Saharan Africa (SSA) have centred on hunger and underweight. However, economic development and urbanization have shifted traditional physical activity and food patterns. The growing prevalence of overweight and obesity presages an oncoming epidemic of metabolic and cardiovascular disease( Reference Dalal, Beunza and Volmink 1 , Reference Steyn and Mchiza 2 ).
A population’s predominant dietary patterns can be identified empirically using principal component analysis (PCA)( Reference Gleason, Boushey and Harris 3 ), which utilizes correlations between food groups and has been used in many populations( Reference DiBello, Kraft and McGarvey 4 – Reference Saadatnia, Shakeri and Keshteli 8 ). Different dietary patterns have sometimes been found for men and women, and dietary patterns are thus usually derived separately by sex( Reference Steyn and Mchiza 2 , Reference Gleason, Boushey and Harris 3 ). Dietary patterns identified by PCA have sometimes been associated with health conditions; these have included CVD( Reference Rodriguez-Monforte, Flores-Mateo and Sanchez 9 ), cancer( Reference Brennan, Cantwell and Cardwell 10 ), and obesity and overweight( Reference Arabshahi, Ibiebele and Hughes 11 – Reference Shi, Yuan and Hu 13 ).
There are limited reports describing PCA-derived dietary patterns in SSA. Patterns identified have included those in Eastern Cape Province, South Africa( Reference Sewram, Sitas and O’Connell 5 ); in Burkina Faso( Reference Becquey, Savy and Danel 14 ); in urban Ghana( Reference Frank, Kroger and Schulze 15 ); in rural Tanzania( Reference Keding, Msuya and Maass 16 ); in Botswana( Reference Maruapula and Chapman-Novakofski 17 ); in Cape Province, South Africa( Reference Hooper, Calvert and Thompson 18 ); in the Cameroonian military( Reference Nkondjock and Bizome 19 ); in northern Tanzania( Reference Jordan, Hebestreit and Swai 20 ); and in rural South African adolescents( Reference Pisa, Pedro and Kahn 21 ). Dietary patterns have been shown to associate with demographic features in SSA including age( Reference Becquey, Savy and Danel 14 , Reference Frank, Kroger and Schulze 15 ), socio-economic status( Reference Frank, Kroger and Schulze 15 , Reference Keding, Msuya and Maass 16 ), family structure( Reference Maruapula and Chapman-Novakofski 17 ) and urban/rural residence( Reference Maruapula and Chapman-Novakofski 17 , Reference Hooper, Calvert and Thompson 18 ). In addition, dietary patterns were associated with chronic diseases such as hypertension( Reference Nkondjock and Bizome 19 ), diabetes( Reference Frank, Kroger and Schulze 15 ), breast cancer( Reference Jordan, Hebestreit and Swai 20 ), oesophageal cancer( Reference Sewram, Sitas and O’Connell 5 ) and skin atopy( Reference Hooper, Calvert and Thompson 18 ). Four reports have linked PCA-derived dietary patterns with overweight, obesity or BMI among individual SSA countries( Reference Becquey, Savy and Danel 14 – Reference Keding, Msuya and Maass 16 , Reference Pisa, Pedro and Kahn 21 ).
To better understand eating patterns in SSA, we used pilot study data from the Africa/Harvard School of Public Health Partnership for Cohort Research and Training (PaCT) to identify dietary patterns in this population. In addition, we cross-sectionally examined the associations between these patterns and overweight, obesity and BMI.
Methods
Study population
The PaCT was originally assembled to test the feasibility of a longitudinal study of non-communicable chronic disease in adults. The study population was recruited in 2011 from five sites in four countries: one site each in Nigeria, Tanzania and South Africa, and two sites in Uganda. Three of the sites were occupational cohorts: we recruited teachers in Tanzania and South Africa, and nurses in Nigeria. The two Ugandan sites were defined geographically; we recruited residents from one rural site and one peri-urban site. We conducted an initial survey of demographics, lifestyle factors and history of chronic illness. We also included a 6-month follow-up survey with a common FFQ. A full description of the study and participants has been given previously( Reference Dalal, Holmes and Laurence 22 ). English questionnaires were used in Nigeria and South Africa. Questionnaires were translated into local languages, and then back-translated into English, in Tanzania (where the local language was Kiswahili), in Uganda (where the local languages were Luganda and Runyakitara) and in South Africa (where the local language was Afrikaans). Persons excluded from the current analysis were those with greater than 25 % of FFQ missing data, those without information on BMI or those with a BMI of less than 17 kg/m2 ( Reference Odegaard, Pereira and Koh 23 ). FFQ information was not available from Nigeria; therefore only four of the five original sites were included in the current analysis (teachers in Tanzania, teachers in South Africa, rural residents in Uganda and peri-urban residents in Uganda).
Development of the PaCT FFQ
We intended to develop an FFQ harmonized across the four PaCT countries. We began with the validated Harvard Nurses’ Health Study 2010 FFQ( Reference Willett 24 ). The Harvard FFQ has been adapted for use in other countries, including Colombia( Reference Bautista, Herran and Pryer 25 ), Mexico( Reference Hernandez-Avila, Romieu and Parra 26 ), Canada( Reference Gao, Wang and Randell 27 ) and Iran( Reference Esmaillzadeh, Kimiagar and Mehrabi 28 , Reference Esmaillzadeh and Azadbakht 29 ). We thereafter consulted with nutritionists from the PaCT countries on the processes discussed below.
First, we adapted the instructions with additional considerations including food quantification (e.g. household measures), metric system adaptation (e.g. English and metric system), religion (e.g. avoidance of fasting periods) and a lack of familiarity with the concept of averaging. An example of these instructions is as follows: ‘How often have you eaten the following foods in the past year? Do not count periods of fasting, such as Ramadan. Please pick only one frequency for each food. A note about serving sizes: 1 cup=8 ounces or 250 ml. 1 ladle=1 large serving spoon=½ cup. If you eat 2 servings of food once a week, then you will check “2–4 per week”.’
Second, we included the following food groups in the PaCT FFQ: dairy products; fruits; grains, potatoes and other root vegetables; legumes, vegetables and nuts; meat, fish and eggs; beverages including alcoholic beverages; and other foods. We retained food items on the Harvard FFQ that are also consumed in any of the PaCT countries. Foods on the Harvard FFQ that were not frequently eaten in any PaCT country were omitted (e.g. blueberries). Once food items were determined, we evaluated whether a food is called a different English name in PaCT countries. For example, ‘cooked oatmeal/cooked oat bran including instant’ on the Harvard FFQ became ‘Oats, cooked (porridge)’ on the PaCT FFQ. Third, we evaluated the prompts and adapted them for the PaCT FFQ. For example, ‘Beans or lentils, dried’ on the Harvard FFQ became ‘Beans/legumes (Example mung and soybeans; pigeon, cow, and chickpeas)’ on the PaCT FFQ. We also allowed names/prompts to differ between countries. For example, the additional prompts of ‘split peas, lentils, and dried beans’ were added for South Africa.
Finally, we added foods common in each country that do not occur in the Harvard FFQ. These included grains such as millet, sorghum and maize; root vegetables such as cassava and taro; fruits such as jackfruit and guava; vegetables such as okra and pumpkin leaves; meats such as offal/tripe; dried fish; and homemade alcoholic beverages. Country-specific names were used as needed. For example, ‘plantains’ were referred to as ‘gonja or matoke’ in Uganda and as ‘ndizi’ in Tanzania. We also included mixed dishes such as ‘maize cooked with beans’ and ‘pie, pastry with meat filling (meat samosa, vetkoek (in South Africa))’. To be inclusive across all four countries, the final PaCT FFQ contained 175 food items. We also asked type of cooking oil, use of vitamins, meal timing, frequency of meals eaten away from home, frequency of frying food and use of added salt.
Data collection
Age, sex and site were abstracted from responses to the baseline questionnaire. In Uganda, trained interviewers administered the questionnaire including the FFQ and measured height and weight. In South Africa, nurses visited the schools of teacher participants and measured height and weight, although the questionnaire was self-administered. Likewise, in Tanzania, teacher participants self-administered the questionnaire; height and weight were recorded at the local district hospital.
Statistical methods
PCA were conducted separately for men and women and adjusted for age. Analyses were initially stratified by site to account for regional differences and then combined because of the small size of the sample. Descriptive statistics were used to describe the characteristics of the study population and explore the distribution of foods on the FFQ.
Dietary patterns were identified using PCA with orthogonal rotation, which derives non-correlated patterns( Reference Gleason, Boushey and Harris 3 ). PCA derives dietary patterns based on correlation between food groups. The number of patterns retained was determined based on visual interpretation of the scree plot of eigenvalues as well as the percentage of total variance explained by each factor. Items with a varimax-rotated factor loading greater than 0·15 were retained in the dietary pattern.
The 175 foods on the FFQ were initially categorized into thirty-seven groups based on similarities in nutrient composition and intake distribution before entry into PCA. The thirty-seven food groups were then further combined to four groups for PCA to compare with the patterns obtained using thirty-seven food groups. Ultimately, thirty-seven groupings were chosen because they explained more variability in the diet and allowed for a more detailed interpretation of dietary patterns. For example, cooked oats, cooked wheat, cooked sorghum, cooked millet meal, cooked finger millet, cooked bulrush millet, cooked mixed grains, dry or cold cereal, roasted or boiled maize, cooked maize meal, creamed sweet corn maize, maize cooked with beans, maize cooked with rice, mixed rice and boiled plain rice were grouped as ‘cereals’. ‘Starchy roots’ included boiled or baked potato, boiled cassava, cassava meal/flour, cassava in a mixed dish, sweet potato alone, sweet potato in a mixed dish, cocoyam/taro alone, cocoyam/taro in a mixed dish, boiled yam alone, yam fried, yam in a mixed dish and pounded yam.
We separately identified patterns for men and women as they may have different eating patterns, as reported in previous studies( Reference Ax, Warensjo Lemming and Becker 6 , Reference Odegaard, Koh and Yuan 7 ). For each pattern, a factor score was calculated by summing intakes of food groups weighted by their factor loadings and standardized to have a mean of 0 and a standard deviation of 1. Factor loadings represent correlation coefficients between the food groups and the specific pattern, with positive loadings representing positive correlations and negative loadings representing inverse correlations. Each individual received a score for each pattern indicating how closely similar his/her diet is to the identified dietary pattern. A higher score indicated a person’s diet more closely resembled the extracted pattern. Factor scores were divided into tertiles for each food pattern, whereby the first tertile had the lowest consumption and the third tertile the highest consumption.
Multiple logistic regression was used to assess the association between dietary pattern tertiles and overweight and obesity. Low to normal weight was defined as a BMI from 17 to less than 25 kg/m2. Overweight was defined as a BMI greater than or equal to 25 kg/m2. Obesity was defined as a BMI greater than or equal to 30 kg/m2. We used generalized linear regression to assess the association between dietary patterns and continuous BMI. A robust variance structure was used to account for non-normally distributed residuals in BMI. A linear trend test was conducted across continuous values of the dietary patterns.
Results
Study population characteristics, stratified by sex, are shown in Table 1. There were more women (n 444) than men (n 294). Education greater than high school was prevalent, accounting for 46·4 % of women and 35·4 % of men. Most participants were urban dwellers (78·6 % of women and 69·7 % of men), with only one rural site. There was a particularly high prevalence of overweight or obesity (59·9 %) and obesity (29·3 %) among women.
Table 1 Characteristics of the study population of women and men from four sites across three sub-Saharan African countries, 2011

* Defined as greater than a high school education.
† Defined as BMI≥25 kg/m2.
‡ Defined as BMI≥30 kg/m2.
Mean daily servings of the thirty-seven food groups, by site and sex, are shown in Table 2. Intakes of food groups differed between men and women within sites, supporting the practice of separate reporting by sex.
Table 2 Mean daily servings of thirty-seven food groups, by site and sex, in the study population of women and men from four sites across three sub-Saharan African countries, 2011

We identified two predominant dietary patterns in women (Table 3). The Mixed Diet (factor 1) was characterized by higher intakes of unprocessed foods such as vegetables, fresh fish, cereals, fruits and beans, but also processed foods such as cold cuts, salad dressing and canned fish. The Processed Diet (factor 2) was characterized by higher intakes of salad dressing, margarine, chips, coffee, canned fish, spread, sweets and refined grains. The Mixed Diet explained 8·0 % of the variation and the Processed Diet explained 3·7 % of the variation among women.
Table 3 Factors explaining dietary patterns among the study population of women and men from four sites across three sub-Saharan African countries, 2011

We also identified two dietary patterns in men similar to those identified in women (Table 3). The first pattern, Mixed Diet, was characterized by higher intakes of unprocessed foods such as vegetables, beans, nuts, cereals and fruits, but also processed foods such as tea, refined grains, diet soda and fruit juice. The second pattern, Processed Diet, was characterized by higher intakes of cold cuts, sweets, yoghurt, salad dressing, canned fish, chips, soda and margarine. The Mixed Diet explained 6·2 % of the variation and the Processed Diet explained 4·1 % of the variation among men.
Tables 4 and 5 show the age-adjusted association between tertiles of dietary pattern intake and the prevalence of overweight and obesity among women and men, respectively. For women, there was a strong association between higher intake of the Processed Diet pattern and being overweight or obese: after adjusting for age, women in the highest tertile of intake of the Processed Diet pattern had 3·00 times the odds being overweight (95 % CI 1·66, 5·45; prevalence=74 %) and 4·24 times the odds of being obese (95 % CI 2·23, 8·05; prevalence=44 %) than women in the lowest tertile of intake (linear trend P<0·0001 for both associations; prevalence=47 and 14 %, respectively). However, after further adjustment for site, the associations between the Processed Diet pattern and overweight/obesity among women were attenuated and no longer statistically significant. There was no association between the Mixed Diet pattern and overweight or obesity (Table 4).
Table 4 Age-adjusted association between dietary patterns and obesity and overweight among women from four sites across three sub-Saharan African countries, 2011

Ref., referent category.
Table 5 Age-adjusted association between dietary patterns and obesity and overweight among men from four sites across three sub-Saharan African countries, 2011

Ref., referent category.
Likewise, for men, there was a strong association between higher intake of the Processed Diet pattern and being overweight or obese. Men in the highest tertile of intake of the Processed Diet pattern had 2·08 times the odds of being overweight (95 % CI 1·07, 4·02; prevalence=45 %) and 3·59 times the odds of being obese (95 % CI 1·20, 10·71; prevalence=20 %) than men in the lowest tertile (linear trend P<0·001 for both associations; prevalence=29 and 5 % respectively). Like results among women, after further adjustment for site, the associations with the Processed Diet pattern and overweight/obesity among men were attenuated and no longer statistically significant. We did not find significant associations between the Mixed Diet pattern and overweight and obesity among men (Table 5).
We also examined the associations between dietary patterns and BMI (Table 6). After adjusting for age, women in the highest tertile of intake of the Processed Diet pattern had a BMI that was 2·84 kg/m2 higher (95 % CI 1·54, 4·14 kg/m2) than women in the lowest tertile. Men in the highest tertile of intake of the Processed Diet pattern had a BMI that was 1·70 kg/m2 higher than men in the lowest tertile (95 % CI 0·44, 2·95 kg/m2); however, it was not statistically significant. These associations are also illustrated in Fig. 1: BMI was associated with higher intake of the Processed Diet pattern, with the P for linear trend <0·0001 for both women and men. There was no consistent association between BMI and the Mixed Diet pattern for either sex.
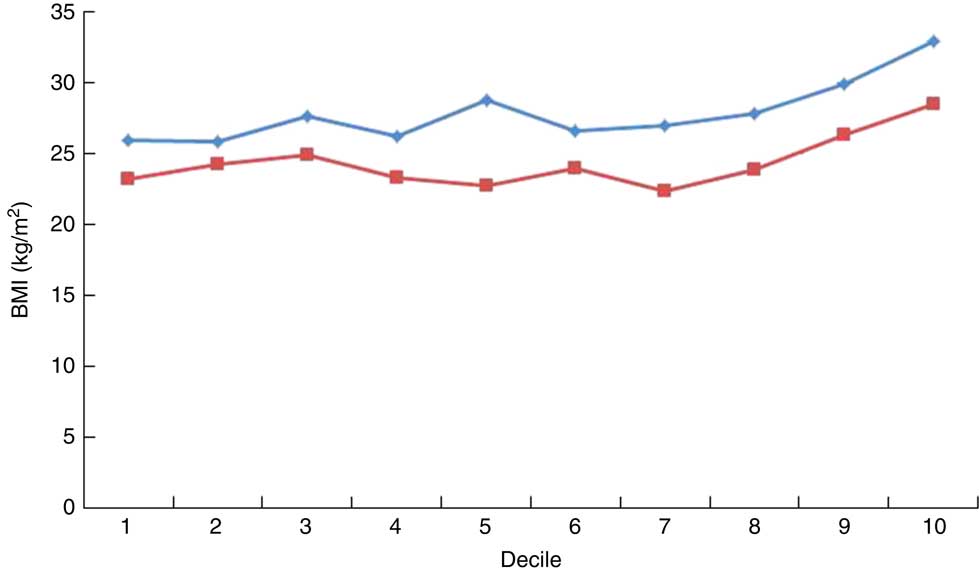
Fig. 1 (colour online) Mean BMI by decile of processed food intake among women (![]() ; n 444) and men (
; n 444) and men (![]() ; n 294) from four sites across three sub-Saharan African countries, 2011
; n 294) from four sites across three sub-Saharan African countries, 2011
Table 6 Age-adjusted mean difference in BMI units (kg/m2) across dietary patterns among women and men from four sites across three sub-Saharan African countries, 2011

Ref., referent category.
Discussion
There have been a few studies that have examined the association between dietary patterns and body size in individual SSA countries. Five dietary patterns were derived using 24 h dietary recall data in 252 rural Tanzanian women. Higher intake of a dietary pattern called the ‘Purchase’ pattern, characterized by bread, cakes (usually fried in oil), sugar and black tea, was associated with higher BMI in the study by Keding et al.( Reference Keding, Msuya and Maass 16 ). A study of 1072 urban residents of Burkina Faso using an eighty-two-item FFQ by Becquey et al.( Reference Becquey, Savy and Danel 14 ) found higher consumption of a ‘Modern’ dietary pattern characterized by non-fatty meats and poultry, eggs and fatty/processed meats was associated with a higher prevalence of overweight. Similarly, a dietary pattern characterized by animal products derived from a 214-item FFQ in 388 rural South African adolescents was associated with higher BMI in the study by Pisa et al.( Reference Pisa, Pedro and Kahn 21 ).
In contrast, in a case–control study of 1221 urban Ghanaians with a fifty-one-item FFQ, the predominant dietary patterns were a ‘Traditional’ dietary pattern, characterized by green leafy vegetables, beans and aubergine, and a ‘Purchase’ dietary pattern, characterized by juice, sweets, rice, soft drinks and vegetable oil. Individuals in the highest compared with lowest category of the Purchase pattern score were younger, had lower BMI and waist-to-hip ratio, and a lower risk of diabetes. On the other hand, those in the lowest category of the Traditional pattern score were older, had a higher waist-to-hip ratio and higher risk of diabetes in the study by Frank et al.( Reference Frank, Kroger and Schulze 15 ).
The Purchase pattern in Tanzania described by Keding, the Modern pattern in Burkina Faso described by Becquey and the South African pattern characterized by animal products described by Pisa, like our Processed Diet pattern, could represent the nutrition transition away from the traditional African plant-based diet towards one characterized by processed foods, sweets and animal products( Reference Steyn and Mchiza 2 ). We cannot explain the contradictory results for the Purchase pattern in Ghana( Reference Frank, Kroger and Schulze 15 ). Evidence of nutrition transition may be evident through the dietary patterns derived in the present study. We did not find a mostly unprocessed pattern; plant foods are now mixed with processed foods (Mixed Diet) and the second most prominent pattern was a Processed Diet pattern.
There were limitations to the current study. Each of our sites had socio-economic characteristics which did not overlap with the other sites. Only one of the four sites was rural. Two of the four (Tanzania and South Africa) represented a highly educated professional group, teachers. The inclusion of teachers who are predominantly women also led to there being more women than men among participants. Dietary patterns may be associated with socio-economic status and urban/rural residence( Reference Frank, Kroger and Schulze 15 – Reference Hooper, Calvert and Thompson 18 ).
Dietary patterns differed by sex at each site, therefore we reported results separately for women and men. Study site could be a confounder as adjustment for site led to finding no associations. However, we believe this may have represented over-control; essentially the differences in socio-economic status and urbanicity between sites explained the differences in diet and body size. However, it is also possible that other factors differing between sites, such as physical activity, could be the true confounders. We examined the pattern scores by site and found them not very different. However, we were unable to separately examine dietary patterns and outcomes by individual site and sex because numbers of participants in each category became too small. We also do not have data on physical activity.
Although a cross-sectional study such as this cannot prove a causal relationship between processed food intake and obesity in SSA, such a relationship has been vigorously espoused on the global stage. Monteiro et al.( Reference Monteiro, Levy and Claro 30 ) looked in detail at the 30-year rapid increase in processed food consumption in Brazil. They concluded that although negative impact on chronic disease could not yet be proven, definitive studies should be done; and in the meantime called upon governments to limit the likely damage now. Stuckler et al.( Reference Stuckler, McKee and Ebrahim 31 ) showed that market penetration of processed foods in middle-income countries now equals that of high-income countries, and that the rate of increase of processed food consumption in low- and middle-income countries is even faster than historically seen in high-income countries. If true, this would predict an even more explosive epidemic of obesity and related diseases in SSA countries than the developed world has seen.
The strengths of the present study included the following. We developed a comprehensive, 175-item FFQ that allowed for local foods. We were able to assess diet at four sites in three different SSA countries. We demonstrated differences in dietary patterns between women and men. Yet, in both women and men, we demonstrated a Processed Diet pattern that was associated with overweight and obesity.
Conclusion
In conclusion, we identified a dietary pattern characterized by processed foods that was associated with overweight and obesity in women and men. There is a need in Africa for research that would inform policy makers to make appropriate public health recommendations. Additional studies are needed, particularly longitudinal ones, to examine the extent of modern diet adoption in Africa and to examine its relationship to obesity and other chronic diseases( Reference Dalal, Holmes and Laurence 22 , Reference Holmes, Dalal and Volmink 32 ).
Acknowledgements
Financial support: This work was supported by a grant from the Dean’s Office of the Harvard School of Public Health; the Harvard School of Public Health Department of Nutrition; the Karolinska Institutet Distinguished Professor Award (H.-O.A., award number 2368/10_221); the Faculty of Medicine and Health Sciences at Stellenbosch University; plus The International Society of Nephrology’s Global Outreach (ISN GO) Clinical Research and Prevention Program. The funders had no role in the design, analysis or writing of this article. Conflict of interest: None. Authorship: All authors have made substantial contributions to the acquisition and interpretation of the data. In addition, M.D.H., T.T.F., V.S. and M.B.D. contributed to the conception and analysis of the work. All authors have contributed to the drafting or revising of the work for important intellectual content. All authors approved this version for publication. All authors agree to be accountable for all aspects of the work. Ethics of human subject participation: This study was approved by the Harvard School of Public Health Institutional Review Board; the Institute of Human Virology Heath Research Ethics Committee, Nigeria; the Health Research Ethics Committee of the Faculty of Health Sciences, Stellenbosch University; Makerere University School of Public Health Higher Degrees Research and Ethics Committee; National Institute for Medical Research, Tanzania; Mbarara University of Science and Technology Research Ethics Committee; and the Uganda National Council of Science and Technology.


