


Globalization, urbanization and economic growth in low- and middle-income countries including India are associated with the nutrition transition – the phenomenon hypothesized to encompass shifts in dietary patterns, eating behaviours and physical activity patterns( Reference Popkin, Horton and Kim 1 , Reference Popkin 2 ). Concomitant with the nutrition transition, obesity and other chronic diseases have emerged among adults, adolescents and children across social strata( Reference Drewnowski and Popkin 3 – Reference Zingoni, Norris and Griffiths 6 ). Validated dietary assessment instruments could measure the extent of nutrition transition through food intake and eating behaviours associated with it. Typical dietary assessment instruments such as FFQ and 24 h dietary recalls (24-HR) have been used to determine food consumption and nutritional status( Reference Singhal, Goyle and Gupta 7 ). However, there is no FFQ developed to assess the nutrition transition. In addition, with the availability of and accessibility to global or non-local foods and beverages through globalizing food markets, the diets of individuals are likely to include both global and traditional items. Studies have reported behaviours that may be part of the nutrition transition, including eating outside the home( Reference Adair and Popkin 8 ) and watching television while eating meals( Reference Kuriyan, Bhat and Thomas 9 ). Although studies indicate that these trends may be becoming more common, especially in adolescents aged 10–19 years( Reference Adair and Popkin 8 ), currently there is no dietary instrument that quantifies these and other nutrition transition-related food consumption and eating behaviours.
At the forefront of social change and global trends( Reference Dasen 10 ), adolescents in low- and middle-income countries may be experiencing nutrition transition-related shifts in food consumption and eating behaviours. In India, adolescents comprise one-fifth of the population (~243 million)( 11 ), of which 37 % are underweight and 5 % are overweight or obese( Reference Patel, Narayan and Cunningham 12 ). A few FFQ have been used in epidemiological studies among adolescents in India( Reference Swaminathan, Thomas and Kurpad 13 – Reference Raghunatha Rao, Antony and Sarma 15 ), but the validity and reproducibility of these FFQ have not been documented. The 24-HR method has been used by the National Nutrition Monitoring Bureau of India to assess periodically the nutritional status of adolescents in selected states( 16 ). Unlike FFQ, 24-HR are not representative of long-term food intake( Reference Rockett, Berkey and Colditz 17 ) and are also not as practical and cost-effective( Reference Slater, Enes and Lopez 18 , Reference Jayawardena, Swaminathan and Byrne 19 ). The lack of validated dietary instruments limits the information known about the nature of dietary changes that may be occurring among adolescents in India. Assessing the dietary changes that are part of the nutrition transition requires validated dietary instruments to measure long-term trends and changes, not only in food intake but also in eating behaviours.
The objective of the present study was to develop and evaluate the validity and reproducibility of a Nutrition Transition-FFQ (NT-FFQ) to measure nutrition transition-related food consumption and eating behaviours among adolescents aged 14–18 years in South India.
Methods
Setting
The study was carried out from June 2013 to January 2014 in Vijayapura in Karnataka, India. Vijayapura is a mid-sized city (population 350 000) located in Karnataka in a district which is categorized as economically underdeveloped but is urbanizing as a result of the major economic growth of its small-scale industries, including agriculture, and its large-scale industries, including sugar and textiles( 20 ). Vijayapura serves as a prototype mid-sized Indian city that is underdeveloped but undergoing urbanization and experiencing exposure to non-local and global trends( Reference Shaikh, Patil and Halli 21 ). The Institutional Review Board at Emory University, Atlanta, GA, USA and the Institutional Ethical Committee at BLDE University, Vijayapura, India approved the study.
Interviewer recruitment and training
Twelve field interviewers proficient in English and the local language, Kannada, were recruited and trained to administer the NT-FFQ and 24-HR and to obtain the written informed consent from the adolescents’ caregivers and assent from participants. Mock interview sessions were conducted in Kannada prior to field testing of the instrument to ensure that interviewers were familiar with food items and to ensure uniformity in the data collection techniques.
Development of the NT-FFQ
Qualitative fieldwork to identify food items
The NT-FFQ was developed using a sequenced mixed-methods approach including formative qualitative fieldwork. The NT-FFQ comprised a 125-item semi-quantitative FFQ section that measured food consumption over a month and a twenty-seven-item eating behaviour section that quantified eating behaviours over a week. The food items listed in the NT-FFQ were built using two methods: (i) identification of food items, including the commonly consumed local, regional and global foods, from our previous 24-HR from adolescents; (ii) and written freelists of the most commonly available foods and beverages in stores identified by a purposive sample of adolescents (n 26) aged 14–18 years. Freelisting, an elicitation technique, involves asking individuals to list all the items that they can think of for a given cultural domain( Reference Borgatti 22 ). A cultural domain is a collection of items related in the minds of informants, which helps them label, interpret and understand items in their lives. Through these two methods, the food list was built and categorized into ten food groups based on their ingredients and preparation methods: (i) global foods; (ii) snack foods; (iii) non-vegetarian foods; (iv) sweets and desserts; (v) dairy; (vi) beverages; (vii) fruits and seasonal fruits; (viii) vegetables; (ix) traditional foods; and (x) miscellaneous foods. For the eating behaviour section of the NT-FFQ instrument, questions were developed on eating behaviours associated in the literature with the nutrition transition( Reference Adair and Popkin 8 , Reference Wang, Zhai and Du 23 ). The eating behaviours included the adolescent’s practice of eating at friends’ homes or vice versa, the frequency of eating meals at home v. away from home (e.g. at restaurants and at the home of a friend or family member) and the frequency of watching television while eating meals.
Frequency response section of the 125-item NT-FFQ
The NT-FFQ had eleven frequency categories for food consumption over 1 month, from several times per day to never (see online supplementary material, Table S1). The intake of seasonal fruits was asked over a 3-month period, which is the length of a typical season for most seasonal fruits in India. An additional column beside these frequency categories was included to record whether the participant believed that his or her consumption of each food had increased, decreased or remained the same in the past 6 months. This additional column was tailored from a previous study where participants were asked to report if the intake of a food item had greatly increased or decreased during the past 10 years( Reference Salvini, Hunter and Sampson 24 ). This information was added to the traditional FFQ format to capture dietary changes that may be occurring as part of the nutrition transition.
Frequency response section of the twenty-seven-item eating behaviour section
Of the twenty-seven eating behaviour questions, eighteen questions had the response categories of daily, 4–6 d/week, 1–3 d/week and never. One question asked participants if they consumed dietary supplements in the past year. The remaining eight questions asked participants about their perceptions of the novelty of eating habits using a 4-point Likert scale with the options ‘totally traditional’, ‘somewhat traditional’, ‘somewhat modern’ and ‘totally modern’. These eight questions included the perception of a family with a working mother and the perceptions of eating home-cooked food, outside food, eggs, meat and bread, and drinking milk and fruit juice.
NT-FFQ portion size
We specified a standard serving size for each food (e.g. slices of bread, glass of milk) and included an additional column for participants to report the portion size they consumed if different from the one specified. The standard serving size was determined using those listed in the Dietary Guidelines for Indians( 25 ) and those listed most frequently in our previous 24-HR. Portion size estimates were based on household utensils including cups, spoons and natural units (e.g. small, medium and large size for fruits, etc.). Circular food models were constructed to measure traditional Indian breads including chapati and puri that are typically consumed in varying sizes including small, medium or large (see online supplementary material, Fig. S1). Given that packaged foods including chips, chocolates and popcorn were available in several sizes, participants were asked to report both the quantity consumed over 1 month and the cost of one unit of that item (e.g. cost of 1 bar of chocolate). A database of packaged foods was developed to include the items’ cost, weight and nutritional information from the food label. The weight of food in grams was determined according to the cost of the packaged foods and quantity eaten (e.g. 1 bar of chocolate).
Pre-testing the NT-FFQ
The initial NT-FFQ included 154 items and was rigorously pre-tested using cognitive interviews among a purposive sample of five adolescents aged 14–18 years attending a private school in Vijayapura, India. In the pre-test, adolescents were asked to report their usual intake of foods and beverages over a 3-month period. Using established guidelines( Reference Cade, Burley and Warm 26 ), the NT-FFQ was tested for content including the clarity of the meaning of food names, portion-size descriptions, unfamiliar food items, length of the instrument and ease of administration. Cognitive interviews have been shown to help identify cognitive problems in dietary questionnaires and improve the accuracy of FFQ( Reference Subar, Thompson and Smith 27 , Reference Thompson, Subar and Brown 28 ). We observed that adolescents found it difficult to recall food consumption over a 3-month period and reported that it would be easier to recall food intake over a 1-month period, except for seasonal fruits. In addition, adolescents found twenty-nine items unfamiliar (e.g. tofu). Using this feedback, the NT-FFQ was revised to 125 items with a 1-month reference period. The revised 125-item NT-FFQ was pre-tested again in English and Kannada among a convenience sample of sixteen adolescents of the same age attending a private school and a public school, without encountering additional problems. The NT-FFQ was finalized at 125 items to assess food intake over a 1-month period. On average, it took 35–40 min to administer the instrument.
Evaluation of the NT-FFQ
Study population
The reproducibility and validity of the NT-FFQ were evaluated among 200 adolescents aged 14–18 years. These 200 adolescents were interviewed as a part of the follow-up of a longitudinal study of 407 adolescents who participated in the 2012 Home Environment and Adolescent Body Weight study in Vijayapura( Reference Staab, Cunningham and Thorpe 29 ). In the 2012 baseline study, a representative stratified random school-based sample of 407 adolescents was drawn from three public and three private schools in Vijayapura.
Design of the evaluation study
The NT-FFQ was administered during home visits at baseline (NT-FFQ1) and 2 months later (NT-FFQ2) to 200 adolescents. Two adolescents were lost to follow-up during the second administration of NT-FFQ, yielding a final sample of 198 participants. A sub-sample of ninety-seven adolescents completed three additional interviewer-administered 24-HR over the 2-month period as shown in Fig. 1. The interviewers used the multi-pass method for all 24-HR. For each participant, two of the three 24-HR were taken on a weekday and one was taken on the weekend.
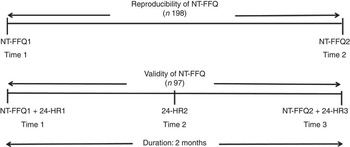
Fig. 1 Design of the reproducibility and validity study to evaluate the Nutrition Transition-FFQ (NT-FFQ) among adolescents in South India. Data were collected in November 2013–January 2014. The NT-FFQ was administered by trained interviewers at homes of 198 adolescents aged 14–18 years at baseline (NT-FFQ1) and after 2 months (NT-FFQ2). A sub-sample of ninety-seven adolescents also completed three interviewer-administered 24 h dietary recalls (24-HR) during the 2 months between NT-FFQ1 and NT-FFQ2
Statistical methods
Data from the NT-FFQ were transformed into daily intake of each food (g/d) and beverage (ml/d). The daily intake was calculated by multiplying the specified portion unit by the frequency of intake, using the following values for reported frequencies: more than 3 times/d=3; twice daily=2; once daily=1; 5–6 times/week=0·79; 2–4 times/week=0·43; once weekly=0·14; 2–3 times/month=0·082; monthly=0·03; less than once monthly=0·016; and never eaten or don’t know the food=0. The 125 foods in the NT-FFQ were collapsed to twenty-one meaningful food groups based on nutrient content as shown in the online supplementary material, Table S2. The reproducibility and validity of the NT-FFQ were assessed using a food-based approach, as done elsewhere( Reference Salvini, Hunter and Sampson 24 , Reference Millen, Midthune and Thompson 30 – Reference Haftenberger, Heuer and Heidemann 35 ).
The reproducibility of the NT-FFQ for foods and food groups was assessed at baseline (NT-FFQ1) and after 2 months (NT-FFQ2) using Spearman and Pearson correlation coefficients, intra-class correlation coefficients (ICC) and cross-classification of food group intakes into tertiles. The measures of agreement or cross-classification were calculated using the percentage of participants in the same (concordance), adjacent and extreme (discordance) tertiles of food intake by both NT-FFQ. The reproducibility of the eating behaviour questions was assessed using weighted kappa (κ w) statistics and cross-classification analyses.
The validity of the FFQ portion of the NT-FFQ was assessed, in a sub-sample of ninety-seven adolescents, by comparing the intakes of twenty-one food groups from the NT-FFQ2 with the average intakes from the three 24-HR. For each individual in the validation study, the daily intakes of foods consumed during each of the three 24-HR were computed and used to calculate the mean daily intakes of foods and foods groups from the three 24-HR. The mixed dishes from the 24-HR were divided into their components and allocated to the appropriate food items of the questionnaire as would routinely be done in the analysis of mixed dishes( Reference Zhuang, Yuan and Lin 36 ). Spearman and Pearson correlation coefficients were used to measure the strength of the relationship between food and food group intakes estimated by NT-FFQ2 and the 24-HR. The relative agreement between NT-FFQ2 and the average of the three 24-HR was tested by cross-classification of the food group intakes and estimation of the proportion of participants who were classified by the two methods into the same tertile (concordance) and extreme tertiles (discordance). To assess the ‘limits of agreement’ between NT-FFQ2 and the average of three 24-HR, the Bland–Altman method was performed for each of the food groups. The differences in intake between the two methods were plotted against the mean intakes of the two instruments for each food group. These estimates were analysed using the statistical software package SAS® version 9.4. P values are two-sided and deemed significant at 0·05.
The face validity of the twenty-seven-item eating behaviour section in the NT-FFQ was evaluated through semi-structured cognitive interviews using paraphrasing and response latency. To evaluate the face validity of the eating behaviour questions, a convenience sample of thirty adolescents aged 14–18 years were selected from one public school and one private school in Vijayapura. Trained interviewers administered the semi-structured cognitive interviews at the home of the participant. To assess paraphrasing, the interviewers elicited a response from the participant and probed for the meaning of each question to ensure consistency with the intent of the question. Response latency was assessed through the time taken to answer each question. In addition, at the end of the interview, the participants were asked if they preferred reporting frequency of eating behaviours over a month instead of over a week.
Results
Demographic characteristics
The demographic characteristics of the participants in the NT-FFQ evaluation study are given in Table 1. Of the 198 school-going adolescents eligible for analysis, the mean age was 16·8 years, 55 % were female and 66 % attended public (government-funded) schools.
Table 1 Characteristics of the adolescents (n 198) in the evaluation study of the Nutrition Transition-FFQ (NT-FFQ) in Vijayapura, IndiaFootnote †
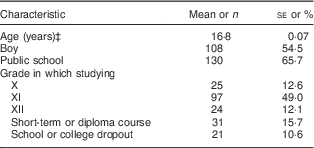
Data were collected in November 2013–January 2014.
† Data are from the second administration of the NT-FFQ (NT-FFQ2).
‡ Age presented as mean and its standard error; all other data presented as number and percentage.
The intake of each food group based on both administrations of the NT-FFQ and the average intake from the three 24-HR are shown in Table 2. The mean daily intake of most food groups was overestimated by the NT-FFQ when compared with the mean daily intake of food groups estimated from the 24-HR. However, intakes were higher when estimated by 24-HR for the fried traditional food group, red meat food group, lean meat food group and sugar food group.
Table 2 Comparison of food group intakes estimated from the Nutrition Transition-FFQ (NT-FFQ) and the average of the three 24 h dietary recalls (24-HR) among adolescents in Vijayapura, India
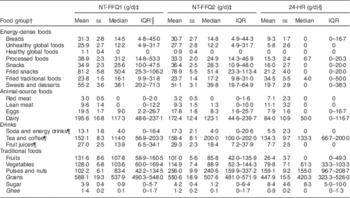
NT-FFQ1, first administration of the NT-FFQ; NT-FFQ2, second administration of the NT-FFQ; IQR, interquartile range.
Data were collected in November 2013–January 2014.
† For analysis, the 125 items in the NT-FFQ were reduced to twenty-one meaningful food groups.
‡ A total of 198 adolescents aged 14–18 years were in the reproducibility study.
§ A sub-sample of ninety-seven adolescents aged 14–18 years were in the validity study.
║ IQR of 25–75 % of the population.
¶ Data presented as ml/d.
Reproducibility
Estimates of the reproducibility and validity of the NT-FFQ are given in Table 3. The Spearman correlation coefficients for foods ranged from 0·12 (cooked lentils) to 0·80 (red meat; mean=0·51). For food groups, the Spearman correlations ranged from 0·33 (pulses and nuts) to 0·80 (red meat; mean=0·58) and ICC ranged from 0·05 (fruits) to 1·00 (tea and coffee; mean=0·94). Of the twenty-one food groups, Spearman correlation coefficients were ≥0·5 for sixteen food groups and ≥0·7 for five food groups. On average, concordance was 60 % and discordance was 7 %. Very good concordance (≥65 %) was determined for lean meat, ghee (clarified butter) and the healthy global food group comprising oats, cereal and multigrain biscuits. The analysis showed good concordance (50–65 %) for the food groups dairy, tea and coffee, red meat, sugar, soda and energy drinks, unhealthy global foods, eggs, fried snacks, grains, fried traditional foods, breads, processed foods, fruit juices, vegetables, snacks, and sweets and desserts; and fair concordance (30–49 %) for the food groups fruits and pulses and nuts. The discordance was less than 10 % for all food groups except for fruit juices (12 %) and snacks (11 %).
Table 3 Reproducibility and validity of the Nutrition Transition-FFQ (NT-FFQ) among adolescents in Vijayapura, India
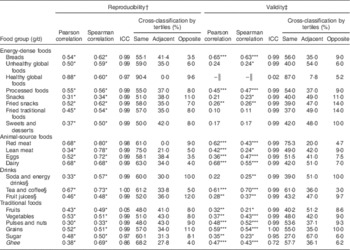
ICC, intra-class correlation coefficient.
Data were collected in November 2013–January 2014.
*P<0·05, **P<0·01, ***P<0·001.
† Reproducibility of the NT-FFQ is the comparison of NT-FFQ1 (first administration of the NT-FFQ) v. NT-FFQ2 (second administration of the NT-FFQ). There were 198 adolescents aged 14–18 years in the reproducibility study.
‡ Validity of the NT-FFQ is the comparison of NT-FFQ2 v. the average of the three 24 h dietary recalls (24-HR). A sub-sample of ninety-seven adolescents were in the validity study.
§ Data presented as ml/d.
║ Spearman and Pearson correlations cannot be computed as there is no reported intake of the global healthy foods in the three 24-HR.
For eating behaviours, κ w ranged from 0·24 (eating snacks while watching television) to 0·67 (eating lunch at home) with a mean of 0·40, suggesting moderate agreement (Table 4). On average, the concordance (exact agreement) was 59 % and discordance (opposite agreement) was 1 %. Concordance ranged from 42 % (practice of eating sweets prepared outside the home and eating sweets prepared at home) to 94 % (practice of eating dinner at home). Discordance was ≤4 % for twenty-four of the twenty-seven eating behaviour questions. A maximum discordance of 5 % was found for the practice of eating breakfast outside home and for the perception question, from totally traditional to totally modern, of a family with a working mother.
Table 4 Reproducibility of the twenty-seven eating behaviour questions in the Nutrition Transition-FFQ for adolescents in Vijayapura, India
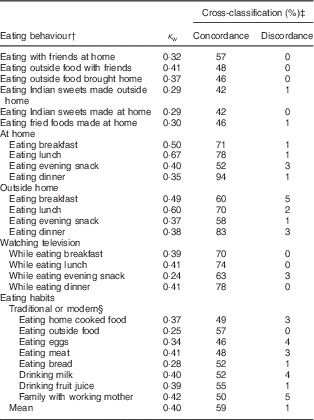
κ w, weighted kappa.
Data were collected in November 2013–January 2014.
† A total of 198 adolescents aged 14–18 years were in the reproducibility study.
‡ Cross-classification: concordance (exact agreement) and discordance (opposite agreement).
§ Perceptions of the novelty of eating habits were asked using a 4-point Likert scale with the options ‘totally traditional’, ‘somewhat traditional’, ‘somewhat modern’ and ‘totally modern’.
Validity
For the 125-item NT-FFQ, Spearman correlation coefficients for foods ranged from 0·14 (buns) to 0·79 (chocolate milk powder; mean=0·39) and for food groups ranged from 0·11 (fried traditional foods) to 0·70 (tea or coffee; mean=0·37). The ICC for food groups ranged from 0·02 (healthy global foods) to 1·00 (grains; mean=0·93). Of the twenty-one food groups, Spearman correlation coefficients were ≥0·5 for five food groups and ≥0·3 for eleven food groups. Comparing the intakes of food groups between the NT-FFQ and the 24-HR, concordance was 49 % and discordance was 8 %. The agreement analysis revealed very good concordance (≥65 %) for the red meat and healthy global food groups; good concordance (50–65 %) for the food groups tea and coffee, ghee, breads, grains, pulses and nuts, processed foods and eggs; fair concordance (30–49 %) for vegetables, fruit juices, sweets and desserts, dairy, unhealthy global foods, snacks, fruits, fried snacks, soda and energy drinks, and fried traditional foods; and low concordance (27 %) for sugar. The discordance was less than 10 % for all food groups except for the fried snacks (14 %) and fried traditional foods (14 %). The Bland–Altman plots showed acceptable agreement for food groups between the NT-FFQ2 and the 24-HR as shown in Fig. 2.
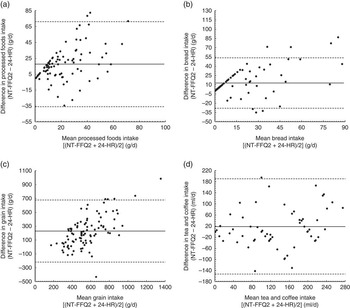
Fig. 2 Bland–Altman plots assessing the relative validity of the Nutrition Transition-FFQ (NT-FFQ) among adolescents (n 97) in Vijayapura, India, data collected in November 2013–January 2014. The difference in intake between the second administration of the NT-FFQ (NT-FFQ2) and the average of the three 24 h dietary recalls (24-HR) is plotted v. the mean intake from the two methods for: (a) processed foods, (b) breads, (c) grains and (d) tea and coffee. —— represents the mean difference (bias) and – – – – – represent the limits of agreement (±2 sd)
The twenty-seven-item eating behaviour questions in the NT-FFQ were found to have acceptable face validity. Through the assessment of paraphrasing, participants were found to be able to understand, explain and repeat the questions in their own words. Additionally, all participants reported that it was easier to report eating behaviours over a week as opposed to over a month.
Discussion
Changing dietary patterns from the ongoing nutrition transition among adolescents in India have drawn attention to the lack of validated dietary instruments to assess the nutrition transition among this population. To address this gap, we followed a sequenced mixed-methods approach to develop and to evaluate a dietary instrument, the NT-FFQ, which can be used to assess the nutrition transition among adolescents in South India. This NT-FFQ provides reasonably reproducible and valid estimates for most foods, food groups and eating behaviours in India. To our knowledge, it is the first validated FFQ for adolescents in India and the first validated dietary instrument to assess nutrition transition-related food consumption and eating behaviours.
As seen in other studies among adults( Reference Bohlscheid-Thomas, Hoting and Boeing 31 , Reference Zhuang, Yuan and Lin 36 – Reference Mahajan, Malik and Bharathi 38 ) and adolescents( Reference Araujo, Yokoo and Pereira 39 , Reference Tabacchi, Filippi and Breda 40 ), the FFQ overestimated intakes relative to the reference method for most food groups. In Western settings, correlations in the range of 0·5–0·7 for food intakes are considered acceptable( Reference Willett 41 ). The direct comparison of our study with similar FFQ evaluation studies is complicated by the fact that the food groups chosen were not similar across studies. Reference instruments also differed between studies( Reference Salvini, Hunter and Sampson 24 , Reference Huybrechts, De Backer and De Bacquer 33 ). To the extent that comparisons can be made for evaluating the reproducibility of FFQ for individual foods and food groups, Spearman correlation coefficients for our study are comparable to those described for other studies( Reference Salvini, Hunter and Sampson 24 , Reference Bohlscheid-Thomas, Hoting and Boeing 31 , Reference Ocke, Bueno-de-Mesquita and Goddijn 34 , Reference Colditz, Willett and Stampfer 42 ). In our study, Spearman correlation coefficients were ≥0·7 for five food groups and ≥0·5 for the remaining sixteen of twenty-one food groups, suggesting that the reproducibility of the NT-FFQ was good. The Spearman correlation coefficients for the reproducibility of the NT-FFQ tended to be higher (≥0·65) for commonly consumed foods than for infrequently consumed foods (<0·30), as reported elsewhere( Reference Wiecha, Hebert and Lim 43 ). Salvini et al. reported Pearson correlation coefficients >0·70 for 23 % of the foods and >0·50 for 73 % of the foods on a fifty-five-item self-administered FFQ completed 6 months apart among 173 women in the Nurses’ Health Study( Reference Salvini, Hunter and Sampson 24 ). Even though Pearson correlation coefficients were reported, these were found to be very similar to the Spearman correlation coefficients( Reference Salvini, Hunter and Sampson 24 ). Another study among 1497 women that compared two Nurses’ Health Study FFQ (1979 FFQ version v. 1980 FFQ version) found that Spearman correlation coefficients ranged between 0·34 (readymade pie) and 0·76 (tea)( Reference Colditz, Willett and Stampfer 42 ). In a third study, high reproducibility using Spearman correlations (r ≥ 0·7) was reported for half of the food groups and moderate reproducibility (r<0·7) was reported for the other half of the food groups( Reference Bohlscheid-Thomas, Hoting and Boeing 31 ). The validation study was carried out among 104 German adults aged 35–64 years who completed a 158-item FFQ administered at two intervals, 6 months apart, and 24-HR at monthly intervals( Reference Bohlscheid-Thomas, Hoting and Boeing 31 ). Ocke et al. reported Spearman correlations for foods and food groups in the range from 0·45 to 0·92 (median r=0·7) on a 178-item self-administered FFQ completed thrice during 6-month intervals among 121 adults( Reference Ocke, Bueno-de-Mesquita and Goddijn 34 ).
In our study, discordance (extreme tertiles) between the intakes in NT-FFQ1 and NT-FFQ2 was <10 % (range: 3·5–12 %) for most foods groups except for fruit juices (12 %) and snacks (11 %). Fruit intakes had a low ICC of 0·05 with 8 % being misclassified. In an FFQ validation study among ninety-nine participants interviewed within 1·5 years, the concordance (exact agreement) ranged from 57 % (coleslaw) to 98 % (vodka)( Reference Graham, Lilienfeld and Tidings 44 ). In another study where an FFQ was administered to sixty-three participants at the beginning and the end of 3 months, the concordance (same or adjacent category) was 90 %( Reference Acheson and Doll 45 ).
The validity of the NT-FFQ to measure nutrition transition was assessed against the 24-HR. In the validation of FFQ, mean correlation coefficients of 0·40 are indicative of good validity between the FFQ and the reference methods( Reference Samaras, Kelly and Chiano 46 ), whereas correlations in the range of 0·50–0·70 are desired between the study and reference methods( Reference Willett 41 ). In the present study, the mean Spearman correlation coefficient was 0·37 with the correlations ≥0·40 for seventeen of the twenty-one food groups, indicating fair agreement. Other FFQ studies, validated for foods and foods groups, have reported correlation coefficients ranging from 0·3 to 0·8( Reference Salvini, Hunter and Sampson 24 , Reference Bohlscheid-Thomas, Hoting and Boeing 31 , Reference Huybrechts, De Backer and De Bacquer 33 , Reference Haftenberger, Heuer and Heidemann 35 ). In the validation of a 158-item FFQ among middle-aged German adults, Spearman correlations for foods and food groups between FFQ2 and 24-HR showed values between 0·14 and 0·90, with most between 0·4 and 0·6( Reference Bohlscheid-Thomas, Hoting and Boeing 31 ). Four food groups yielded correlations >0·6, eleven groups showed values between 0·4 and 0·6, and the remaining nine food groups yielded correlations <0·4( Reference Bohlscheid-Thomas, Hoting and Boeing 31 ). In another study that validated a fifty-three-item FFQ among German adults aged 18–80 years, Spearman rank correlations between the FFQ and two 24-HR ranged from 0·15 (pizza) to 0·80 (tea), with two-thirds of the Spearman correlations >0·30( Reference Haftenberger, Heuer and Heidemann 35 ).
The cross-classification of intakes (concordance and discordance) reported in NT-FFQ2 and the three 24-HR in our study is similar to that reported in other studies( Reference Bohlscheid-Thomas, Hoting and Boeing 31 , Reference Huybrechts, De Backer and De Bacquer 33 , Reference Zhuang, Yuan and Lin 36 ). In a study that evaluated food group intakes from an FFQ against a 3 d diet record among Flemish children, the concordance (same or adjacent category) was 67 % (meat products) to 88 % (fruit juices) and discordance (opposite category) was <10 % for all food groups( Reference Huybrechts, De Backer and De Bacquer 33 ). In the paper by Bohlscheid-Thomas et al., the concordance (exact quintile) ranged from 21·2 % for legumes to 59·6 % for alcoholic drinks, with most values lying between 30 and 40 %, and discordance (extreme quintile) was <4·8 %( Reference Bohlscheid-Thomas, Hoting and Boeing 31 ). As reported by Haftenberger et al., the concordance (same or adjacent quartile) ranged between 68 % (cooked vegetables) and 94 % (coffee)( Reference Haftenberger, Heuer and Heidemann 35 ). Similar to our study, other studies reported that discordance was <10 % for most food groups( Reference Haftenberger, Heuer and Heidemann 35 , Reference Zhuang, Yuan and Lin 36 ). The low concordance between NT-FFQ1 and NT-FFQ2 for lentils and pulses may stem from the large number of foods in the group, some that are eaten more frequently than others; which may make it challenging to estimate the average monthly intake. For instance, in Indian households, pigeon pea (tur dal) is typically consumed more frequently than kidney beans (rajma).
Bland–Altman plots were generated to visually examine the agreement between the NT-FFQ and 24-HR across the range of intake of food groups. The Bland–Altman method also allows one to identify bias between the administration of the questionnaires and to see the nature of the bias across the range of intakes( Reference Bland and Altman 47 ). As given in Fig. 2, the Bland–Altman plots of food groups demonstrated good agreement between the NT-FFQ and 24-HR. For all food groups, fewer than 10 % of the participants were outside the limits of agreement.
The present study has certain limitations that need to be taken into account. First, dietary assessment of children has been shown to have methodological problems relating to their limited knowledge of foods, difficulty in the estimation of frequency of consumed foods and potential response bias( Reference Rockett, Breitenbach and Frazier 48 – Reference Hebert, Gupta and Bhonsle 50 ). As participants were interviewed at home often in the presence of one or more family members, a potential response bias may have resulted. However, the reliability of dietary recalls from 14–18-year-olds should not be a concern as numerous studies have reported that by age 8–10 years, children can report their food intake as reliably as their parents( Reference Livingstone, Robson and Wallace 49 , Reference Emmons and Hayes 51 , Reference Jenner, Neylon and Croft 52 ). Second, the 125-item NT-FFQ took 35–40 min to complete and might be considered lengthy, but a response rate of 99 % shows that participants were motivated to participate in the study. The length of the NT-FFQ also falls within the acceptable 130-item limit at which adolescents have been found willing to complete long questionnaires( Reference Willett 41 ). Third, the sources of error in FFQ have been reported as due to the restriction imposed by a fixed list of foods, seasonal and regional variations in the availability of foods, memory, perception of portion sizes and interpretation of questions( Reference Willett 41 ). However, given the vast variety of foods and beverages and their variations across India, the NT-FFQ was developed to capture the salient intakes of global, national and regional items as relevant to adolescents in South India. We expect minimum error in the measurement of seasonal foods, given that the NT-FFQ and 24-HR were administered within the same winter season (November–January), and expect minimum error in the measurement of seasonal fruits as their intake was recorded over the length of a typical season. Across the three recorded 24-HR, participants did not consume twenty-nine of 125 foods listed on the NT-FFQ. Of the twenty-nine foods, seven were seasonal foods that were not typically consumed during the period of the validation study and the remaining foods were infrequently consumed (once monthly or less) by adolescents. These twenty-nine foods were likely to be consumed at festivals, in summer or may be relatively new to this region. Fourth, the low ICC (0·02) for the intake of healthy global foods between the NT-FFQ2 and 24-HR may be attributed to their infrequent intake (0·3 g/d or less than once monthly). The healthy global food group includes oats, breakfast cereals and multigrain biscuits, which are not commonly consumed by adolescents in our study. However, some infrequently consumed foods were included in the NT-FFQ to capture foods that may be relatively new to this region but may soon become a part of the local food environment. This phenomenon is corroborated in a similar study that reported low probability of eating rarely consumed foods( Reference Haftenberger, Heuer and Heidemann 35 , Reference Zhuang, Yuan and Lin 36 ). In order to validate the intake of infrequently consumed foods with better accuracy we would require large calibration studies, as reported elsewhere( Reference Midthune, Schatzkin and Subar 32 ). The documentation of the increasing availability of global, national and regional foods not only in urban regions but also in remote, but urbanizing regions is a large part of our work. Further research could explore how adolescents’ access to and selection of foods may be influenced by the food marketplace in India.
The present study offers several strengths. First, the estimates of reproducibility and validity of the foods in the NT-FFQ were evaluated with a comprehensive range of tests, including correlations coefficients and cross-classification in conjunction with the Bland–Altman method. The Bland–Altman method has been preferred over correlation analysis as a method to evaluate the reproducibility and validity of an FFQ( Reference Cade, Thompson and Burley 53 ). Furthermore, the sample size of the present study was large enough to allow for the estimation of the limits of agreement from the Bland–Altman analysis as a component of the evaluation of the validity of the NT-FFQ. Second, the reproducibility of the eating behaviour questions was assessed using cross-classification and κ w. The use of semi-structured cognitive interviews strengthened the validation of the eating behaviour questions. Third, the validated NT-FFQ can serve as a useful instrument in ranking adolescents according to both food intake and eating behaviours, and can be used in epidemiological research. Lastly, the acceptable measures of agreement between the NT-FFQ and 24-HR may be a result of the NT-FFQ’s flexibility wherein participants were able to describe a portion size if they did not find a suitable portion size on the questionnaire. This method, where participants are able to describe their own portion size, has been found to provide the highest estimates of correlation coefficients (0·5–0·6) compared with the method where portion size is specified on the questionnaire (correlation coefficients=0·4–0·5) or when no portion size is specified but the average portion weights are used to compute intakes (correlation coefficients=0·2–0·5)( Reference Cade, Thompson and Burley 53 ).
Conclusion
Globalization and nutrition transition in India have drawn attention to the lack of existing validated dietary instruments to assess the food consumption and eating behaviours of adolescents. To address this gap, we developed and evaluated an NT-FFQ for adolescents; this NT-FFQ has good reproducibility and acceptable validity for most food groups and eating behaviours. The NT-FFQ can be used in epidemiological studies to assess food intakes and eating behaviours associated with the nutrition transition among adolescents in South India. Our team is evaluating the NT-FFQ among adolescents residing in an urban region in South India. The development of the NT-FFQ represents an important and much needed first step that allows us to measure dietary changes and eating behaviours among adolescents in a globalizing society.
Acknowledgements
Acknowledgements: The authors would like to thank Dr Veena Algur at BLDE University for her assistance with translation from English to Kannada and Dr Rob O’Reilly at the Emory Center for Digital Scholarship for his assistance with data merging. The authors would like to thank the field research team and the adolescents for their participation in this study. Financial support: This work was supported by the Eunice Kennedy Shriver National Institute of Child Health and Human Development (NICHD; grant number 3D43HD065249-03S1). N.I.S. was supported by the National Institutes of Health (NIH; grant number 1 R25 TW009337-01) funded by the Fogarty International Center and the 2013 Amy Joye Memorial Research Award from the Academy of Nutrition and Dietetics Foundation. Disclosure: This work is solely the responsibility of the authors and does not necessarily represent the official views of the Fogarty International Center, NIH or the Academy of Nutrition and Dietetics Foundation. The Fogarty International Center, NIH and the Academy of Nutrition and Dietetics Foundation had no role in the design, analysis or writing of this article. Conflict of interest: None. Authorship: N.I.S. and S.A.C. formulated the research question; N.I.S., J.K.F., U.R. and S.A.C. designed the study; N.I.S. and S.S.P. carried it out; N.I.S. analysed the data, with interpretative input from all authors; N.I.S. drafted the manuscript; all authors helped to revise the manuscript and approved the final version. Ethics of human subject participation: The Institutional Review Board at Emory University, Atlanta, GA, USA and the Institutional Ethical Committee at BLDE University, Vijayapura, India approved the study.
Supplementary material
To view supplementary material for this article, please visit http://dx.doi.org/10.1017/S1368980016003335


