In Canada, 32·0 % of children aged 5 to 17 years were overweight between 2009 and 2011( 1 ). The school setting is recognized as providing a unique opportunity to expose all children to an environment that offers healthy foods, promotes regular physical activity and translates lifelong skills for healthy eating and active living( Reference Wechsler, Devereaux and Davis 2 – Reference Glanz, Sallis and Saelens 4 ). Indeed, Briefel et al.( Reference Briefel, Wilson and Gleason 5 ) estimated that secondary-school students get 26 % of their energy from foods consumed at school. Schools can also influence families and the community through their health-promotion interventions( Reference Glanz, Sallis and Saelens 4 ). Consequently, by modifying aspects of the school food environment such as food offerings and dining areas, health-promotion strategies have the potential to enhance individual behaviours( Reference Cohen, Scribner and Farley 6 ).
In 2007, the provincial government of Quebec (Canada) disseminated a three-part Framework Policy guiding school-based strategies to promote healthy weights( 7 ). The first component follows recommendations from Canada’s Food Guide( 8 ) and advocates, among other things, low-fat dishes; fruit-based desserts and snacks; whole-grain products; and 100 % pure juices, in addition to milk and water. The second component suggests eliminating foods of low nutritional value, such as fried foods and sweetened beverages, from all school food offerings. The third component addresses the provision of appropriate areas and conditions for eating meals.
Studies pertaining to school food environments have dealt primarily with policy implementation( Reference Pettigrew, Pescud and Donovan 9 – Reference Masse and de Niet 11 ) and the quality of food offerings in( Reference Perlman, Nonas and Lindstrom 12 ) and around the school( Reference Davis and Carpenter 13 – Reference Simon, Kwan and Angelescu 15 ). Research has also revealed associations between the school food environment and school size, population density and neighbourhood characteristics. For example, school size has been found to influence the diversity of food offerings – healthy or otherwise – since catering profitability is tied to sales( Reference Morin, Demers and Gray-Donald 16 ). Large schools may also have larger budgets, enabling them to implement measures to develop a more favourable food environment. The population density around schools also appears to influence the school food environment; a Canadian study found that relative to urban schools, schools in small towns and rural areas had poorer food environments and higher prevalence rates of overweight( Reference Simen-Kapeu, Kuhle and Veugelers 17 ). Indirect evidence suggests a possible association between the socio-economic status of the school and the school food environment. Namely, the density of fast-food restaurants around schools positively associates with students’ BMI( Reference Hollands, Campbell and Gilliland 18 , Reference Stark, Neckerman and Lovasi 19 ) and inversely associates with neighbourhood income( Reference Zenk and Powell 14 , Reference Simon, Kwan and Angelescu 15 , Reference Hollands, Campbell and Gilliland 18 , Reference Stark, Neckerman and Lovasi 19 ). To the best of our knowledge, no study has directly addressed the relationship between the socio-economic status of the school, measured by family income of neighbourhood residents with children under 18 years of age, and the school food environment. Our research thus responds to this lacuna by asking if school characteristics measured by the low-income index, size (total number of students) and the population density are associate with the school food environment.
Methods
Conceptual model
Drawing inspiration from the Quebec Framework as well as Cohen’s structural model of health behaviours at the population level( Reference Cohen, Scribner and Farley 6 , 7 , 20 ), we developed a conceptual model for the school food environment comprising five environmental components as shown in Fig. 1.

Fig. 1 (colour online) Conceptualization of the school food environment (LICO, low-income cut-off)
Among the school environment components in the right-hand side of Fig. 1, the availability of healthy food offerings can create social norms based upon healthy diet and, in so doing, positively influence students’ attitudes and beliefs. Physical structures include the availability and access to specified eating areas as well as the physical layout of these areas. Policy and organizational structures are described by working procedures, roles and routines that concern food services and resources. Economic structures refer specifically to the rules that guide the selection of resources as a function of budget. Educational and promotional activities refer to the circulation of educational materials and information in the school regarding healthy eating.
Study population
We conducted a cross-sectional survey of food offerings and physical activity in Quebec schools between October 2008 and March 2009. Small schools (primary, fewer than forty students; secondary, <100 students), vocational-training centres, Aboriginal schools and private vocational schools (e.g. for disabled students) were excluded in order to ensure that the sample was homogeneous with respect food availability and physical activities. Moreover, English-language schools and remote schools (i.e. hard to reach by car or located more than 250 km from each other) were excluded for financial reasons. The study was conducted according to the guidelines laid down in the Declaration of Helsinki and all procedures involving human subjects were approved by the research ethics committee of the Estrie Health and Social Services Centres (CER # 08-005).
Sampling frame
In order to produce a reliable and representative sample of schools in the province of Quebec, we used a two-stage stratified sampling technique. For the first sampling stage, eleven out of the seventeen administrative regions were selected. This included the four most populated metropolitan regions in Quebec, a random selection of five out of the nine regions located within 100 km from the selected metropolitan regions, and two of the three remote regions (beyond 100 km from the selected metropolitan regions). For the second sampling stage, the number of schools randomly selected per region was proportional to the number of schools in each of the eleven administrative regions. The initial sample comprised 216 schools (Fig. 2). Schools were recruited through direct telephone calls and emails to the school board directorate and the principal. Letters explaining the aims of the study, the benefits and inconveniences were thus provided to all schools invited to participate in our study.
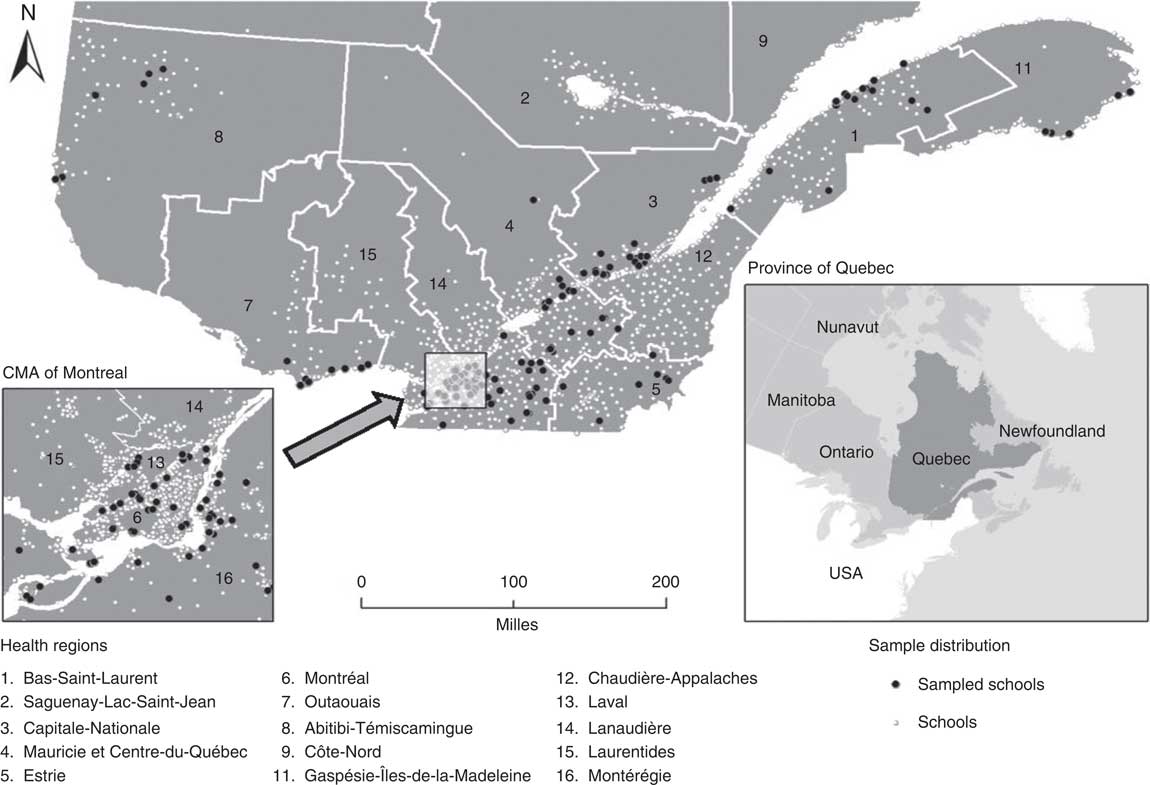
Fig. 2 Geographic location of the target schools (CMA, census metropolitan area)
Data-collection procedure
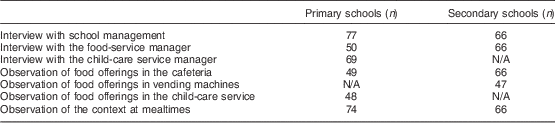
Registered dietitians and nutrition technicians received four days of training during which time the procedures and techniques to follow during data collection were taught and practised. This assured stability in how data collection was completed to avoid subjective assessments. Data were collected during a full day and included observations and questionnaires. Questionnaires were completed with school principals, food-service managers and child-care service managers and queried the food environment within the school. Observation checklists recorded all foods available to students in the cafeteria, vending machines and child-care service. Observations also documented meal contexts. The observation checklist and questionnaire were validated beforehand by a committee of experts and then pre-tested in forty-two Quebec schools. Table 1 presents the number of completed questionnaires for each data-collection strategy.
Table 1 Data-collection strategies for each institution typeFootnote *
N/A, not applicable.
* Schools that did not have food services were not surveyed.
Measures
School food environments
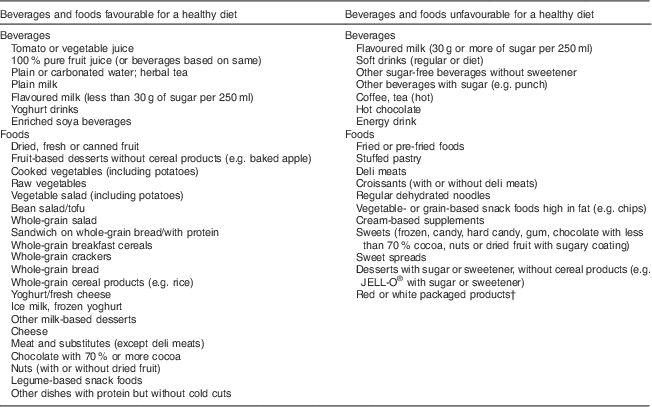
The observation checklist, based on the work of Oldenburg et al.( Reference Oldenburg, Sallis and Harris 21 ), Quebec studies( Reference Côté, Déry and Vanier 22 , Reference Beauchesne-Rondeau and Chaumette 23 ) and the Framework Policy( 7 ), recorded all foods and beverages offered to students for lunch on cafeteria service lines on the day of the visit, in the vending machines and in the child-care service. Foods were recorded dichotomously on the checklist (available or not; yes/no). Given that a school can offer both foods of high and low nutritional value, two indices were created according to the Canadian Food Guide which served to define these food groups and their serving sizes. The ‘index of favourable food offerings in the cafeteria’ was defined based on the availability (yes/no) of the following four food groups: (i) milk or enriched soya beverages; (ii) vegetables/fruit in the dishes on the daily menu as a whole or as side dishes; (iii) an adequate serving of protein in the dishes on the daily menu as a whole or in at least one à la carte dish on the menu; and (iv) an adequate serving of whole-grain products or potatoes in the dishes on the menu. The ‘index of unfavourable food offerings’ refers to the availability of at least one of: (i) beverages containing added sugar, sweetener or caffeine; (ii) foods high in fat, sugar or containing sweeteners; (iii) fried foods; or (iv) deli meats (see Appendix). Vending machines with at least 75 % foods/beverages of good nutritional value met the criterion for a healthy food offering.
The foods and beverages sold during school-related activities (fundraising campaigns, special events, tastings, cooking activities) were inventoried on a checklist consisting of fifteen food categories based on the Appendix. For example, the foods and beverages of low nutritional value (n 7) corresponded to beverages with added sugar, pastries and other foods high in fat or sugar and salty snack foods; and the foods and beverages of high nutritional value (n 8) corresponded to fruits and vegetables, pure fruit juice and dishes with sufficient protein.
The four remaining school food environment components pertaining to school policy and organizational, physical, economic structures, as well as school educational and promotional activities were obtained through a questionnaire completed as part of an interview. Principals, child-care managers and food-service managers, in accordance with their respective roles, provided information regarding the type of menu served, the presence of food outlets within a 10 min walk from the school, assistance measures, foods sold or consumed during school-related activities and foods eaten during activities at the child-care service.
Socio-economic and demographic characteristics of the school
Three socio-economic and demographic characteristics of the school environment were measured by: (i) population density; (ii) school size; and (iii) low-income index (Fig. 1). Population density was determined by dividing the number of inhabitants in each municipality containing a participating school by the municipality’s area (in square kilometres). Number of inhabitants and school size are collected regularly by the Quebec government( 24 , 25 ). Data used to create the low-income index come from the Canadian census at the dissemination area level (a dissemination area comprises an average of 700 individuals). The low-income cut-off (LICO) indicates the proportion of families with children aged between 0 and 18 years living under the low-income threshold, within all dissemination areas for which there is at least one student registered to that specific school( 26 ). The LICO is calculated for each school and schools are scored from 1 (most privileged) to 10 (most deprived).
Statistical analysis
The analyses were performed separately for primary and secondary schools using the statistical software package IBM SPSS Statistics version 19·0. Given the skewed data distribution, the median and interquartile ranges (IQR) were used. The characteristics of the primary and secondary schools were compared using the Mann–Whitney U test, which is used to compare two samples that are small or have skewed distributions. Descriptive analyses were also carried out for each of the five school food environmental components. We used Spearman’s rho and the Mann–Whitney U test to check for associations between school environmental components and the socio-economic characteristics of the school environment instead of their parametric counterparts. Spearman’s rho is suitable for assessing correlations between two continuous variables with skewed distributions. The data in the study were weighted to take into account the real proportion of public primary and secondary schools in each administrative region included in the study. The weighting also included a post-stratification factor to ensure the representativeness of the student samples with respect to the study population. A threshold of significance of 95 % was used to interpret the statistical significance of probability tests, corresponding to a P value of <0·05.
Results
A total of 143 schools took part in the study (seventy-seven primary and sixty-six secondary). Table 2 provides the schools’ characteristics. This sample corresponds to a 66·2 % response rate. A total of sixty schools declined to participate in the study, nine could not be contacted and four were excluded because they did not meet the selection criteria. No significant differences were observed between the participating and non-participating schools in terms of school size (U=5053·5, P=0·702). Significantly fewer schools with more deprived families (LICO, U=3853·0, P=0·002) and fewer schools located in densely populated areas (U=3422·5, P<0·001) took part in the study.
Table 2 CharacteristicsFootnote * of primary and secondary schools surveyed, Quebec, Canada, 2008–2009
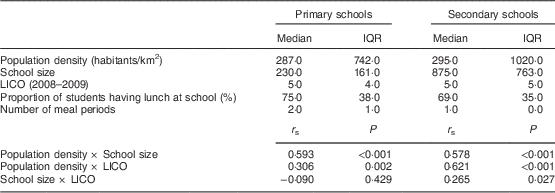
IQR, interquartile range; LICO, low-income cut-off; r s, Spearman’s rho.
* Weighted data.
School food environments
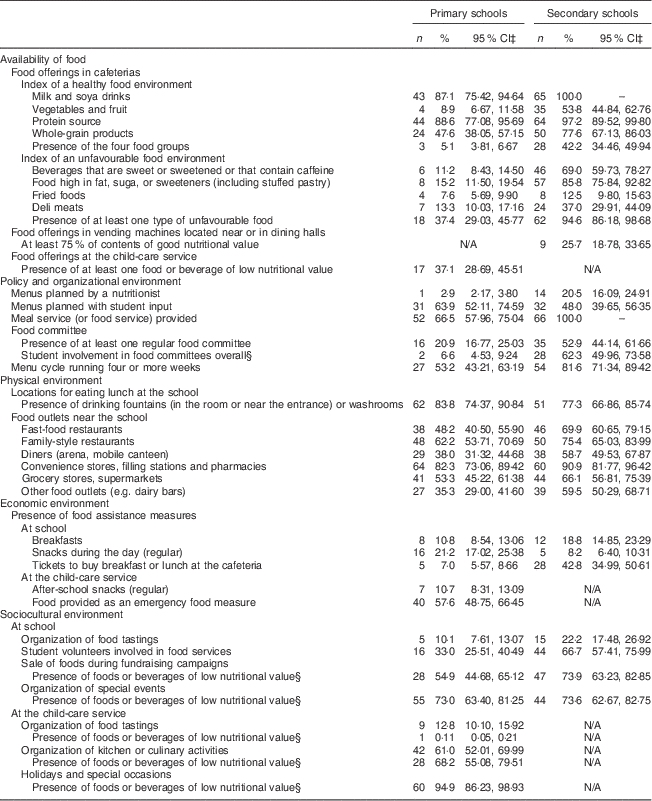
Based on the index of favourable food offerings in the cafeteria, 42·2 % of the secondary- and 5·1 % of the primary-school cafeterias offered an adequate serving size for each of the four food groups (Table 3). A high proportion of secondary schools offered sugar-sweetened beverages (69·0 %) and foods high in fat, sugar or containing sweeteners (85·8 %). Vending machines offering foods/beverages of high nutritional value (i.e. at least 75 % of the contents) were found in just one out of four high schools. At the child-care service, the median number of foods of good nutritional value was 5 (IQR 4).
Table 3 Descriptive statisticsFootnote *,Footnote † related to school environmental components in the primary and secondary schools surveyed, Quebec, Canada, 2008–2009
N/A, not applicable.
* Schools that did not have food-related facilities were not surveyed.
† The percentages vary according to the number of questionnaires and missing data.
‡ Binomial proportion confidence interval.
§ Among schools providing this type of product or service.
In terms of policy and organization, practically none of the elementary schools called upon the services of a registered dietitian to plan their menus (2·9 %) or involved students on food committees (6·6 %). The secondary schools as a whole offered lunchtime meal service and about half had a regular food committee (52·9 %). Students in primary and secondary schools were respectively provided a median of 33 (IQR 14) min and 65 (IQR 16) min to eat lunch.
The food outlets found most often in the vicinity (i.e. 10 min walk) of the participating schools were convenience stores, service stations and pharmacies. The food assistance programme most frequently implemented in primary schools (21·2 %) provided snacks during the school day, whereas secondary schools most often distributed tickets to purchase meals (42·8 %). The median price of the daily menu was CAN$ 4·00 in both the primary (IQR CAN$ 0·54) and secondary (IQR CAN$ 0·88) schools.
The foods and beverages offered during fundraising campaigns had low nutritional value in 54·9 % of the primary schools and in 73·9 % of the secondary schools. At the child-care services, cooking and culinary activities were more popular (61·0 %) than food tastings (12·8 %) as educational and promotional activities. The majority of child-care services offered foods and beverages of low nutritional value on special occasions and during cooking activities (respectively, 94·9 % and 68·2 %).
School socio-economic and demographic characteristics and school food environments
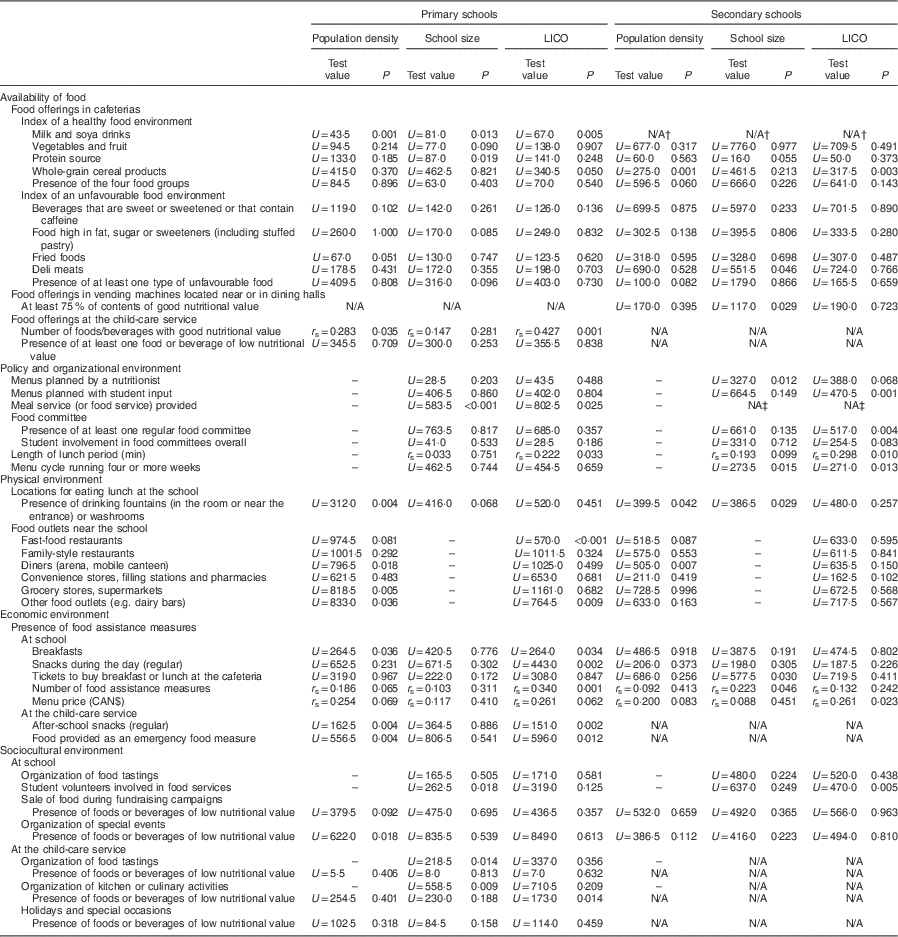
Table 4 summarizes the correlates of school environmental components.
Table 4 CorrelatesFootnote * of school environmental components in the primary and secondary schools surveyed, Quebec, Canada, 2008–2009
LICO, low-income cut-off; U, Mann–Whitney U test; r s, Spearman’s rho; N/A, not applicable; –, the association was not tested due to lack of relevance.
* Schools that did not have food-related facilities were not surveyed.
† The secondary schools as a whole offered soya milk or beverages.
‡ The secondary schools as a whole had a meal service.
Primary schools
Low income index
Overall, the LICO of a school was not associated with the availability of foods with high nutritional value. Schools offering foods and beverages of good nutritional value during child-care services were located in more disadvantaged and high-density areas.
In terms of the political and organizational structures, LICO schools were less likely to offer students food services and more likely to provide shorter lunch periods. These schools also had a greater probability of being surrounded by fast-food restaurants and businesses such as dairy bars. They also offered more food assistance programmes, snacks and ‘emergency’ foods during child-care services. Furthermore, child-care services in LICO schools tended to offer foods and beverages of low nutritional value at special events and during cooking activities. The socio-economic characteristics of the school environment were not associated with the quality of food offerings during fundraising campaigns, tastings organized at the school or for holidays.
School size
The availability of foods with high nutritional value was not associated with the demographic characteristics of the school. The size of the school was, however, significantly associated with the existence of food services; larger schools were more likely to offer food services. Schools having more tastings and cooking activities in their child-care services tended to be larger.
Population density
Overall, schools situated in more densely populated areas were exposed to fewer diners (food outlets) and grocery stores/supermarkets, but to more businesses such as dairy and candy bars. Additionally, such schools were less likely to have a cafeteria with access to functioning drinking fountains or sinks. Schools offering their students breakfast as a food assistance programme as well as snacks and ‘emergency’ foods in their child-care services were more likely to be found in densely populated areas. Finally, the schools located in densely populated areas tended to offer foods and beverages of low nutritional value at special events and during cooking activities, respectively.
Secondary schools
Low income index
Socio-economic characteristics did not play a central role in the availability of foods with high nutritional value, with one exception: schools offering refined products (e.g. white bread) instead of healthier options were situated in more deprived areas. Socio-economic characteristics were, however, associated with the establishment of a policy as well as an organizational environment favourable for a healthy diet; high level of deprivation was associated with these structural characteristics. Indeed, the schools less likely to have a regular food committee, to seek student input on menu choices and to have longer lunch periods were situated in disadvantaged areas. Menu prices were significantly lower in more disadvantaged areas. Finally, schools in disadvantaged areas were less likely to have student volunteers in their food services.
School size
In schools with a larger student population, the vending machines located near lunch areas were less likely to have contents meeting criteria for healthy foods. Larger schools tended to have their menus designed by a registered dietitian and to opt for cyclic menus running for four or more weeks. Schools with a larger student body were less likely to have drinking fountains or sinks in or near their lunch areas. Schools with a larger student population were more likely to give students tickets for buying lunch at school and to offer a variety of food assistance programmes.
Population density
Schools located in more densely populated areas had less drinking fountains or sinks in or near their lunch areas. Additionally, schools in more densely populated areas had fewer diners (food outlets) in the vicinity.
Discussion
The objective of the present study was to examine whether the school food environment was associated to LICO, school size and the population density. Bivariate analysis revealed that, in both the primary and secondary schools, the role of socio-economic and demographic characteristics varied as a function of the school food environment. In this respect, our results reveal that the schools in deprived areas provide an environment less favourable for a healthy diet.
With respect to the availability of foods with high nutritional value, we found very few primary schools with favourable food offerings (5·1 %); this was the case in 42·2 % of secondary schools. Meals served in schools did not always correspond to the recommended nutritional intakes( Reference Taylor, Hernandez and Caiger 27 , Reference Crepinsek, Gordon and McKinney 28 ); certain meals contained high amounts of fat, sugar or salt. By extension, studies have shown that young people eating school meals( Reference Turner and Chaloupka 29 ) had inadequate intakes of fruit, vegetables and whole grains. Our findings are consistent with research suggesting that food and beverage companies have made only moderate progress in supporting schools in their efforts to improve the quality of food offerings, highlighting the importance of promoting food policies( Reference Story, Nanney and Schwartz 30 – Reference Pica, Traoré and Bernèche 32 ).
Our study reveals that primary schools in deprived areas had a greater probability of being surrounded by fast-food restaurants and businesses such as dairy bars. Many studies corroborate these results( Reference Davis and Carpenter 13 , Reference Simon, Kwan and Angelescu 15 , Reference Cummins, McKay and MacIntyre 33 – Reference Seliske, Pickett and Boyce 35 ). The presence of food outlets enhancing accessibility of foods with low nutritional value to children( Reference Austin, Melly and Sanchez 36 ) can be offset with dining areas that appeal to students and entice them to stay at school for lunch( Reference Beaulieu and Godin 37 ). Concomitantly, working with restaurants to improve the nutritional value of their meals may be a promising strategy( Reference Sugarman and Sandman 38 ).
Large primary schools provided access to food services as well as to tasting and cooking activities through child-care services. The larger secondary schools were more likely to have menus designed by a registered dietitian, a cyclic menu of 4 weeks or longer( 7 ) and a broad variety of food assistance programmes. School budgets are associated with the number of pupils. As a result, larger schools have more financial latitude, enabling them to hire specialized staff. Moreover, the food services in Quebec’s larger secondary schools are often managed by corporations staffed with registered dietitians who plan and revise school menus.
The presence of foods or beverages of low nutritional value during special events (73·0 %) depended on the population density; primary schools located in high-density areas were more likely to offer foods and beverages of low nutritional quality during special events than schools located in areas with lower population density. Similar to the findings of others( Reference Isoldi and Dalton 39 ), the majority of food items offered during class celebrations were energy-dense and of low nutrient value.
Study results also show that primary schools in disadvantaged areas were less likely to have lunchtime meal food services. This is unfortunate as school food services have been shown to offer lunches of superior nutritional quality than lunches packed at home( Reference Taylor, Hernandez and Caiger 27 ). Moreover, a study accompanied with intervention programmes showed that children living in deprived areas may have a higher prevalence of obesity( Reference Li and Hooker 40 ) and suggested that schools with food services may be particularly helpful for students from low-income families. Beyond the potential association with the size of the school, schools with a high proportion of low-income families likely have less available income for their children to purchase meals at schools. Needless to say, this provides a low business incentive for caterers to invest in such schools. Implementing free or low-cost meals in deprived areas could help achieve the recommended nutritional intakes.
Similar to others, our results reveal that foods of low nutritional value were more pervasive in secondary than in primary schools( Reference Finkelstein, Hill and Whitaker 41 ) regardless of socio-economic status. Our results also indicate that vending machines in bigger schools offered fewer foods with good nutritional value. This finding is troubling given than ‘the availability of low-nutrient, energy-dense foods in vending machines in or near the foodservice area has been found to be associated with a higher BMI z score’( Reference Fox, Dodd and Wilson 42 ). We would therefore suggest paying particular attention to food quality in large schools in Quebec.
In secondary schools, a high level of disadvantage was negatively associated with the establishment of a policy and organizational environment favourable for a healthy diet. Indeed, such schools were less likely to have a regular food committee, to seek student input on menu choices or to have a long lunch period. Implementation of these strategies in secondary schools may be a low-cost approach to creating environments favourable for a healthy diet. Such interventions are already established in the UK by the Food for Life Partnership, an initiative that adopts a holistic approach to planning a favourable school food environment( Reference Kimberlee, Jones and Morley 43 , Reference Jones, Dailami and Weitkamp 44 ). This approach includes all members of the school community, especially students, in school planning and implementing change through a School Nutrition Action Group( Reference Passmore and Harris 45 , Reference Orme, Jones and Salmon 46 ).
Study limitations and strengths
Given the low variability in the data for many variables, regression models including multiple socio-economic and demographic variables were not performed. Moreover, the small sample size could have limited the occurrence of significant relationships as the result of a lack of statistical power. Serving sizes were not available for all foods, which limits the accuracy of our interpretations about the food-offering quality. Lastly, while measures distinguishing urban from rural settings have been widely used in the literature, we opted for population density since it takes into account both a region’s area and number of inhabitants. Despite these limitations, the present study stands as the first of its kind in Quebec. These results can be generalized to all Quebec French-language schools, with the exception of those situated in remote northern regions and on the island of Montreal. Remote schools are distinct with food offerings that differ from the rest of Quebec. Montreal Island’s largest of five school boards declined to participate in the study. Our study offers an exhaustive observation of the access to foods of high nutritional value along with rich details describing the organizational and structural school factors associated with this food environment. In so doing, the study has yielded information that is essential in developing hypotheses appropriate for the Quebec context and in carrying out more targeted studies in the future.
Conclusions
In Quebec the ecological approach to health promotion has been successfully disseminated, whereby schools are beginning to implement strategies to create food environments that favour healthy choices and discourage unhealthy choices. The promotion of the Quebec food policy likely provided the framework needed for schools to implement strategies to improve food availability and food environments in schools, particularly with respect to junk food. Advancement now requires interventions to consider a number of particular school characteristics: deprived primary schools need support, particularly in implementing meal services; and school wellness committees with student participation is a low-cost technique to improve the food environment in secondary schools. Broader studies on these various characteristics or using other indicators could help level the health inequalities associated with the diets of young people.
Acknowledgements
Acknowledgements: The authors would like to thank the school principals, food-service managers and child-care managers for their time and involvement in the interviews. Special thanks go to the study co-investigators and collaborators. Financial support: This study was funded by Quebec’s government and the Centre de Recherche en Prévention de l’Obésité. The funders had no role in the design, analysis or writing of this article. Conflict of interest: None. Authorship: P.M and E.R. designed and conducted the research; K.D. analysed the data; P.M. and K.D. wrote the paper; A.L. and S.B. contributed to the analyses; P.M. had primary responsibility for the final content. All authors read and approved the final manuscript. Ethics of human subject participation: The study was conducted according to the guidelines laid down in the Declaration of Helsinki and all procedures involving human subjects were approved by the research ethics committee of the Estrie Health and Social Services Centres (CER # 08-005).
Appendix
Beverages and foods favourable or unfavourable for a healthy diet provided in vending machines and at the child-care service Footnote *