


In 2018 in the USA, 11 % of all households experienced food insecurity, defined as insufficient access to safe and adequate food(Reference Coleman-Jensen, Rabbitt and Gregory1). The largest US federal food programme, the Supplemental Nutrition Assistance Program, provided $55·6 billion in Fiscal Year 2019(2) to low-income people to purchase food; however, many Americans continue to have unmet food needs because they do not qualify for Supplemental Nutrition Assistance Program or the benefits are inadequate. The US food banking system (also known as the emergency food system or charitable food system) is a network of food banks (i.e. regional organisations that source and warehouse food) that distribute food through community agencies (i.e. smaller, local organisations that order food from food banks and receive donated food from other sources). These community agencies provide food directly to individuals and families. Most community agencies are food pantries (also known as food shelves), where people can visit to obtain groceries at no cost. Other community agencies are congregate meal sites (also known as soup kitchens), where people can eat a prepared meal. Most community agencies are located in faith-based settings, community centres or schools. In the USA, approximately 200 food banks belong to the national organisation, Feeding America, and together they provide food to over 40 million people a year through 49 000 food pantries(3,Reference Weinfield, Mills and Borger4) .
Historically, the primary measure of success in the food banking system was to maximise reach and ensure adequate energies, and this was tracked by counting the total number of pounds of food distributed. However, research has emerged documenting that food-insecure individuals are at high risk of poor diet and diet-related illnesses (e.g. type II diabetes, hypertension and heart disease) and struggle more with diabetes self-management(Reference Seligman, Laraia and Kushel5–Reference Seligman, Davis and Schillinger7). A 2014 national study of food pantry clients found that over half (58 %) reported having a household member with high blood pressure and one-third reported having a household member with diabetes(Reference Weinfield, Mills and Borger4).
Attention to the importance of connecting nutrition and food banking has gained momentum over the past decade in the USA(Reference Campbell, Webb and Ross8–Reference Handforth, Hennink and Schwartz10). Feeding America has incorporated nutrition into much of its research and resources(11), and the non-profit, Partnership for a Healthier America, has led the Healthy Hunger Relief initiative to increase the supply of healthier options and remove the least healthy options from the food banking system(12). However, there are diverse perspectives on the risks and benefits of restricting specific foods in food banks(Reference Feldman and Schwartz9,Reference Handforth, Hennink and Schwartz10) . In a 2015 Institute of Medicine discussion paper, Campbell and colleagues describe how some food banks have formal nutrition policies that prohibit the distribution of products like soda and candy, while other food bankers believe that all foods should be available to allow clients to make their own choices(Reference Campbell, Webb and Ross8). A 2018 national survey of US food banks (n 196) by the non-profit MAZON found that 57 % have informal nutrition guidelines, 19 % have a formal nutrition policy without a ban and 14 % have a policy with a ban(Reference Feldman and Schwartz9). Encouragingly, more than half already employ a system to track the nutritional quality of their inventory(Reference Feldman and Schwartz9). This provides an opportunity: quantitatively ranking and communicating the nutritional quality of food as it travels through the network has the potential to facilitate a system-wide shift towards more nutritious inventory without requiring a ban on particular foods.
There is evidence that providing clear nutrition information at the point of decision making can shift consumer behaviours in the desired direction(Reference Shangguan, Afshin and Shulkin13). For example, when traffic light nutritional labelling was provided in a cafeteria setting, there were decreased sales of red items and increased sales of green items over a 2-year intervention(Reference Thorndike, Riis and Sonnenberg14). Similarly, a rating system in a hospital setting that categorised beverages into red, yellow or green based on sugar content showed decreased sales of red beverages and increased sales of green beverages over 1 year(Reference Hartigan, Patton-Ku and Fidler15). This strategy has potential in the charitable food system as well: in a survey of food pantry clients, they report supporting interventions that will make it easier for them to identify nutritious foods(Reference Cooksey Stowers, Martin and Schwartz16), and there is emerging research that traffic light nutritional labelling in a food pantry increases client selection of green foods and decreases selection of red foods (S McKee, EA Gurganus, et al, unpublished data).
Nutrition labelling may also be useful at the food bank level, where it can influence the choices made by food pantry staff about which foods to order. Over 70 % of Feeding America food banks provide an online ordering platform to their community agency partners(17). The challenge is that foods are often listed in broad categories, and shoppers are not able to see nutrition facts labels. If pantry staff are able to see a nutrition rank and make healthier choices when shopping at the food bank, the overall nutrition environment of food pantries may improve.
The current study evaluates a natural experiment that occurred when a food bank began sharing product scores from a three-tier nutrition ranking system with the food pantry staff ordering from their online platform. We hypothesised that after food pantry ordering staff could see the nutrition rank, they would increase their orders of the healthiest category of foods and decrease their orders from the least healthy category of foods. We also assessed shifts in overall inventory available and changes in the specific types of food ordered.
Methods
Setting and intervention
A New England food bank, Foodshare, began ranking its inventory in January 2018. They employed the Supporting Wellness at Pantries (SWAP) criteria, a set of nutrition standards that rank foods as ‘green,’ ‘yellow’ or ‘red’ based on food type and amount of saturated fat, Na and sugar per serving(Reference Martin, Wolff and Callahan18). Initially, the SWAP ranking was utilised internally to better understand the nutritional profile of the food bank inventory. However, once a large proportion of their past (back to January 2017) and current products had been ranked, food bank leadership decided to share this information with its member food pantries. To achieve this, they asked their inventory and online shopping software company, Primarius(19), to add a new column to the online ordering platform labelled ‘Nutrition Description.’ The software company made this change at no charge, and this column was populated with each food’s SWAP score in April 2018. Figure 1 illustrates a screenshot of the shopping platform.
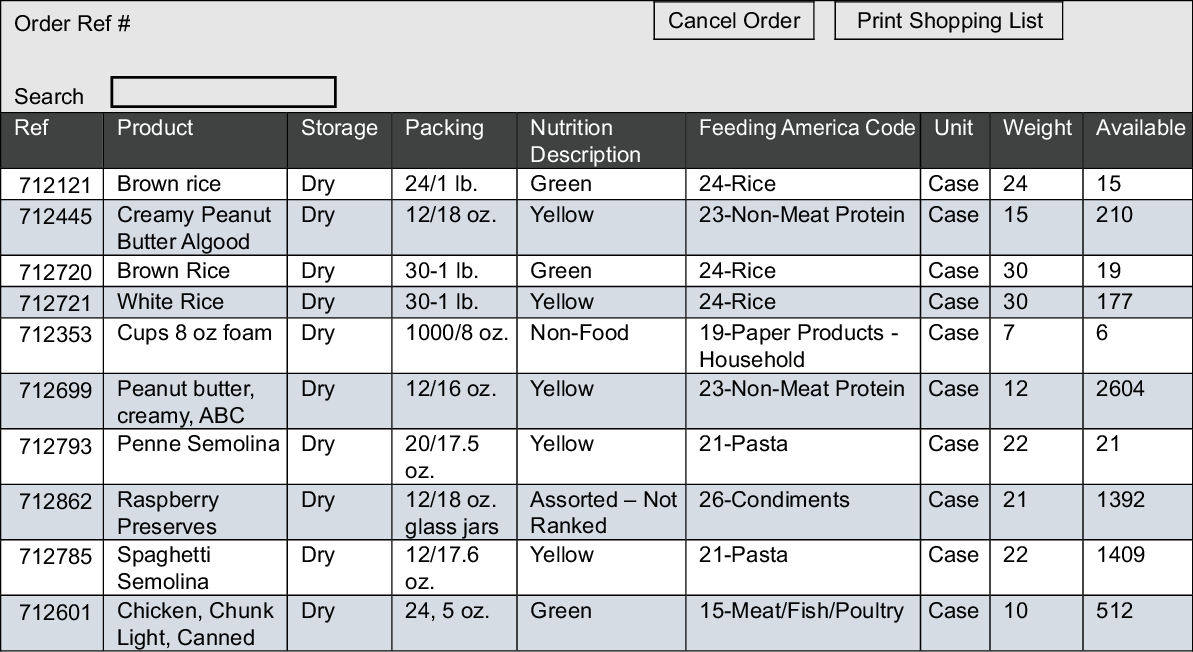
Fig. 1 Illustration of the online ordering platform including the new ‘nutrition description’ column
Participants and data structure
The sample includes the twenty-five agencies that order the largest amount of food annually, as measured in pounds. They are located in Hartford (n 22) and Tolland counties (n 3) in Connecticut. We obtained all 63 922 itemised food ordering records from these pantries for the timeframe of January 2017 to May 2019. While there are no fixed limits regarding the number of time points for the analysis, statistical power generally increases with the number of time points or when the time lengths are equally distributed before and after the intervention(Reference Zhang, Wagner and Ross-Degnan20). Data from January 2017 to May 2019 were available at the time of the analyses. To maximise our statistical power, we included all of the available data. As a result, the 15-month baseline period (i.e. without visible SWAP ranks) was from January 2017 to March 2018, and the 14-month intervention period (i.e. when the SWAP ranks were visible) was from April 2018 to May 2019. Each order record includes the food category (e.g. dairy, protein, fruit and vegetables); nutrition category (e.g. green, yellow and red); weight in pounds; order date and source of the order (e.g. The Emergency Food Assistance Program [commodity food provided by the federal government], donation, salvage). Of note, the nutrition category could include two other possible values. First, ‘assorted-not ranked’ was used for items from mixed loads that may be within a category (such as ‘mixed dairy’ or ‘mixed frozen meat’) but are not sorted or labelled with enough specificity to determine a nutrition rank. Second, ‘non-food’ was used for items such as paper goods, pet food and other non-edible products carried by food banks.
Analytic plan
Our primary research question asked whether the visibility of the SWAP rank (the intervention) was associated with an increase in orders of green food and a reduction in orders of red food. First, t tests were used to assess changes in overall food bank inventory available by nutrition rank before and after the intervention. Second, we constructed pantry-month-level panel data and utilised an interrupted time series (ITS) analysis to identify whether food ordering behaviour after the intervention deviated from pre-existing trends. In an ITS analysis, a time series of interest is ‘interrupted’ by an intervention at a known point in time. The effect of the intervention is estimated by comparing the post intervention time series with the hypothetical scenario where the pre-intervention trend continues as if the intervention had not taken place (i.e. counterfactual). The comparison between the counterfactual scenario and the actual post-intervention time series thus provides the basis for the evaluation of the impact of the intervention(Reference Shadish, Cook and Campbell21). The unit of our analysis was pounds per month, per pantry, per nutritional category and the primary outcome of interest was the monthly weight of food ordered in each nutritional category by each pantry. Specifically, we followed the common guideline of ITS design(Reference Bernal, Cummins and Gasparrini22) and estimated the following model:
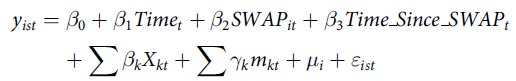 $${y_{ist}} = {\beta _0} + {\beta _1}Tim{e_t} + {\beta _2}SWA{P_{it}} + {\beta _3}Time\_Since\_SWA{P_t} + \sum {\beta _k}{X_{kt}} + \sum {\gamma _k}{m_{kt}} + {\mu _i} + {\varepsilon _{ist}}$$
The dependent variable y
ist
indicates the weight of food ordered by pantry i in nutrition category s at month t. Time
t
is a continuous variable indicating the time (year-month) of the food order,
 $SWA{P_{it}}$
is a dummy variable indicating whether the SWAP system has been implemented, 1 yes and 0 otherwise.
$SWA{P_{it}}$
is a dummy variable indicating whether the SWAP system has been implemented, 1 yes and 0 otherwise.
 $Time\_Since\_SWA{P_t}$
is a continuous variable indicating the time since the implementation of SWAP (April 2018).
$Time\_Since\_SWA{P_t}$
is a continuous variable indicating the time since the implementation of SWAP (April 2018).
 ${\beta _2}$
is then interpreted as the immediate impact attributable to the implementation of the SWAP system, while
${\beta _2}$
is then interpreted as the immediate impact attributable to the implementation of the SWAP system, while
 ${\beta _1}$
describes the pre-intervention time trend and
${\beta _1}$
describes the pre-intervention time trend and
 ${\beta _3}$
describes the change in time trends post-intervention. Other control variables were included to disentangle the effect of SWAP from other possible confounding variables and to avoid the common pitfalls that are known to affect the validity of ITS analysis(Reference Martin, Wolff and Callahan18). Specifically,
${\beta _3}$
describes the change in time trends post-intervention. Other control variables were included to disentangle the effect of SWAP from other possible confounding variables and to avoid the common pitfalls that are known to affect the validity of ITS analysis(Reference Martin, Wolff and Callahan18). Specifically,
 ${X_{kt}}$
represent other time-varying covariates that are likely to drive the observed changes in food ordered. To control for the degree to which any changes in food ordered by pantries were driven by changes in the Foodshare inventory available, we included weights of green, yellow, red, assorted-not ranked food and non-food available in the Foodshare inventory each month. This allowed us to disentangle the changes in the Foodshare inventory from the changes that can be attributed to SWAP. To exclude the possibility that the observed changes are driven by changes in food sources and pantry capacity, we also included monthly weight of food ordered from each major source (i.e. The Emergency Food Assistance Program, salvage and donation) by each pantry and monthly total weight of food ordered by each pantry. To control for the seasonality effect,
${X_{kt}}$
represent other time-varying covariates that are likely to drive the observed changes in food ordered. To control for the degree to which any changes in food ordered by pantries were driven by changes in the Foodshare inventory available, we included weights of green, yellow, red, assorted-not ranked food and non-food available in the Foodshare inventory each month. This allowed us to disentangle the changes in the Foodshare inventory from the changes that can be attributed to SWAP. To exclude the possibility that the observed changes are driven by changes in food sources and pantry capacity, we also included monthly weight of food ordered from each major source (i.e. The Emergency Food Assistance Program, salvage and donation) by each pantry and monthly total weight of food ordered by each pantry. To control for the seasonality effect,
 ${m_{kt}}$
is included as a series of dummy variables to represent each month of the year, and
${m_{kt}}$
is included as a series of dummy variables to represent each month of the year, and
 ${\mu _i}$
represents the pantry level fixed effects such that the comparison is within each pantry. To test how SWAP impacts the ordering of green, yellow and red food differently, we estimated separated ITS models for each nutritional category with robust clustered standard errors. Third, we examined the largest shifts in pounds ordered by food type to identify the specific food items pantries were selecting more or less of over time.
${\mu _i}$
represents the pantry level fixed effects such that the comparison is within each pantry. To test how SWAP impacts the ordering of green, yellow and red food differently, we estimated separated ITS models for each nutritional category with robust clustered standard errors. Third, we examined the largest shifts in pounds ordered by food type to identify the specific food items pantries were selecting more or less of over time.
Results
On average, each pantry ordered 7132 pounds of green food, 3190 pounds of yellow food and 1334 pounds of red food each month. The average percent of total food ordered and accounted for by a single pantry was 4 %, with the smallest pantry accounting for ~1·5 % and the largest pantry accounting for ~9·3 %. The proportion from each of the food sources was The Emergency Food Assistance Program (32 %), Donations (20 %), Salvage (9 %) and Other (39 %).
Table 1 presents the means and SD of monthly pantry orders before and after the intervention in pounds, and total pounds of food ordered before and after the intervention in percentages. The average monthly order by each pantry for green food increased by ~1000 pounds after the SWAP ranking was displayed, while orders of red and yellow foods decreased after the intervention by ~900 pounds and ~500 pounds, respectively. Expressed as percentages of the total weight of food ordered across all pantries, pounds of green food increased by 6 percentage points and pounds of red food dropped over 5 percentage points.
Table 1 Descriptive statistics: food ordered by each of the twenty-five food pantries before and after nutrition rankings were visible
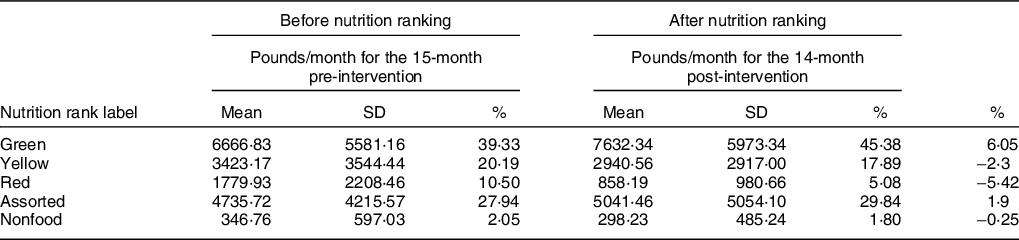
See reference 18 for definitions of ‘Green,’ ‘Yellow’ and ‘Red’ foods. ‘Assorted’ foods are similar items that comes in a mixed box, such as assorted dairy products. ‘Non-food’ products are typically household items such as toilet paper and paper towels.
t tests were used to assess overall changes in the food bank inventory available before and after the intervention. The average monthly pounds green inventory available before (M = 1 261 403 lbs., sd = 157 437) and after (M = 1 324 116 lbs., sd = 130 016) the intervention were not significantly different, t(27) = 1·16, P = 0·25. Similarly, there was not a significant change in the average monthly pounds of yellow inventory available before (M = 416 948 lbs., sd = 27 755) and after (M = 483 156 lbs., sd = 23 572) the intervention, t(27) = –1·81, P = 0·08. However, the average monthly pounds of red inventory available did decrease significantly from the pre-intervention (M = 241 629, sd = 111 172) to the post-intervention period (M = 122 672 lbs., sd = 32 602), t(27) = 3·85, P < 0·001). To control for this, the average availability of inventory for each nutrition rank each month was included in the ITS model.
Table 2 presents ITS results estimating the impact of the intervention on food ordering from each nutrition category. The results indicate that post-intervention, each pantry ordered significantly more pounds of green food per month (average of 1286 lbs.; P < 0·001). Each pantry also ordered significantly fewer pounds of yellow food per month post-intervention (average of 697 lbs.; P = 0·001). While there was a significant upward trend in the average monthly weight of yellow food ordered by each pantry pre-intervention (96 lbs. increase per month, P < 0·001), the trend became downward during the post-intervention time period (97·4 lbs. decrease per month, P = 0·002). Finally, after the intervention, pantries ordered significantly fewer pounds of red food each month (average of 631·2 lbs., P = 0·045). The intervention was not expected to significantly shift orders of ‘assorted food’ or ‘non-food items’ because they do not have nutrition ranks. Results indicated that during the pre-intervention phase, there was a downward trend in the average monthly weight of assorted food ordered by each pantry (139·7 lbs. decrease per month, P = 0·005); however, the average weight of orders of ‘assorted food’ and ‘non-food’ items did not change post-intervention.
Table 2 Results from interrupted time-series (ITS) analysis with time-varying covariates
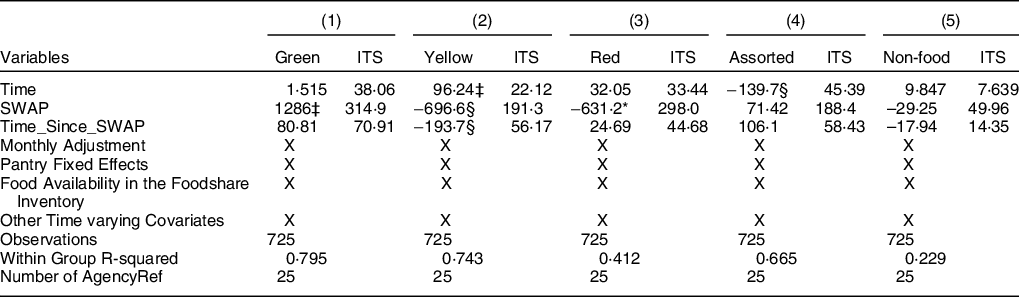
* P < 0·05.
§ P < 0·01.
‡ P < 0·001.
Time is a continuous variable indicating the time (year-month) of the food order. SWAP is a dummy variable indicating whether the SWAP system has been implemented (1 = yes and 0 = no). Time_Since_SWAP is a continuous variable indicating the time since the implementation of SWAP (April 2018). Monthly adjustment includes eleven dummy variables to represent each month (with one left out). Food Availability in the Foodshare Inventory include variables representing monthly weights of green, yellow, red, assorted-not ranked food and non-food available in the inventory. Other time-varying covariates include monthly total food ordered; monthly food ordered from TEFAP; monthly food ordered from Donation and monthly food from Salvage.
Figure 2 depicts the pattern of ordering by nutrition category over time, smoothed with the 3 month moving average for ease of interpretation. Here it is notable that the amount of red food ordered began declining even before the intervention. This is consistent with the earlier finding that the availability of red foods in the overall inventory decreased over time. Notably, the pre-intervention decrease in red food orders was no longer evident when the overall red food inventory was controlled in ITS analysis. However, the modest, statistically significant post-intervention decrease in average red food orders remained. This indicates that the decrease in red food orders pre-intervention was largely driven by the decrease of overall red food inventory available, while the immediate, moderate decrease observed post-intervention was not.
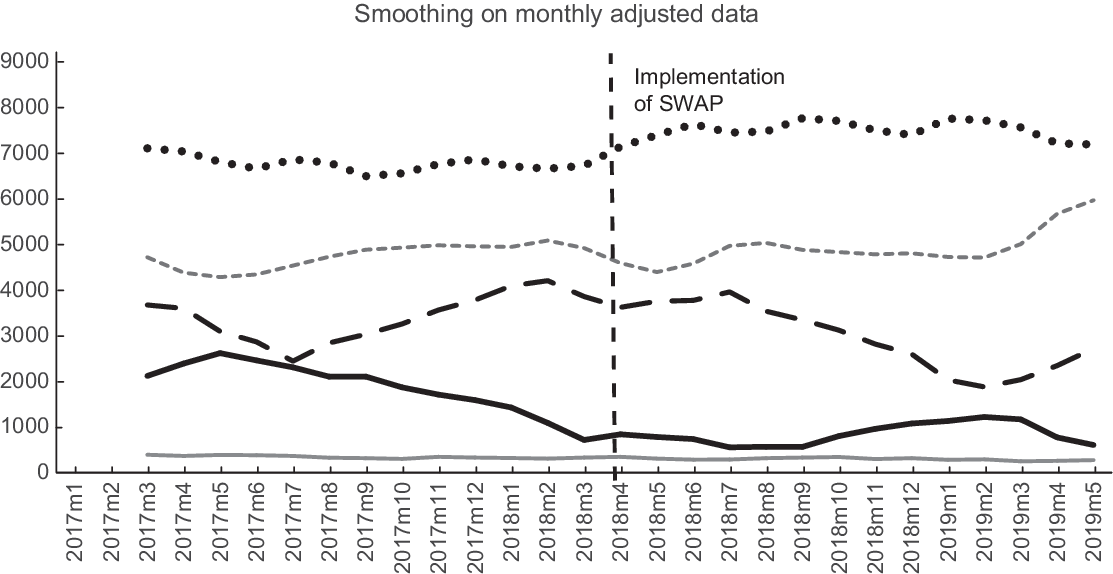
Fig. 2 Average adjusted monthly orders by food pantries over time by nutrition category, smoothed using a 3-month moving average. ![]() , 3 per. Mov. Avg. (NonFood);
, 3 per. Mov. Avg. (NonFood); ![]() , 3 per. Mov. Avg. (Assorted-Not Ranked);
, 3 per. Mov. Avg. (Assorted-Not Ranked); ![]() , 3 per. Mov. Avg. (Red);
, 3 per. Mov. Avg. (Red); ![]() , 3 per. Mov. Avg. (Yellow);
, 3 per. Mov. Avg. (Yellow); ![]() , 3 per. Mov. Avg. (Green)
, 3 per. Mov. Avg. (Green)
In order to identify the largest shifts in food selections, the total pounds for orders were organised by food type and nutrition rank, pre and post-intervention. Table 3 presents all of the food types that shifted by more than 30 000 pounds from the 15-month baseline period to the 14-month intervention period. The footnotes in Table 3 explain the specific nutrition thresholds for each rank within a food group according to the SWAP system(Reference Hartigan, Patton-Ku and Fidler15). The largest changes observed in the green category were increases in fresh produce, rice, meat, fish and poultry and dairy products. Examples of common products ranked green in these food categories are brown rice, low-fat meats and low or non-fat dairy products. The largest changes observed in the yellow category were an increase in orders for meat, fish and poultry and decreases in orders for juice, rice, pasta and canned/frozen fruit. Examples of common products ranked yellow in these food categories are white rice and pasta, 100 % juice and canned/frozen fruit packed in light syrup. The largest changes in the red category were decreases in juice, dairy, meat/fish/poultry, cereal and canned/frozen fruit. Examples of common products ranked red in these food categories are juice drinks with added sugar, meats with high levels of saturated fat, sugary cereals and canned/frozen fruit packed in heavy syrup.
Table 3 Large changes (> 30 000 lbs.) from pre to post intervention in total pounds ordered by nutrition rank and food type
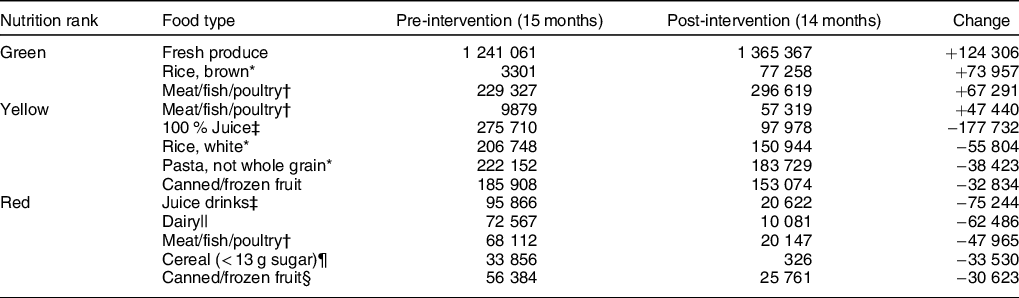
* Rice and pasta must have a whole grain as the first ingredient to rank green; most other rice and pasta products are ranked Yellow.
† Meat/fish/poultry rankings are usually determined by saturated fat levels. The thresholds are <= 2 g for green; <= 5 for Yellow and >= 5·5 for Red.
‡ 100 % juice is ranked yellow; if there is added sugar it is ranked Red.
§ Canned or frozen fruit rankings are usually determined by sugar levels. The thresholds are <= 12 g for green; 13–22 g for Yellow and > 23 for Red.
|| Dairy is ranked Red if it has any of the following: > 3·5 g of saturated fat, > 200 mg Na or > 23 g of sugar.
¶ Cereal is ranked Red if it has any of the following: > 2·5 g of saturated fat, > 401 mg Na or > 13 g of sugar.
Discussion
The findings from this natural experiment support the hypothesis that individuals who order food for pantries are influenced by visible nutrition ranking information. The significant increase in orders for green foods accompanied by a significant decrease in orders for red foods appeared to be driven by shifts between similar types of foods within larger food categories. For example, a large increase in orders for fresh produce occurred as orders for canned and frozen fruit packed in syrup went down. Similarly, new orders of brown rice appeared to replace previous orders of white rice. Another shift was that orders of lower fat animal proteins and dairy products increased while orders of higher fat versions of these foods decreased. Finally, after the nutrition rank was visible, there were decreases in orders of products that may have seemed healthy when the nutrition facts label was unavailable, specifically, fruit drinks and cereals with added sugars. These products often use marketing strategies to appear healthy despite containing a significant amount of added sugar(Reference Pomeranz and Harris23,Reference Harris, Thompson and Schwartz24) .
It is important to note that while there was a weak but significant decrease in the orders of red foods after the intervention, even when controlling for the decrease in red foods available, this shift began during the period before the intervention. Some inventory fluctuation is inevitable because food banks rely on donations; however, the decrease in red inventory in 2017 suggests that as Foodshare staff began using SWAP, they may have taken other actions to decrease donations of red foods. Concurrent with the current study, the Foodshare Board of Directors approved a Nutrition Policy to promote the collection and distribution of healthy food, and to reduce the distribution of nutritionally poor foods, such as ice cream and sugary drinks. Future qualitative research would be useful to understand how ranking nutrition may help the food bank communicate with food donors about their desire for more green and yellow foods and fewer red foods. In addition, the pattern for yellow food orders showed increasing orders pre-intervention, followed by decreasing orders after the nutrition labels were visible. This downward trajectory of yellow food ordering continued over time, suggesting that pantry staff were shifting away from products that were ranked yellow. It is possible that food pantries initially replaced red food items with yellow food items pre-intervention, but then switched to even healthier choices (e.g. green food) post intervention. Again, future research can explore the experience of pantry shoppers when they first see the nutrition labels and how they respond to shifts in the inventory available over time.
These findings suggest that there is potential to increase the nutritional quality of food provided through the national food banking system in the USA, which in 2019 provided four billion meals worth of food(25). However, it is important to recognise that there are concerns about the current structure of the food bank system. Critics note that US food bank leaders rely on powerful members of the food industry for funding and food, and thus fail to hold these corporations accountable for their treatment of workers(Reference Fisher26). Relatedly, some argue that corporate-based food banking allows governments to ignore food insecurity and avoid their obligation to ensure food for their citizens(Reference Riches27). An alternative view, however, is that food banks and food pantries have untapped potential to go beyond distributing food; they should also serve as community hubs that provide a range of services and support to enable families to overcome the root causes of hunger(Reference Schwartz and Seligman28). This is the mission of the Community Food Centres Canada(29), and the More Than Food framework – a strength-based, holistic person-centred programme that uses the SWAP system from the current study as well as case management and motivational interviewing to connect clients with resources(Reference Sanderson, Martin and Colantonio30). The More Than Food approach has been found to significantly increase clients’ food security, self-sufficiency, diet quality and social support(Reference Sanderson, Martin and Colantonio30).
The current study has several limitations. First, this intervention took place in only one US food bank, so this type of intervention requires replication in the USA and may not be appropriate or replicable in food banks in other countries. Second, as a natural experiment, there was not a control group that did not see the nutrition ranking information. It is possible that other changes in the system were occurring at the same time, so the possibility that the shift in ordering was also driven by other factors cannot be ruled out entirely. However, the fact that there was not a change in the purchasing of non-food items over time (which did not have a ranking), and the robustness of our results while controlling for changes in food bank inventory suggests that the overall changes in resources of the food bank or pantries were not driving our results. Nevertheless, future research could randomly assign pantry directors to versions of the ordering system with and without visible nutrition ranks in order to better isolate the effect of providing visible nutrition ranking information. Another area for future research is calculating the cost of each component of this intervention. Ranking foods requires staff expertise and time, and entering the data into the inventory software also requires staff time, so these costs can be estimated. Food pantries also pay a nominal ‘maintenance fee’ of approximately $.19/pound at this food bank that is unrelated to nutrition rank, with the exception that fresh produce has no maintenance fee. In the current study, pantry costs were not evaluated because no changes were expected; however, if other food banks operate differently, the financial impact of the intervention on food pantries should also be considered. Finally, this intervention on its own may not lead to substantially improved diets among pantry clients. Future research is needed to examine how clients respond when healthier food is available in the food pantries they frequent, and whether more nutritious food obtained at a pantry is likely to have a measurable impact on diet quality.
Despite these limitations, there is reason to be optimistic about the future of nutrition-focused food banking. In 2020, a national panel organised by the Robert Wood Johnson Foundation’s Healthy Eating Research Program released a set of nutrition guidelines specifically designed for use in food banks(Reference Schwartz, Levi and Lott31). Feeding America has recognised these standards(32), and the SWAP system is currently being updated to match them. Food banks that use the new nutrition guidelines should not only rank the nutritional quality of the food in their inventory but should also make the nutrition rankings available to their network of food pantries when they order food. Further, they should use nutrition rankings to evaluate each of their industry and retail donors and consider having conversations with donors about how to maximise the nutritional quality of the foods that enter the food banking system. As more food banks include nutrition ranking as part of their operations, there will be opportunities to assess interventions like the current one, as well as other upstream and downstream interventions designed to improve clients’ diets and health. The findings from this study are one component of a larger vision of using policy, systems and environment changes to improve the nutritional quality of the food available to and consumed by food-insecure individuals.
Acknowledgements
Financial support: This study was supported by a grant from Feeding America. Feeding America had no role in the design, analysis or writing of this article. Conflict of interest: None. Authorship: K.M.: implemented intervention, provided data and contributed to manuscript. R.X.: designed and conducted analyses and contributed to manuscript. M.S.: formulated the research question, designed the study and led the writing of the manuscript. Ethics of human subject participation: No human participants were involved in this study.


