


The 2013 Global Burden of Disease Study highlighted a diet low in fruits as the most important dietary contributor to mortality and lost years of healthy life, and a diet low in vegetables as the fourth contributor( Reference Forouzanfar, Alexander and Anderson 1 ). These results are critical because consumption of fruits and vegetables (F&V) worldwide remains below the recommended levels( 2 ).
It is challenging to consume a healthy diet in our current obesogenic environment. A set of behavioural characteristics, including self-efficacy, decisional balance and motivation, are key points to allow individuals to make changes in their eating behaviour and make adequate food choices( Reference Shaikh, Yaroch and Nebeling 3 , Reference Fish, Brown and Quandt 4 ). Although psychosocial processes are often theoretically hypothesised to play a role in dietary intake, their examination is much less common( Reference Diez Roux and Mair 5 ). Eating is a behaviour. Understanding the determinants of behaviour is a key step for developing effective nutritional interventions. However, to make this possible, the environment also must favour healthy choices.
Whereas making individuals accountable for their own health is central to disease prevention approaches, many of which are heavily affected by the interests of the processed food industry( Reference Swinburn, Kraak and Rutter 6 ), researchers and policy makers are emphasising the need to understand food choices that result from influences at multiple levels: individual, environmental and policy( Reference Penney, Almiron-Roig and Shearer 7 – Reference Figueira, Lopes and Modena 12 ).
Despite the increased emphasis on understanding how the food environment affects eating behaviour, the results are still inconsistent and only a moderate amount of evidence is available. A gold standard for measuring local food access is not available, which makes study reproducibility difficult( Reference Caspi, Sorensen and Subramanian 9 ). Additionally, contradictory and null results may be related to important gaps and challenges presented by the scientific community and to the need for further research on this subject( Reference Penney, Almiron-Roig and Shearer 7 ). Reviews of existing studies have recommended greater methodological sophistication, such as using direct measurement of the food environment instead of business databases( Reference Diez Roux and Mair 5 , Reference Caspi, Sorensen and Subramanian 9 ). The reviews have also emphasised the need to expand the focus from specific store types (e.g. supermarkets are often assumed to be a proxy for ‘healthy’ stores even though they also sell processed foods( Reference Diez Roux and Mair 5 , Reference Larson, Story and Nelson 13 , Reference Drewnowski, Aggarwal and Hurvitz 14 )) to include a detailed characterisation of what consumers encounter within stores( Reference Diez Roux and Mair 5 , Reference Gustafson, Sharkey and Samuel-Hodge 15 , Reference Glanz, Sallis and Saelens 16 ). Additionally, studies of the food environment in low- and middle-income countries (LMIC) are just beginning to be conducted( Reference Pessoa, Mendes and Caiaffa 10 , Reference Figueira, Lopes and Modena 12 ). Most studies in these LMIC such as Brazil have explored subjective measures or the perceived environment, or they used secondary data( Reference Pessoa, Mendes and Caiaffa 10 , Reference Belon and Nykiforuk 17 , Reference Duran, Diez-Roux and Latorre 18 ).
To expand our understanding of the food environment–diet relationship, and to support evidence-based interventions and effective policies, the present study examined the associations of individual and food environmental factors (investigating the community and consumer nutrition environments) with F&V intake in an LMIC city.
Methods
Setting and study design
The current cross-sectional study was conducted in Belo Horizonte, Brazil. The city is the sixth most populous in the country and the eighth on the South American continent, with an estimated population of 2 502 557 inhabitants in 2015( 19 ).
The data were collected in the context of the Health Academy Program (HAP). The HAP was chosen as a scenario for studying the food environment because it is a key component of the Brazilian Primary Care system that aims to create healthy environments, overcome structural barriers to practise physical activity and facilitate adoption of healthy habits, especially among socially vulnerable populations. The programme offers mainly physical exercise classes, three times per week, lasting 1 h each. Sporadically, other health promotion actions are also offered, including group education activities related to nutrition which are provided by Primary Care professionals. All activities are provided at no cost to the participants( 20 ).
Study sample
The current study included a representative sample from the HAP centres. Two centres were selected via stratified cluster sampling in each of nine strata representing the nine administrative districts in the municipality. From forty-two eligible centres, a total of eighteen centres were selected, or two per administrative district. Additional details have been described elsewhere( Reference Costa, Oliveira and Lopes 11 ).
In each selected centre, all users who were aged 20 years or older and regular users of the services (e.g. regular participation in physical exercise in the preceding month) were invited to participate. Pregnant women and individuals with cognitive difficulties preventing research participation were excluded from the study. Out of 3763 individuals listed as users, 3414 individuals participated in the study (refusals, 6·3 %; exclusions, 3·0 %).
To define the food environment at HAP centres, we used their geographical position and created radial buffers of 1600 m around each centre based on the Euclidean distance, using the ArcView buffer tool (Esri, Redlands, CA, USA). Food stores that sold F&V contained within these buffer areas were visited and included in the study, as follows: (i) stores registered in geo-referenced databases of the Municipal Joint Taxation Secretariat; (ii) open-air food markets listed at the municipality City Hall site; and (iii) stores not registered in public databases but identified on-site by field staff. The stores not registered on the list provided included informal stores that had recently opened or were under construction( Reference Costa, Oliveira and Lopes 11 ).
From 360 eligible establishments, 17·3 % refused to allow data collection. We worked with 336 of the establishments, because thirty-eight belonged to territories of two different HAP centres and these were allocated in both areas.
To analyse the association between individual F&V intake and food environment variables, we created a 500 m radial buffer around each individual’s residence to assess characteristics of food stores in his/her residence area. This distance was used because it was considered to represent easy access( Reference Furey, Strugnell and McIlveen 21 ) and has been used in several studies on the food environment( Reference Clarke, Eyre and Guy 22 , Reference Smoyer-Tomic, Spence and Raine 23 ). We used spatial analysis techniques to identify individuals who had a 500 m buffer that fell within the 1600 m buffer zone around each HAP centre within which food environment data were collected. The percentage of a buffer that fell within the HAP study area was calculated. For any participants who had more than 50 % of their buffer within the study area, their data were considered to be available (2944 individuals); the others were excluded from the analysis (n 470). These excluded individuals had similar sociodemographic characteristics compared with participants.
Conceptual model
The proposed ecological framework was built for the current study from previously proposed models( Reference Diez Roux and Mair 5 , Reference Glanz, Sallis and Saelens 16 , Reference Green and Glanz 24 ) and aimed to present a model of how individual and food environmental factors may affect F&V intake. Thus, the framework represents the multiple levels of influence on F&V intake: (i) food environment variables, including community and consumer nutrition environments. The community environment is the level where food store distribution can be identified, based on variables such as location and type. The consumer environment refers to what individuals encounter within and around a food store, with relevant characteristics including availability, quality and food price( Reference Glanz, Sallis and Saelens 16 ); and (ii) individual variables, including sociodemographic characteristics and behavioural factors (Fig. 1). The different types of nutrition environment explored in the present study are affected by a macro-level environment, involving agriculture, industry and government policies, as well food production, distribution and marketing. Although not explored in the present analysis, the macro-level environment is a distal influence that is powerful and recognised in the study’s theoretical model.
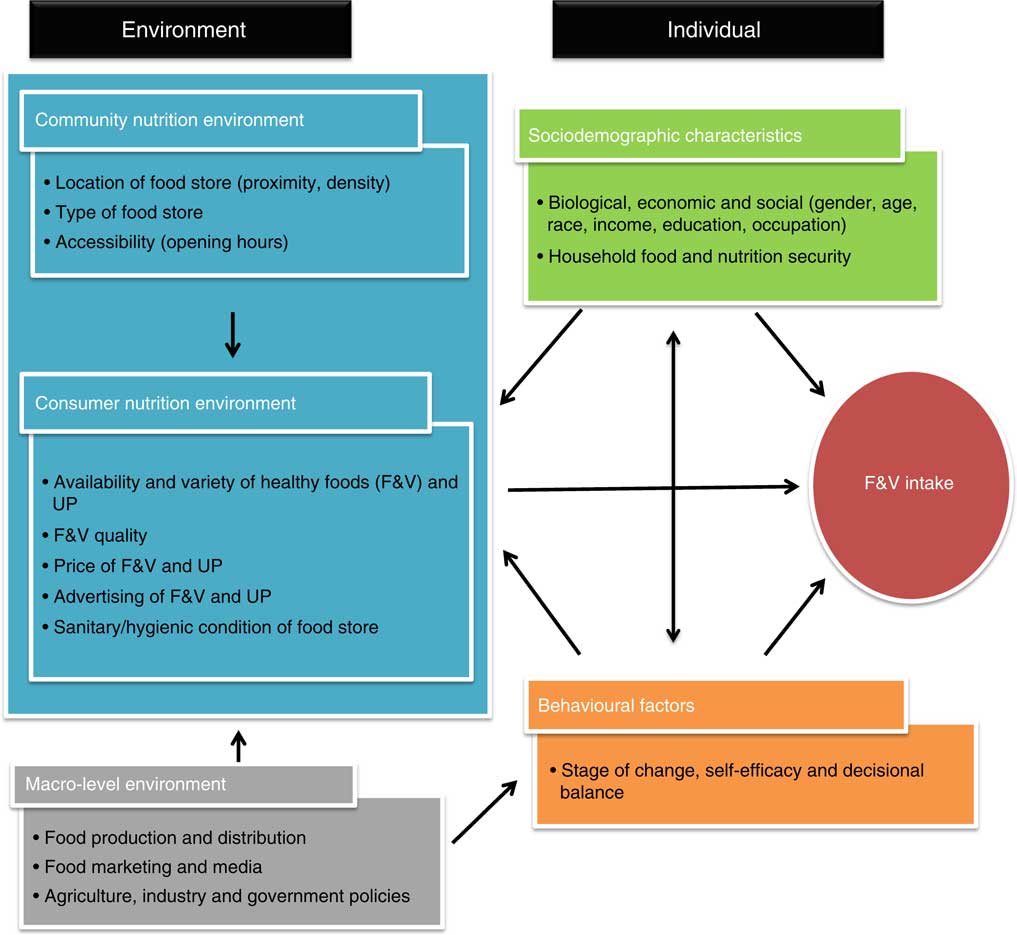
Fig. 1 (colour online) Conceptual model for the relationship between individual and food environmental factors and fruit and vegetable (F&V) intake (UP, ultra-processed products)
The following hypotheses were tested.
1. Community nutrition environment: greater proximity, density and accessibility of food stores, and the presence of specialised F&V markets, open-air food markets and supermarkets in the areas are positively associated with F&V intake, while greater presence of local/grocery stores is negatively associated with F&V intake( Reference Larson, Story and Nelson 13 , Reference Drewnowski, Aggarwal and Hurvitz 14 ).
2. Consumer nutrition environment: higher ratings of F&V availability, variety, quality and advertising, and lower F&V price within the stores are associated with greater F&V intake, while the same parameters for ultra-processed products are associated with lower F&V intake( Reference Duran, Lock and Latorre 25 ); and good sanitary and hygienic condition of food stores is positively associated with F&V intake( Reference Cannuscio, Hillier and Karpyn 26 , Reference Lee, Heinrich and Medina 27 ).
3. Individual variables: advanced stages of change and higher scores for self-efficacy and decisional balance are positively associated with F&V intake; additionally, age, female gender and higher socio-economic status (SES) and level of food security are positively associated with F&V intake( Reference Caspi, Sorensen and Subramanian 9 , Reference Pessoa, Mendes and Caiaffa 10 , Reference Gustafson, Sharkey and Samuel-Hodge 15 , Reference Duran, Diez-Roux and Latorre 18 , Reference Gustafson, Christian and Lewis 28 ).
Data collection
Data were obtained using two procedures. For individual data, face-to-face interviews with HAP users were conducted. For food environment data, we performed F&V food store audits. For both types of data collection, quality control procedures included: testing the instruments and two pilot studies; the creation of a protocol and instructional textbook; periodic staff training; and review of the completed questionnaires.
Individual-level data included sociodemographic characteristics, behavioural factors and the outcome F&V consumption. Participants’ home addresses were also collected to allow geo-processing and spatial analysis techniques. Additionally, the individuals’ interview included questions related to their families, as follows: household food security and the Brazilian Economic Classification Criteria (BECC) questionnaire, which allows a broader evaluation of the family households’ SES level (social-economic strata: A, B, C, D or E).
The Brazilian Food Insecurity Scale (EBIA), an adapted and validated version of the US Department of Agriculture scale, was used to assess household food security. The EBIA is composed of fifteen items that capture information about the household environment such as anxiety over insufficient food budget or supply, perceptions of inadequate food quality or quantity, and feeling of hunger( Reference Segall-Correa and Marin-Leon 29 ).
Daily F&V consumption was assessed via questions adapted from international surveillance systems( 30 , 31 ). These questions addressed the frequency (categorised as: 1–2 d/week, 3–4 d/week, 5–6 d/week, every day, almost never, never) and number of servings as well as the F&V preparation method. During an interview with participants, we provided them some examples of the usual F&V portion sizes that are commonly eaten. To analyse F&V consumption post hoc, the intake frequency was calculated as daily consumption. We also quantified intake in grams, considering 80 g to be the standard portion size( 32 ). Consumption adequacy considered the WHO recommended intake at least 400 g F&V/d:
 $$\hskip-25pt\eqalign{ &{\rm Daily}\ {\rm F}\,\&\,{\rm V}\ {\rm consumption}\left\ ( {\rm g} \right) \hskip15pt\cr & \quad =\left[ {\left( {{\rm Midpoint}\ {\rm of}\ {\rm the}\ {\rm intake}}\ {\rm category}{\div}7} \right)} \right \cr & \quad \hskip15pt {\times}{\rm number}\ {\rm of}\ {\rm servings} \right]{\times}80,$$
where the Midpoint of the intake category = for example, individuals who reported F&V consumption of 3–4 d/week have a midpoint of intake equal to 3·5 d/week. Frequencies expressed as ‘almost never’ and ‘never’ in the questionnaire were counted as zero.
Stage of change was measured by an algorithm for F&V that assessed readiness and motivation to change consumption over time and allowed classification on the five stages of change. Self-efficacy assessed participants’ confidence to change F&V intake across four different situations, including affordability, store availability, time to prepare and eat F&V, and confidence to consume the recommended quantity. Each response was placed on a 5-point Likert scale, ranging from ‘not at all confident’ to ‘extremely confident’. The answers were added together, generating a quantitative variable with a higher score indicating greater confidence. The decisional balance measured individuals’ reasons for (pros) and against (cons) F&V consumption (pros included: like the taste, have time to buy, ease of F&V preparation, healthy; cons included: high F&V expense, dislike F&V, do not have time to eat, do not have social support). Eight statements covered four benefits and four barriers to eating F&V and participants rated the importance of each item on a 5-point Likert scale. The items were added together to obtain an overall score, generating a quantitative variable where a higher score indicated more perceived benefits.
For food environment data, initial information on the existing food stores in the areas was acquired through geo-referenced databases from the Municipal Joint Taxation Secretariat. Stores that were not registered in public databases, but that were identified on-site by field staff, were also included.
Food store audits were conducted to validate the data available on public lists. Data collected for the community nutrition environment included location, type of food store, and the time and days of being open for business. We evaluated stores that sold F&V, including bakeries, convenience stores, small markets, local grocery stores, specialised F&V markets, open-air food markets, supermarkets and hypermarkets. Then, food stores were classified into the following categories, which are appropriate for the Brazilian context: (i) large-chain supermarkets; (ii) specialised F&V markets or open-air food markets; (iii) local grocery stores; and (iv) convenience stores and bakeries( Reference Costa, Oliveira and Lopes 11 , Reference Duran, Lock and Latorre 25 ).
Consumer nutrition environment variables were assessed using the Obesogenic Environment Study – Food Store Observation Tool (ESAO-S). This instrument is a tool validated to the Brazilian context using several measures such as the Nutrition Environment Measures Survey in Stores (NEMS-S), tested and validated in the USA( Reference Duran, Lock and Latorre 25 ), and the Environmental Profile of a Community’s Health (EPOCH) used in other countries( Reference Chow, Lock and Madhavan 33 ).
From ESAO-S, healthy food access was summarised by the Healthy Food Store Index (HFSI). The index ranged from 1 to 16 and included variables related to the availability, variety and advertising of healthy foods (F&V) and ultra-processed products. The instrument assessed the twenty most frequently purchased fruits and vegetables in the municipality in addition to the five most consumed ultra-processed products in Brazil, including sugar-sweetened beverages (soda and juices), chocolate cookies and processed corn snacks( 34 ). A higher HFSI value indicated better access to healthy foods and a greater quality of food store. Besides HFSI components, analysis of the consumer nutrition environment included investigation of the price and quality of food( Reference Costa, Oliveira and Lopes 11 , Reference Duran, Lock and Latorre 25 ).
The availability of F&V and ultra-processed products was evaluated by the presence of at least one unit of each purchasable item. To assess the variety of these foods and products, we determined the number of different types of each item (e.g. iceberg lettuce, green-leaf lettuce, red-leaf lettuce). The F&V quality was rated as acceptable or unacceptable depending on whether most of the food was withered, bruised, overripe or old-looking. Advertising was analysed by checking signs or advertisements that encouraged the purchase of the products( Reference Duran, Lock and Latorre 25 ). The average price of F&V and ultra-processed foods were analysed using the Z-score scale. This allows prices of the different items investigated to be comparable.
We also included twenty questions to evaluate the hygienic and sanitary aspects of the food stores. These questions addressed the presence of trash, animals, dust and stagnant water; the condition of the floor, walls, doors, windows and ceiling; and the adequacy of lighting, ventilation and waste management( 35 ). The answers were added together, with a higher score indicating better sanitary conditions.
Our analysis included only those establishments that agreed to participate in the study and that authorised data collection.
Data analysis
The Student t test for independent samples was used to test differences in F&V intake across areas with different HFSI.
The proximity of users’ homes to food stores was calculated using the ‘Near’ command from ArcView, which determines the closest distance between two points.
We used multilevel linear regression to quantify area-level variations in F&V intake and to examine the extent to which individual- and area-level factors explain these variations. The individual outcome is continuous F&V intake, with participants (level 1) located within HAP centre areas (level 2). Covariates were added based on the conceptual model in addition to the following criteria: for a high correlation (correlation coefficient >0·60) between covariates, we chose the variables with a lower P value and higher percentage of variability explained. The following steps were taken to build the model: (i) construction of a null model with a random intercept to estimate the overall variation in F&V intake at the context level; (ii) inclusion of individual-level covariates and test of improvement in fit; (iii) inclusion of area-level covariates and test of improvement in fit; (iv) test of random slopes for selected covariates (income; based on the hypothesis that income’s effect is not equal for all areas) and comparison with a model that was fitted previously through the likelihood ratio test; and (v) test of cross-level interactions for individual income and HFSI, allowing investigation of whether the association between neighbourhood HFSI and F&V intake differs by income.
The multilevel equation for our final model is:
 $$\eqalign{ F\,\&\,V\,intake_{{ij}} &= \gamma _{{00}} {\plus}\gamma _{{01}} HFSI_{j} {\plus}\gamma _{{10}} Age_{{ij}} {\plus}\gamma _{{20}} Income_{{ij}} \cr &\quad {\plus}\gamma _{{30}} FoodSecurity_{{ij}} {\plus}\gamma _{{40}} StageofChange_{{ij}} \cr & \quad {\plus}\gamma _{{50}} Self \hbox{-}{\rm {{}}}efficacy_{{ij}} {\plus}\gamma _{{60}} DecisionalBalance_{{ij}} \cr &\quad {\plus}U_{{0j}} {\plus}{\varepsilon}_{{ij}} ,\cr &\quad {U_{{0j}} \,\sim\,N\left( {0,\,\tau _{{00}} } \right),\quad {\varepsilon}_{{ij}} \,\sim\,N\left( {0,\,\sigma ^{2} } \right),} \cr } $$
where γ 00 is the common intercept; U 0j is the group-level error random intercept; and ε ij is the individual-level error. The variance for the individual and area is represented by σ 2 and τ 00, respectively.
The percentage of proportional change in variance (PCV) was calculated between the null model and each subsequent model to examine the extent to which the covariates explained the variation in F&V intake across areas. The intraclass correlation (ICC) was also quantified to examine the variability within and between areas, providing the proportion of the total variability that results from differences between areas.
P<0·05 was considered significant. Data were geo-referenced in ArcView version 10.1 and analysed in ArcView and Stata version 13.
Results
The eighteen HAP centre areas included 2944 participants and 336 food stores. Features of the food environment included a mean density of 6·06 (sd 5·07) units/km2 for food stores per buffer, with a predominance of specialised F&V and open-air food markets (61·7 %, v. 20·7 % of supermarkets and 17·6 % of local/small markets). The mean distance from an individual’s residence to the closest store within the buffer was 254·34 (sd 123·14) m and the mean HFSI value for all stores in the buffer was 10·49 (sd 2·38).
The mean number of participants per area was 189·7. The participants ranged in age from 21 to 87 years (mean 56·8 years), and 88·4 % were female. Mean monthly income was low ($US 226) and most did not go to college (less than 12 years of education, 91·7 %). Almost one-third (28·5 %) lived in a household with food insecurity, and 58 % of the households were in the lower social-economic strata (C, D or E).
Table 1 describes F&V intake according to different individual- and area-level characteristics and demonstrates how F&V intake varied between contexts with different HFSI. F&V intake was significantly higher for elderly people, those with a high income, those who were food secure, people in the upper stages of change, and those who had high self-efficacy and decisional balance. Overall, individual F&V intake was greater in areas with better access to healthy foods (higher HFSI) compared with areas of lower HFSI. Interpretation of data in Table 1 shows that the F&V intake was lower in areas where most stores had higher F&V price, but that F&V intake also varied by the context with different HFSI.
Table 1 Mean fruit and vegetable (F&V) intake (grams per day) by individual- and area-level covariates, stratified by areas with high and low Healthy Food Store Index (HFSI); representative sample of the Health Academy Program, Belo Horizonte, Brazil, March 2013–June 2014

P50, median.
The areas of low/high HFSI were defined according to median HFSI value. The same was done for covariates. F&V intake according to individual and area-level characteristics: statistical comparison between columns. F&V intake between HFSI areas: statistical comparison between rows.
(*) P<0·10; *P<0·05; **P<0·01; ***P<0·001.
† Brazilian reals to US dollars: 2·25 was the average exchange rate during the data collection period.
Table 2 shows bivariate random-intercept models of individual-level and area-level covariates. All variables presented in the conceptual model were added to the null model one at a time (only the theoretically or statistically important ones are presented in Table 2). At the individual level, age, education, income, food insecurity, stage of change, self-efficacy and decisional balance were statistically significantly and positively associated with F&V intake, as presented in the hypothesis. The largest ICC decreases were observed for age, income, stage of change and self-efficacy, showing that part of the area variability resulted from distribution of those individual-level covariates. The association between F&V intake and local grocery stores was close to significance (P=0·069), but negative, as established in the hypothesis of the study. Both HFSI and specialised F&V markets were also statistically significantly and positively (as predicted by the hypothesis) associated with F&V intake, whereas F&V quality was trending towards significance (P=0·064). Compared with the null model, the bivariate models with HFSI and specialised F&V markets showed the greatest reductions in between-group variability (τ 00), suggesting that these area-level covariates explain between-group variability in F&V intake.
Table 2 Multilevel linear regression model of fruit and vegetable (F&V) intake and individual- and area-level covariates (each variable included separately); representative sample of the Health Academy Program, Belo Horizonte, Brazil, March 2013–June 2014

PCV, percentage change in variance; ICC, intraclass correlation; HFSI, Healthy Food Store Index.
(*) P<0·10; *P<0·05; **P<0·01; ***P<0·001.
† 0=secure v. 1=insecure.
Table 3 presents the results of multivariable multilevel linear regression models with random intercepts. In Model 1, the null model demonstrates significant variation in F&V intake across areas (τ 00=21·09; P<0·001) and we showed that the food environment is important for a healthy diet, with area-level variables explaining 10·5 % of the variation in F&V intake.
Table 3 Multilevel linear regression models of fruit and vegetable (F&V) intake and individual- and area-level covariates (multivariable models); representative sample of the Health Academy Program, Belo Horizonte, Brazil, March 2013–June 2014

HFSI, Healthy Food Store Index; ICC, intraclass correlation.
Model 1, null model with random intercept; Model 2, includes Model 1 plus individual-level covariates; Model 3, includes Model 2 plus area-level covariates.
(*) P<0·10; *P<0·05; **P<0·01; ***P<0·001.
In Model 2, when the individual-level covariates are added, their fixed effects show that older age and higher income, household food security (compared with insecure), higher stage of change, self-efficacy and decisional balance were significantly associated with higher F&V intake. Significant area variation (τ 00) in F&V intake remained, but it was substantially lower than in the empty model. In Model 3, we inserted the area-level covariates. After controlling for individual-level characteristics, HFSI was the area-level variable that remained significant, showing that a greater F&V intake was associated with better access to healthy foods (defined by higher HFSI values). The between-group variability and ICC across Models 1, 2 and 3 were progressively reduced, indicating that the covariates helped to explain F&V intake. The variables in the final model explained 63 % of the variation in F&V intake across areas (PCV Model 2, 56·7 %; PCV Model 3, 63·3 %).
We next tested random slopes for income to investigate whether the within-area effect of income on F&V intake differed between areas. Although there was some statistical evidence of variation in slope between areas, the variance of the random slope (τ 11) was very small and the random-slope model did not provide a better fit. We then proceeded to test a cross-level interaction between individual income and HFSI, but it was not statistically significant (β=5·06; P=0·129).
Discussion
We observed context-level variations in F&V intake, with individual variables (age, income, food insecurity, stage of change, self-efficacy and decisional balance) significantly accounting for this variability, in addition to HFSI, which is an area-level variable. From our initial hypothesis that different levels would influence F&V consumption, we found that individual- and area-level factors together explained 63 % of the total variation observed.
The low adequacy (34 %, despite the relatively high mean intake of 369 g) found for F&V consumption in the present study is consistent with national surveys conducted in Brazil (41·5 % in 2013( 36 ); 31·1 % in 2016( 37 )). F&V consumption has not been consistent with recommendations at both the international and national levels, even though the benefits of F&V consumption are widely disseminated( 30 , 37 ). This context, characterised by inadequate food consumption, health risks and vulnerabilities, reinforces the need to explore the factors associated with F&V consumption.
Individual-level factors were important contributors to the variation in F&V intake across the areas. Considering the poor environment in which these individuals live, developing abilities and competencies to overcome barriers and practise healthy eating may be crucial to deal with the challenges of their conditions( Reference Cannuscio, Hillier and Karpyn 26 ). However, in addition to their individual characteristics, the quality of shops where they live may serve as a valuable facilitator or barrier to access for the consumer.
F&V intake was strongly influenced by SES level, and participants with higher individual income and those living in a household with nutrition security were more likely to have better F&V intake. These results agree with consistent evidence from high-income countries that found less access to and affordability of healthy foods in socio-economically disadvantaged neighbourhoods( Reference Gustafson, Sharkey and Samuel-Hodge 15 ).
We found that all the behavioural factors were significantly associated with F&V intake. Studies have shown that behaviour change will occur only when a person has substantial confidence to act (high level of self-efficacy) and perceives more benefits than barriers to change (decisional balance), in addition to other key concepts including motivation, knowledge, intentions and skills. Therefore, using theories such as the Transtheoretical Model and Social Cognitive Theory to develop nutritional interventions can provide a useful framework( Reference Fish, Brown and Quandt 4 , Reference Diez Roux and Mair 5 ).
Individual F&V intake was also partly conditioned by the food environment where people live, with area-level variables explaining 10·5 % of F&V intake variation, after controlling for individual-level characteristics. The consumer nutrition environment, measured through the index HFSI that covers different features, was shown to be more relevant than the community nutrition environment( Reference Gustafson, Sharkey and Samuel-Hodge 15 , Reference Gustafson, Christian and Lewis 28 ). According to our results, this index might be an interesting measurement and a proxy for a healthy food environment, representing and summarising its different components. Thus, our results support the hypothesis that a more sophisticated characterisation of environment (through food store audits), combining different dimensions such as availability, variety, quality and cost, would lead to a better reflection of true access and, in this sense, a more consistent insight into the relationship between the food environment and diet.
Studies have begun to show that it is not merely the presence of a supermarket or other types of store that influences behaviour, but it is what consumers encounter within that store( Reference Caspi, Sorensen and Subramanian 9 , Reference Gustafson, Christian and Lewis 28 ). Using the number or type of stores as a proxy for the availability of healthy foods may oversimplify the interdependence between individuals and their environments. This has been an important limitation of prior studies. The challenge is even greater for some contexts because almost all the prior studies were performed in high-income countries, while there is no evidence regarding the consumer food environment–diet relationship in LMIC( Reference Ni Mhurchu, Vandevijvere and Waterlander 38 ). To our knowledge, the present study is one of the few to conduct comprehensive assessments (association with the community nutrition environment and the consumer nutrition environment) of the food environment through food store audits in an LMIC.
We believe our study may help to address some gaps and inconsistencies presented by previous studies. Most other studies on the food environment were conducted in the USA and other developed countries, where the ease of access to supermarkets has been associated with a healthy diet( Reference Larson, Story and Nelson 13 , Reference Drewnowski, Aggarwal and Hurvitz 14 ). However, the situation outside these countries seems to be different and suggests a need for caution in extrapolating research on environmental influences( Reference Caspi, Sorensen and Subramanian 9 , Reference Gustafson, Sharkey and Samuel-Hodge 15 , Reference Popkin 39 ). For example, a study performed in an LMIC showed that specialised F&V markets and open-air food markets were a proxy for access and consumption of healthy foods, which is consistent with our results( Reference Duran, Diez-Roux and Latorre 18 ). Almost no evidence regarding the associations between the food environment and diet exists from LMIC( Reference Belon and Nykiforuk 17 , Reference Ni Mhurchu, Vandevijvere and Waterlander 38 ).
Second, although the vast majority of early studies used secondary databases( Reference Diez Roux and Mair 5 ), we conducted direct measurement of food stores because business lists are rarely up to date or without error( Reference Diez Roux and Mair 5 , Reference Caspi, Sorensen and Subramanian 9 , Reference Belon and Nykiforuk 17 ). Third, another major strength of our research is that it was designed with much attention to the measurement of neighbourhood attributes. Including measures of the consumer food environment is important to understand the relationship between the food environment and intake( Reference Gustafson, Sharkey and Samuel-Hodge 15 ). Other methodology strengths include the use of a conceptual model as a guide; a validated store audit that is suitable for the Brazilian context; and well-planned data collection conducted by trained dietitians, which aimed to reduce the indicators’ subjectivity, standardise the instruments and reduce the chance of possible biases. Fourth, most studies assume that people shop in stores that are geographically proximate( Reference Caspi, Sorensen and Subramanian 9 ). In our study, we conducted qualitative research that revealed individuals purchased F&V from shops close to their houses( Reference Figueira, Lopes and Modena 12 ). The same pattern was also verified when we asked the address where they shop for F&V.
Therefore, we believe our study contributes to the progress of food environment studies in Brazil and Latin American countries. The study advances the hypothesis of the effect of individual- and area-level factors on F&V intake in a different context. This research topic is understudied in low- and middle-income settings and this project makes important methodological contributions, such as: inclusion of objective and subjective measures; integration of perception measures and Geographic Information Systems; primary data collection; and exploration of the association between the food environment and primary health-care services.
Limitations of our study include the cross-sectional design. Although the cross-sectional nature limits causal inferences, the results are consistent with those of prior studies. Other limitations are the use of arbitrary limits to define the food environment; and that other aspects which can influence F&V intake were not measured, such as the social environment and macro-level environment. Another limitation was the method used to asses F&V intake, because there is no gold-standard measure in nutritional epidemiology. However, the method used in the current study was adapted from important international and national surveillance systems, and a Brazilian study evaluated the instrument and found substantial agreement for F&V consumption compared with the 24 h recall method, considered to be the gold standard in that study (0·62). Regarding the method’s validity, there was a sensitivity of 79·8 %, specificity of 53·9 % and positive predictive value of 65·9 %( Reference Mendes, Campos and Malta 40 ). The present research also evaluated the validity of methods assessing F&V intake, and we found that the brief questionnaire used in the current study presented the strongest correlation with 24 h recall (reference method), compared with an FFQ( Reference Lopes, Santos and Lopes 41 ).
The composition of the sample may have introduced bias and generalisation is always uncertain. Considering external validity, we believe that our findings may be extrapolated for primary care users and populations who live in situations of social vulnerability. Moreover, SES was assessed only at the individual level and it could be considered a limitation not to evaluate SES related to the area level. However, it is important to highlight that studies usually assess ‘neighbourhood SES’ as an aggregate measure derived from the socio-economic characteristics of the residents( Reference Diez Roux and Mair 5 ). Thus, we believe that it would be more robust to use individual-level SES and we suggest inclusion of other area-level variables in further studies which could reflect the environment’s characteristics and affect the availability of neighbourhood resources and opportunities for healthful choices, regardless of personal resources. Examples of variables are segregation, health resources, discrimination, violence and vulnerability.
Individual and environmental strategies to increase F&V intake need to be combined with government policies and regulations that have population-wide effects, such as restrictions on marketing unhealthy foods to children, food labelling regulations, taxes on ultra-processed foods and subsidies on F&V, adequate distribution systems and the implementation of healthy food policies in primary health-care services( Reference Swinburn, Kraak and Rutter 6 ). Additionally, the positive association found here between SES, food security and intake confirms that reducing social inequalities in the access to healthy foods should also be a central strategy for improving diet quality and preventing obesity.
Conclusion
The present study is one of the first to comprehensively assess the food environment in an LMIC and we showed that the food environment is important for a healthy diet, with area-level variables explaining 10·5 % of the variation in F&V intake. Still, the consumer nutrition environment was more predictive of healthy eating than the community nutrition environment. We found that better access to healthy foods (measured through the HFSI) was associated with greater F&V intake, even after accounting for individual-level factors. Individual-level factors were also important contributors to F&V intake, with the factors age, income, food security, stage of change, self-efficacy and decisional balance being associated with the outcome.
The findings suggest new possibilities for interventions, by combining individual and environmental strategies. Considering intervention/policy recommendations, we suggest: individual or group nutritional interventions based on behavioural theories; educational interventions within food stores that encourage better dietary choices; community interventions that enhance the ability of food stores to offer healthy foods rather than processed foods (such as health-related food taxes, in-store promotions, restrictions on unhealthy food marketing, F&V programmes, award schemes, choice architecture, reformulation of the food supply, reducing the energy density of processed foods and portion size limits); and reducing social inequalities in the access to healthy foods (through strategies as subsidies on F&V, point-of-sale initiatives, incentives for shops to locate in underserved areas and nutrition advice for at-risk individuals). We suggest that further studies, including natural experiment studies, should be conducted to evaluate the causality between nutrition, health and aspects of the environment.
Acknowledgements
Acknowledgements: The authors thank ZW Design for support with the figure artwork. Financial support: This work was supported by the Conselho Nacional de Desenvolvimento Científico e Tecnológico (CNPq; grant number 476686/2013-0) and the Fundação de Amparo à Pesquisa de Minas Gerais (FAPEMIG; grant numbers PQ-033376-12, 21618/2013, PPM-00254-15). CNPq and FAPEMIG had no role in the design, analysis or writing of this article. Conflict of interest: None. Authorship: M.C.M. contributed to the research question, design of the study, carried it out, data analyses, interpretation of results and wrote the manuscript. A.V.D.R. contributed to conceptualise the research questions, assisting with all statistical analyses, interpretation of results and reviewing the manuscript. B.V.L.C. contributed to design of the study, carrying it out and manuscript writing. A.C.S.L. supervised and designed the study, carried it out, and contributed to statistical analyses, interpretation of results and reviewing the manuscript. All authors read and approved the final manuscript. Ethics of human subject participation: This study was conducted according to the guidelines laid down in the Declaration of Helsinki and all procedures involving human subjects were approved by the Federal University of Minas Gerais Ethics Research Committee and City Hall. Written informed consent was obtained from all subjects.


