


A healthy dietary pattern such as one rich in vegetables, fruits, legumes and fibres, and with low consumption of SFA and red meat, is associated with a lower risk of developing obesity(Reference Seiler, Chen and Brown1). Frequency of home cooking and cooking skills are of importance, as previous literature indicated that the frequency of home cooking and better cooking skills were associated with a better diet quality(Reference Mills, White and Brown2,Reference Tani, Fujiwara and Kondo3) . The type of food, quantity and the way in which people eat (e.g. healthy or unhealthy foods) result from an interaction of individual-level factors such as taste preferences, budget, cooking skills, promoted, marketed and what is accessible and available in the food environment(Reference Kremers, de Bruijn and Visscher4,Reference Mackenbach, Lakerveld and Van Lenthe5) .
The food environment is the combination of all social, physical, economic and online aspects that influence food choices and comprises both healthy and unhealthy features, for example (organic) grocery stores or (fast-food) restaurants(Reference Burgoine and Monsivais6). An often used typology of food environments by Glanz et al.(Reference Glanz, Sallis and Saelens7) is a distinction between the community, consumer and organisational food environment, which are in turn influenced by the information and policy environment. The community food environment, which consists of the types and locations of food outlets in communities, is especially of interest for public health research, because it has changed drastically in the last decades(Reference James, Seward and James O’Malley8–Reference Hobbs, Mackenbach and Wiki10). This has resulted in drastic increases in the availability and accessibility of food outlets selling ultra-processed, energy-dense foods in many areas(Reference Monteiro, Moubarac and Cannon11). Even though the evidence remains contradictive(Reference Caspi, Sorensen and Subramanian12–Reference Holsten14), easy access to affordable, unhealthy foods is likely to contribute to unhealthier diets and in turn increases the risk of obesity.
Alongside the change in food environments, a transition in cooking and food preparation skills has also been observed(Reference Lam and Adams15). This transition has led to an increased use of pre-prepared, packaged and convenience foods, which require fewer and/or different skills than what is often referred to as traditional or ‘from scratch’ cooking(Reference James16). Indeed, spending less time per day on food preparation is associated with a more frequent use of take-away and full-service restaurants(Reference Monsivais, Aggarwal and Drewnowski17). The decreased time spent on cooking(Reference Smith, Ng and Popkin18,Reference Plessz and Etile19) is likely attributable to a preference for convenience and competing time-use activities such as socialising.
Previous research has shown that adults with better nutrition knowledge and cooking skills have better quality diets(Reference Hasan, Thompson and Almasri20–Reference Lavelle, Bucher and Dean22). We defined cooking skills as the ability to prepare meals in different ways(Reference Hartmann, Dohle and Siegrist23). It may be hypothesised that individuals with better nutrition knowledge and cooking skills are better able to find nutritious foods among the ubiquitous availability of unhealthy foods. Alternatively, individuals with better cooking skills may be able to prepare a healthy meal in less time than those without good cooking skills, thereby relying less on ‘convenience’ options in the food environment such as takeaway or fast-food meals.
To date, it remains unclear how the food environment and cooking skills interact in relation to the frequency of home cooking, diet quality and BMI.
Therefore, we aimed to study if a potential association of the food environment with the frequency of home cooking, diet quality and BMI is modified by the levels of cooking skills.
Methods
Study design and study population
We used data from the Eet & Leef study, a cross-sectional survey that was designed to explore how food retail environments influence food choices and health. The study design and data collection methods have been outlined previously(Reference Hoenink, Waterlander and Beulens24,Reference Mackenbach, Hobbs and Pinho25) . In brief, participants were eligible if they were able to understand the Dutch language, and if they had access to a computer with internet and e-mail address; thus, 2522 eligible participants between the ages of 18 and 65 years from the twenty largest urban cities in the Netherlands were registered and invited to participate in the survey(Reference Mackenbach, Hobbs and Pinho25). In order to create a diverse study population, the recruitment of participants followed a stepwise approach. Initially, postal invitations were sent at random to home addresses in the twenty largest cities in the Netherlands. In addition, a targeted Facebook and Instagram campaign was implemented to increase the number of men, as well as women with lower education. Finally, invitations were sent to individuals from these subgroups who had previously participated in studies conducted at our department. Participants were asked to complete three parts of a web-based survey on the food environment, dietary intake and health-related variables including BMI. All variables in the current study were derived from the first part of the questionnaire that was completed by all 1784 participants, except for dietary intake that was derived from the third part of the survey that was completed by 1492 participants. We continued our analyses with participants who had complete dietary data available and excluded thirty-one participants because of unlikely energy intake levels: fewer than 500 and greater than 3500 kcal for women and fewer than 800 and greater than 4200 kcal for men(Reference Banna, McCrory and Fialkowski26). This resulted into an analytical sample size of 1461 participants.
Upon completion of the three-part survey, participants received a gift voucher of 15 euros. This study was approved by the Medical Ethical Committee of VU University Medical Center (no. 2019.307); all participants provided digital informed consent.
Exposures
Food environment
Data regarding the geographical location and types of food retailers from 2019 were gathered from Locatus(27), a commercial company from the Netherlands. This Dutch commercial dataset has previously been validated and showed ‘excellent’ agreement for both the location and classification of food outlets with a κ of 0·953 and a concordance of 0·939(Reference Canalia, Pinho and Lakerveld28). Data from Locatus were linked to the specific home addresses and to the work addresses. We defined the main exposure variables as the count of food stores per 10-unit higher count around the home and work environment that sell ingredients to cook, such as a supermarkets, greengrocers, bakeries, poultries and butchers. We included these types of food retailers, because they mostly sell ingredients to be prepared at home(Reference Lake, Burgoine and Greenhalgh29). In addition, we calculated the count of restaurants per 10-unit higher count around the home and work environment that sell prepared meals, such as restaurants and fast-food shops, since these places mostly prepare meals to eat away from home(Reference Lake, Burgoine and Greenhalgh29). We analysed our results per 10-unit higher count to facilitate the interpretations of the results.
Cooking skills
We had data of six items about cooking skills on a 5-point Likert scale from the Food Literacy questionnaire developed by Poelman et al. (Reference Poelman, Dijkstra and Sponselee30) to assess cooking skills. Confirmatory factor analysis could not confirm the proposed factor structure of the six items loading onto one factor (Comparative Fit Index = 0·97, Root Mean Square Error of Approximation = 0·07, Tucker-Lewis Index = 0·95). Exploratory factor analysis suggested that one item needed to be removed (‘Are you able to change a meal? For example if you are missing one of the ingredients?’) and that the remaining five items loaded onto one factor. These were questions regarding (1) the preparation of fresh vegetables in different methods; (2) if the participant finds it hard to prepare a meal with more than five ingredients; (3) if the participant is able to make alterations to the meal (in case there is an ingredient missing); (4) whether the participant is able to prepare fresh fish in different ways and (5) and if the participant can prepare a meal with fresh ingredients ‘from scratch’. Internal consistency of those items was good (Cronbach’s α in this study: 0·77), and test–retest reliability was good (Spearman’s correlation of 0·84). The level of cooking skills used in our analytical sample consisted out of an average score that was calculated and ranged from 1 to 5, where a higher score indicated a better level of cooking skills.
Outcomes
Frequency of home cooking
In order to evaluate the frequency of home cooking, the participants were asked to fill in how often they or their partner cooks at home. The following answering options were available: ‘never’; ‘1–2 times per year’; ‘5–6 times per year’; ‘1 time per month’; ‘2 times per month’; ‘1 time per week’; ‘2 times per week’; ‘3 times per week’; ‘4 times per week’; ‘5 times per week’; ‘6 times per week’ or ‘every day’. For our analyses, we dichotomised the frequency of home cooking into cooking <6 and 6–7 d a week, to create a more equal data distribution between groups.
Diet quality
Dietary intake was estimated from a 34-item FFQ – the Dutch Healthy Diet FFQ. This FFQ was used to assess adherence to the Dutch Dietary guidelines from 2015. Based on the FFQ, fifteen components of the Dutch Healthy Diet Index of 2015 (DHD15-index) were derived and were used to study diet quality in our study population. This index ranged from 0 to 150 with the highest index indicating a better diet quality according to the Dutch dietary guidelines(Reference van Lee, Feskens and Meijboom31). Validation of the DHD15-index derived from the Dutch Healthy Diet FFQ was considered acceptably correlated with the DHD15-index derived from the reference method, the 180-itemed FFQ, with a Spearman’s correlation of 0·57 (95 % CI (0·53·0·60))(Reference van Lee, Feskens and Meijboom31).
BMI
Participants were asked to fill in their length in centimetres and their weight in kilograms. We calculated BMI by dividing weight by the square of height (weight (kg)/height (m2)).
Covariates
Information regarding sex and age was self-reported. Educational level of the participant was asked in eight different categories according to the Dutch educational system: no education; primary school; lower vocal education; general secondary education; secondary vocational education; higher general secondary education; higher professional education and not applicable/do not know. Net income of the participants’ household per month was asked and six different answering options were available, with a range between 0 and 1200 euros per month and more than 4000 euros per month. Household composition was defined by the number of adults and children living in one house. Information regarding kilocalories (kcal) was derived from the FFQ. Information about urbanisation was retrieved from the Central Bureau of Statistics Netherlands and coded as (1) very urban (>2500 addresses per km2); (2) strongly urban (1500–2500 addresses per km2); (3) moderately urban (1000–1500 addresses per km2); (4) little urban (500–1000 addresses per km2) and (5) not urban (<500 addresses per km2)(Reference Bresters32).
Statistical analyses
Multivariable linear and modified Poisson regression analyses were performed to analyse associations between the count of restaurants and food stores and diet-related outcomes. We decided to use modified Poisson regression models instead of logistic regression models, because odds ratios overestimate risk ratios when the event (home cooking 6–7 times a week) is common(Reference Zou33). Modified Poisson regression analyses produce risk ratios; however, the frequency of home cooking is not a public health risk. Therefore, instead of interpreting our results in risk ratios, we interpreted our results in terms of likelihood to facilitate the interpretations.
We tested linearity assumptions using quadratic terms, but the model fit did not improve between the independent variable and any of the outcome variables when including these terms.
We developed three models to study associations between our primary exposures, count of restaurants and count of food stores per 10-unit higher count and our three different outcomes: frequency of home cooking, diet quality and BMI. For our first outcome, frequency of home cooking, we performed modified Poisson regression analyses where we adjusted for sex, age and energy intake (kcal) in our first model. In our second model, we additionally adjusted for educational level, net household income, household composition and urbanisation. In our third model, we added level of cooking skills as an interaction term to the fully adjusted model (model 2). For our second and third outcomes, diet quality and BMI, we performed linear regression analyses and used the same models. Analyses were stratified when an interaction (P-for-interaction <0·1) was obtained for cooking skills.
In addition, we also studied associations between cooking skills and frequency of home cooking, diet quality and BMI, where we adjusted for the same confounders in model 1 and 2 as described earlier.
We excluded individuals with missing exposure data and dietary information and used multiple imputation (m = 10 imputations) to impute missing values of all other covariates except for energy intake (0·3 % education – 7·7 % net household income), based on the fully conditional specification methods (predictive mean matching) to prevent reduced power and attrition bias(Reference Lewin, Brondeel and Benmarhnia34). Pooled estimated results based on imputed data were used in the regression models. We used R statistics version 4.0.3 for all statistical analyses.
Results
We included 1461 participants in our study population with a mean age of 42·5 (±13·7) years. Around 64·1 % of the participants were women and 57·1 % had a higher education. Further descriptive statistics are presented in Table 1.
Table 1. Descriptive characteristics of included participants from the Eet & Leef Study participants, N = 1,461

Descriptive statistics of characteristics of the study participants from the Eet & Leef Study based om imputed data of covariates (m = 10). Variables are presented in percentages (%), variables with a normal distribution are presented as standard deviations (+/-), variables with a skewed distribution are presented as median with an interquartile range (IQR).
Table 2 shows the risk ratios per 10-unit higher count of restaurant and food stores around the home and work environment and the frequency of home cooking. No associations were found between the count of restaurants and frequency of home cooking (risk ratio: 1·00 (95 % CI (0·99, 1·00)). Similarly, no associations were found between count of food stores and frequency of home cooking (risk ratio: 0·99 (95 % CI (0·97, 1·02)). We found no interaction between count of restaurants or food stores and cooking skills in relation to frequency of home cooking (P-for-interaction: 0·7 and 0·9, respectively).
Table 2 Main results of restaurants/food stores around the home and work environment and diet-related outcomes
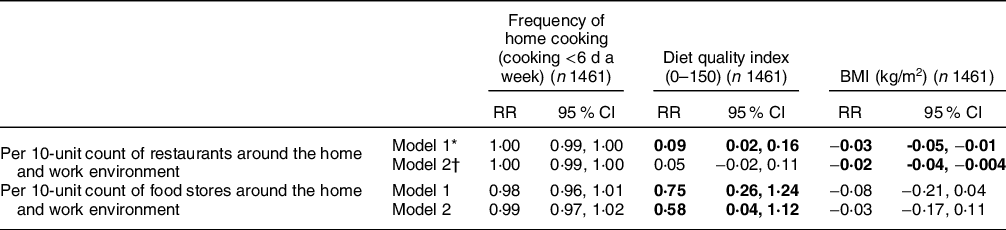
* Model 1: adjusted for sex, age and energy intake (kcal).
† Model 2: adjusted for model 1, and educational level, net household income, household composition and urbanisation. Statistical significance (P < 0·05) is indicated in bold font.
Results are presented in risk ratios (RR) and 95 % confidence intervals obtained from modified Poisson regression analyses to study associations between restaurants and food stores around the home and work environment and frequency of home cooking (cooking <6 d a week). Results are presented in beta coefficients (β) and 95 % confidence intervals obtained from linear regression analyses to study associations between restaurants and food stores around the home and work environment with outcomes diet quality index (0–150) and BMI (kg/m2) in the general population. Based on imputed data of covariates (m = 10).
We also observed no association in the second model between a 10-unit higher count of restaurants and diet quality (β 0·05 (95 % CI (-0·02, 0·11) see Table 2). However, a 10-unit higher count of food stores was associated with a higher diet quality in model 2 (β 0·58 (95 % CI (0·04, 1·12)). We found no interaction between count of restaurants or food stores and cooking skills in relation to diet quality (P-for-interaction: 0·1 and 0·5, respectively).
In addition, Table 2 shows that, per 10-unit higher count of restaurants, a lower BMI was found (β −0·02 (95 % CI (-0·04, −0·004)). No associations were found for count of food stores in model 2 (β −0·03 (95 % CI (-0·17, 0·11)). Again, we found no interaction between count of restaurants or food stores and cooking skills in relation to BMI (P-for-interaction: 0·8 and 0·9, respectively).
In additional analyses, we observed that better cooking skills were associated with a higher likelihood of cooking 6–7 times a week, compared with <6 d a week (model 1: risk ratio: 1·25 (95 % CI (1·18, 1·33)), model 2: risk ratio: 1·24 (95 % CI (1·16, 1·31))) and a higher diet quality (model 1: β 5·60 (95 % CI (4·42, 6·80)), model 2: β 4·45 (95 % CI (3·27, 5·63))) but not with BMI, see Supplemental Table 1.
Discussion
We examined whether the association between the food environment around home and work and the frequency of home cooking, diet quality and BMI was modified by the level of cooking skills among Dutch adults. We expected that individuals with better cooking skills would rely less on the food environment and would therefore have better diet-related outcomes even when exposed to an unhealthy food environment. However, we found no evidence for effect modification in the association between exposure to food retailers and diet-related outcomes by the level of cooking skills. Associations between the presence of restaurants and food stores around the home and work environment and frequency of home cooking, diet quality and BMI were mixed, since we found a positive association between better cooking skills and a higher likelihood of frequency of home cooking and a higher diet quality, but not with BMI.
To our knowledge, no studies have investigated effect modification by the level of cooking skills in association with the food environment. Previous studies did however show other types of individual effect modifiers, such as socioeconomic status (SES)(Reference Mackenbach, Nelissen and Dijkstra35), self-control(Reference Mackenbach, Lakerveld and Generaal36) and financial strain(Reference Mackenbach, Beenackers and Noordzij37), but also found limited evidence for effect modification. This may be explained by usage of different measures for the food environment (e.g. using proximity or density measures) or because effect modification by personal characteristics does not have a substantial influence.
It could be speculated that the lack of moderating effects in this and other studies is due to the inconsistent main effects of food environment exposures and diet-related outcomes(Reference Caspi, Sorensen and Subramanian12,Reference Cobb, Appel and Franco13,Reference Bivoltsis, Cervigni and Trapp38,Reference Lytle and Sokol39) . Indeed, while we did find that a higher availability of food stores selling ingredients for meals around home and work was associated with a better diet quality, we also observed that a higher availability of restaurants around home and work was associated with a lower BMI, although effect sizes were very small. More importantly, we found no meaningful associations between either availability of food stores or availability of restaurants with frequency of home cooking.
There are several explanations for these null or inconsistent results that have also been outlined elsewhere(Reference Mackenbach, Hobbs and Pinho25,Reference Bivoltsis, Cervigni and Trapp38,Reference Lytle40) , such as self-selection bias(Reference Cobb, Appel and Franco13), reverse causality(Reference Paulitsch and Dumith41), the co-location of healthy and unhealthy food retailers(Reference Morland, Wing and Diez42), interaction with other built environment factors such as walkability(Reference Tseng, Thornton and Lamb43), interaction with other food environment factors such as affordability(Reference Mackenbach, Burgoine and Lakerveld44) and lack of mediating variables such as actual use of the food retailers under investigation(Reference Mackenbach, Charreire and Glonti45). In addition, our participants had a relatively high level of cooking skills and high frequency of home cooking, which may also have masked any results that may be observed in a population less skilled in cooking.
We observed that better cooking skills were associated with a higher frequency of home cooking and better diet quality, which is in line with previous studies(Reference Lavelle, Bucher and Dean22,Reference Farmer, Wallen and Yang46,Reference Wolfson, Leung and Richardson47) . We did not find associations between cooking skills and BMI, but this may be due to self-selection bias where young individuals with lower BMI live in urban areas with many restaurants(48). It may also be attributable to factors related to the other side of the energy balance (i.e. physical activity). Not many studies have investigated this association between cooking skills and BMI before; therefore, we cannot confirm whether there is evidence that cooking skills and BMI are associated with each other. All in all, the question remains whether better cooking skills can ‘protect’ individuals from an unhealthy food environment, and we hypothesise that this is because of the difficulties in defining ‘true exposure’ to the food environment. It would be of interest to use methodologies to measure food environment exposure more precisely, such as Global Positioning Systems(Reference Poelman, van Lenthe and Scheider49), and combine this with survey data on which food outlets were actually used.
The results of this study should be interpreted in the light of some strengths and limitations. A main strength of this study is the extensive database with a range of variables on diet-related outcomes and psychosocial resources, such as cooking skills that could be linked to individuals’ home and work addresses. The latter is especially a strong point of the study, since most studies only use exposure to food outlets around the home, which underestimates the ‘true exposure’(Reference Monteiro, Moubarac and Cannon11). Yet, future studies may want to include additional covariates such as cultural background and type of employment, which could influence the time that individuals spend on home cooking as described earlier(Reference Mills, White and Brown2).
An important limitation of this study is the cross-sectional nature: changing food environments are very likely to have a more important role for the increased prevalence of obesity than that current food environments can explain individual variations in BMI. However, to the best of our knowledge, no studies have data on changes in food environment exposure, changes in diet-related outcomes and cooking skills available.
In addition, we used self-reported BMI data, which could have led to underestimations of participants’ BMI, although previous studies have demonstrated a relatively good validity of BMI self-reports(Reference Hodge, Shah and McCullough50). Another limitation that should be discussed is the use of a shorter version of the FFQ with 34-items compared with the full-length FFQ of 180-items(Reference van Lee, Feskens and Meijboom31). Although van Lee et al.(Reference van Lee, Feskens and Meijboom31) validated the 34-itemed FFQ against the 180-itemed FFQ and reported that the DHD-FFQ had acceptable ranking capacity in individuals, this may partially explain the lower-than-average mean energy intake in our sample. Although we found some significant associations, the effect sizes were small. Therefore, translations to practice may be limited. Especially, since effect sizes were presented as an increase per 10-unit higher count in food stores or restaurants within a 1000-m buffer. Finally, we speculate that the lack of effect modification may be attributable to the lack of consistent main effects. Therefore, it would be interesting for future studies to explore different methodologies to study the interaction between individuals and their food environment.
Conclusions
We conclude that being exposed to food stores was associated with a higher diet quality and being exposed to restaurants was associated with a lower BMI. Better cooking skills were associated with a higher frequency of home cooking and a better diet quality but did not modify the observed associations with the food environment. Future studies should explore different approaches to understand how individuals interact with their food environment.
Acknowledgements
We are grateful for the dedication of the participants and all individuals that contributed to the Eet & Leef study.
Financial support
The Eet & Leef study was part of the ‘Healthy Food Environments’ project funded by an NWO VENI grant (451-17-032). This study is also part of EXPOSOME-NL, which is funded through the Gravitation programme of the Dutch Ministry of Education, Culture, and Science and the Netherlands Organization for Scientific Research (NWO grant number 024.004.017) and EXPANSE, which received funding from the European Union’s Horizon 2020 research and innovation programme under grant agreement number 874 627.
Conflicts of interest
There are no conflicts of interest.
Authorship
N.Z.S. conceptualised and designed the current study, performed the formal analysis, drafted the initial manuscript and reviewed and revised the manuscript. M.G.M.D.P. conceptualised, designed and reviewed the manuscript. F.R. reviewed the manuscript. J.W.J.B. conceptualised, designed and reviewed the manuscript. J.D.M. conceptualised and designed the Eet & Leef study and reviewed the manuscript. All authors approved the final version of the manuscript.
Ethics of human subject participation
This study was conducted according to the guidelines laid down in the Declaration of Helsinki and all procedures involving research study participants were approved by the Medical Ethical Committee of VU University Medical Center (no. 2019.307). Written informed consent was obtained from all participants.
Supplementary material
For supplementary material accompanying this paper visit https://doi.org/10.1017/S1368980023002148


 Open access