


In most developed countries, overweight/obesity is the main nutritional problem at the population level. However, in several Latin American countries, malnutrition by deficiency remains prevalent, while at the same time, overweight and obesity have increased over the past decades. The double burden of malnutrition faced by these countries constitutes a great challenge for public health and an issue of concern for governments(1,2) .
Factors such as socio-economic and education levels affect all forms of malnutrition. It has been observed that income inequality is closely related to malnutrition by deficiency but also to obesity and its associated co-morbidities; the combination of both deficiency and excess weight is mainly found in countries with low and middle incomes, depending on the country’s economic development and epidemiological stage. Obesity in low socio-economic people is increasing faster in countries with low income than in countries with higher income(1,Reference Rivera, de Cossío and Pedraza3) .
Uruguay is a country with a small population of 3 286 314, of which almost 95 % live in urban areas, and with an illiteracy rate of only 2 % in populations aged >10 years(Reference River, Pedraza and Martorell4). Over the past few years, significant progress has been made in poverty reduction, changing from 32·5 % in 2006 to 9·4 % in 2016 (moderate poverty) and from 2·5 to 0·3 % (extreme poverty) in the same period.
Prior studies conducted in the country show that the prevalence of undernutrition has been decreasing over the past 12 years, while overweight and obesity have increased steadily over the past decades, locating Uruguay among the countries with the highest prevalence of these two in Latin America(Reference River, Pedraza and Martorell4–Reference Sawaya, Martins and Hoffman7).
Uruguay is at an advanced stage of epidemiological and nutritional transition, so non-communicable diseases are at present the main cause of morbidity and mortality(8–10).
Studies conducted on the country’s school population show differences both in deficient and excess malnutrition by income levels(Reference Amarante, Arim and Severi11). There are currently no studies of malnutrition specifically targeting young children and women of reproductive age according to their education and socio-economic level.
The objective of this study is to describe malnutrition specifically among young children and women of reproductive age.
Methods
A review of existing studies and the processing of the available data were conducted for the specific purpose of this article. Three data sources were used:
1. Socio-economic characteristics of Uruguayan households: The 2012–2013 Encuesta Continua de Hogares (ECH, for its acronym in Spanish) was used to describe the socio-economic characteristics of the entire population. Random stratified sampling is applied in the ECH along with optimal allocation. The variables selected were kind of floor, wall and roof materials; sanitary system availability; connection to the drinking water network inside the home; electricity; possession of motor vehicles, television sets, computers, telephones and refrigerators; and cooking methods(12). These characteristics were classified by tertile of income for analysis.
2. Group ‘children aged < 4’: The 2013 Encuesta de Nutrición, Desarrollo Infantil y Salud, (Survey on Nutrition, Development and Health in Early Childhood, ENDIS, for its acronym in Spanish) was conducted by the National Statistics Institute between February 2012 and November 2013 and included children aged 0–4 years, and the households selected correspond to those surveyed by the ECH The final sample includes 3079 children <4 years with no exclusion criteria. All children were weighed and measured by a trained and standardised team at their homes. WHO growth standards were used to evaluate anthropometric measures: stunting (height-for-age < 2 sd), wasting (weight-for-age < 2 sd), and overweight and obesity (weight-for-height >1 sd and >2 sd, respectively)(13). A detailed description of the sampling and the data collection methods is presented elsewhere(14).
For the socio-economic level, the ECH was classed in tertiles of income. For mothers’ education, level of ECH was also classed into three categories: <6, 7–12 years and more than 12 years of education.
3. Group ‘women aged 20–49’: The 2013 Segunda Encuesta Nacional de los factores de riesgo de las enfermedades crónicas no transmisibles (Second survey on Risks Factors for Chronic Diseases, ENFRENT for its acronym in Spanish). All surveyed women between 20 and 49 years of age were included in the analysis (n 752)(Reference Sawaya, Martins and Hoffman7).
The methodology used arises from the recommendations prepared by the WHO (STEPS) applying three steps: (1) questionnaire, (2) measurement of weight, height and blood pressure and (3) biochemical measurements of a blood sample.
A multistage probabilistic sampling was carried out, with stratification by clusters without replacement and with no exclusion criteria. More details of the methodology used are presented elsewhere.
All women were weighed and measured by a specialised team at their homes according to the ENDIS methodology(13,14) .
The BMI (kg/m2) cut-off points used were those recommended by WHO, where <18·5 was considered underweight, 25–29·9 overweight and >30 obesity(Reference Kozuki, Katz and Lee15). Women were considered of short stature when their height was <1·50 m, as is commonly considered worldwide(Reference Severi and Moratorio6,Reference Kozuki, Katz and Lee15) . Details of the sampling method and data collection are presented elsewhere(16). For determining women’s income level, three categories were built based on ENFRENT: <US$ 692 per month (low income); US$ 692–1384 (medium income) and >US$ 1384 (high income). Women’s education levels were the same as those used for their children.
Statistical analysis
Means and percentages with 95 % confidence intervals were estimated for socio-demographic and nutritional measures in children <5 years and adult women (20–49 years) stratified by tertiles of wealth and education level. Differences in means and proportions between sub-group categories were tested using the test for linear combinations128 (lincom command in Stata 12.0). A P-value <0·05 was used to assess statistical significance. All statistical procedures were performed with Stata 12 considering the complex design of the survey sample (SVY module)(Reference De Rosa, Failache and Perazzo17).
Results
Regarding the general characteristics and assets of Uruguayan households, a very high percentage of asset coverage is observed in all income tertiles t, except for access to the public sanitary sewer system and the use of carbon as fuel for cooking (Table 1).
Table 1 Sample characteristics by tertiles of socio-economic status in Uruguay
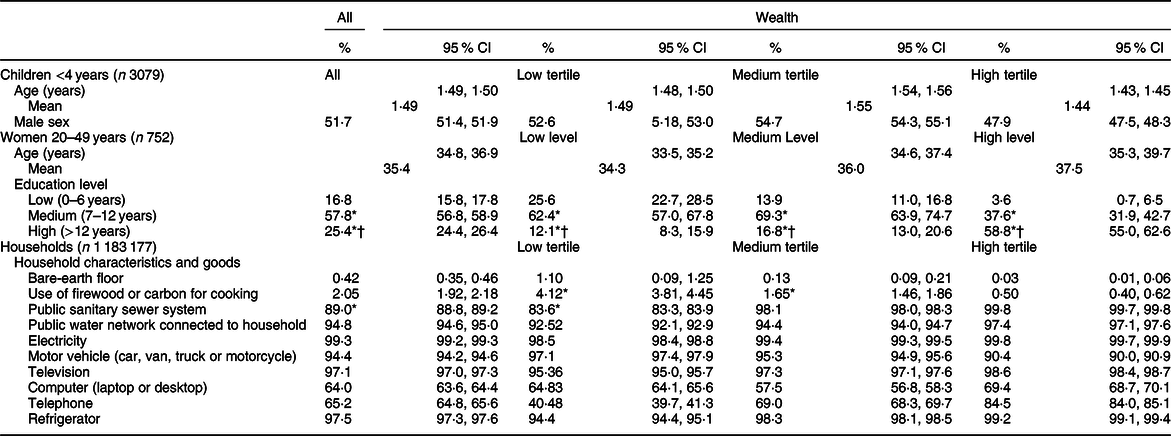
Children: <4 years and adults, *P < 0·05 v. low tertile/low education; †P < 0·05 v. medium tertile or level/ medium education.
A total of 3079 children aged under 4 years old, with a mean age of 1·49 years (95 % CI 1·48, 1·50), were included, and 51·7 % were male. There were significant differences in sex and age per income tertile (Table 1). The most common form of malnutrition detected was overweight and obesity, with 9·82 % (95 % CI 9·68, 9·96); the prevalence of stunting was 4·63 % (95 % CI 4·55, 4·75) (Table 2).
Table 2 Malnutrition’s prevalence by wealth, education level by demographic group in Uruguay
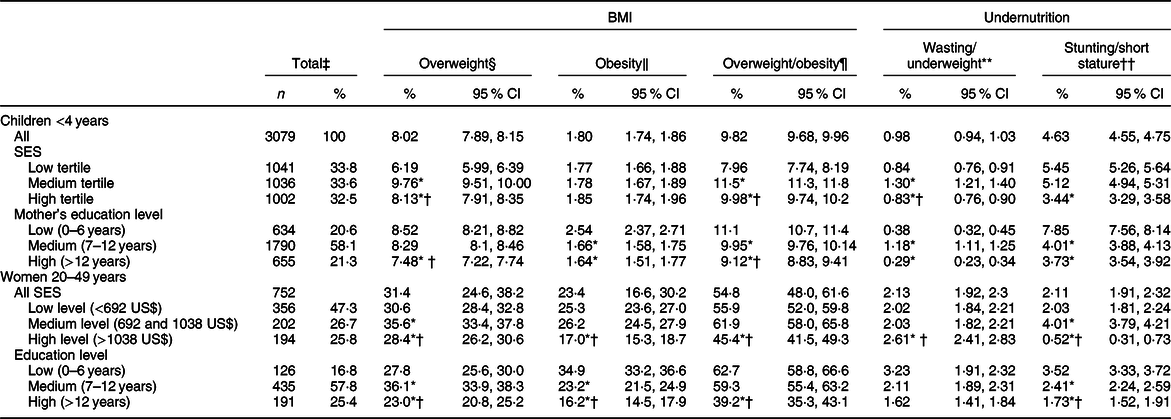
SES, socio-economic status.
‡ Weighted %.
§ Overweight: BMI-for-age z score >2 and ≤3 for children <4 years; and BMI 25–29·9 for women 20–49 years.
‖ Obesity: BMI-for-age z score >3 for children <4 years; and BMI ≥ 30 for women 20–49 years.
¶ Overweight/obesity: BMI-for-age z score >2 for children <4 years; and BMI ≥ 25 kg/m2 for women 20–49 years.
** Wasting: Weight-for-height z score <-2 for children <4 years; and BMI < 18·5 for women 20–49 years.
†† Stunting: Height-for-age <–2 for children <4 years; and short stature: height <1·50 m for women 20–49 years.
Children: <4 years and adults, *P < 0·05 v. low tertile/low education; †P < 0·05 v. medium tertile or level/medium education.
A total of 752 women aged 20–49 were analysed, with a mean age of 35·4 years (95 % CI 34·8, 36·9) and no differences per income group. There are differences in education level per income group, with higher educated women having the highest income (58·8 %) (Table 1).
Table 2 displays the prevalence of malnutrition per income group and per education level in both age groups. In children aged under 4, the most prevalent form of malnutrition was overweight, with a percentage of 9·82 % (95 % CI 9·68, 9·96), while the prevalence of stunting was 4·6 % (95 % CI 4·5–4·8), and the prevalence of wasting was very low, with 0·98 % (95 % CI 0·94, 1·03).
When analysing by income levels, significant differences were found in overweight children: rates of overweight children were slightly higher in households with higher incomes, and rates of stunted children were higher in the lower income tertile.
The children whose mothers had lower education levels were more likely to present stunting, wasting and obesity than those whose mothers had higher education levels (Table 2).
Among the women with excess weight (overweight and obesity), there was a significant difference by wealth, with the highest percentage of overweight and obesity among women in the medium income level.
Among the women of reproductive age, there was a higher frequency of overweight, obesity and stunting among those with less education and lower socio-economic level (Table 2).
Discussion
Like other countries, Uruguay faces overweight and obesity as a public health issue in children and women(Reference De Rosa, Failache and Perazzo17). These results are consistent with the findings of other studies in Uruguay(12,16) .
This high prevalence of overweight and obesity in both children and women may be explained by the existence of an obesogenic environment that encourages non-healthy food preferences and physical activity habits. The increase in the sales of ultra-processed foods during the period 2000–2013 was 68·4 %, while the sales of ultra-processed drinks increased by 172·5 %. Ultra-processed foods and drinks are associated with increased energy density and intakes of fat, sugar, Na saturated fat and simple sugars(Reference Sawaya, Martins and Hoffman7).
The excess weight rates found in children were high, among the highest in Latin America(18). This has become a true public health problem, and the scientific literature has sufficiently demonstrated its association with obesity in adulthood and with chronic diseases, such as high blood pressure, diabetes and heart disease(Reference Janevic, Petrovic and Bjelic19–Reference Oken and Gillman21).
Uruguay is a country with a traditional welfare state associated with early urbanisation and the universalisation of primary education, different from the rest of the countries in the region(Reference Marconi and Lara22,Reference Kleinpenning23) . This appears to be linked to the low level of stunting reported in the study; stunting was reduced in Uruguay decades before the issue was addressed in other countries in the region(Reference Arroyo, De Armas and Retamoso24).
Urbanisation along with economic and social development is related to high levels of obesity in the entire population and in children(Reference Lattes25,Reference Maruapula, Jackson and Holsten26) . The prevalence of childhood obesity was found to decrease as the mothers’ educational level increased. The same has also occurred in other countries in the region(Reference Gutierrez-Fisac, Regidore and Rodriguez27). However, the same was not observed with family income; the prevalence of obesity among children was higher in the tertiles of middle and high income than in the lowest tertile(Reference Aguirre, Peña and Bacallao28). This contrasts with regional data, where childhood obesity grows as incomes decline(Reference Kain, Vio and Albala29). This may be related to Uruguay’s poor performance in secondary education, as reported by the Instituto Nacional de Evaluación Educativa 2019(30).
Households have enjoyed increased incomes, especially in the last decade, but it would seem that since this has not been accompanied by improvements in the educational level, it has not resulted in increased sensitivity to and care for the quality of children’s food(Reference Brida, Lanzilotta and Risso31).
The strength of this research is that it is based on studies with large representative samples in all age groups.
More detailed studies should be carried out to study the reasons for the excess weight issues, which are different from the malnutrition issues in the rest of the countries in the region.
Acknowledgements
Acknowledegments: The authors thank Andrea Vigorito, Alejandra Marroig and Rafael Alonso. DSM contributed in this which had no role on the design, analysis or writing this article. Financial support: This work was supported by DSM. Conflict of interest: None of authors declared a conflict of interest. Authorship: The authors’ responsibilities were as follows: all authors designed the article, wrote the manuscript and had primary responsibility for final content; Cecilia Severi critically reviewed the manuscript.


